
Effect of Stress Factors on the Coagulogram of Common Carp, Cyprinus carpio

1Department of Veterinary Medicine and Biotechnology, (Vologda State Dairy Farming Academy named after N.V. Vereshchagin), Vologda Region, Vologda, Russia, 160555, grid.445059.9
2Department of Foreign Languages, (Vologda State Dairy Farming Academy named after N.V. Vereshchagin), Vologda Region, Vologda, Russia, 160555, grid.445059.9
Corresponding Author E-mail: vetxwork@gmail.com
DOI : http://dx.doi.org/10.13005/bbra/2866
Download this article as:
![]()
The paper presents the results of a study of the coagulogram of common carp (Cyprinus carpio) following stress induced through acute hypoxia within 72 hours. In addition, stress markers (glucose, cortisol, hemoglobin) were analyzed on the basis of correlation and regression. It has been established that by the increase in thrombin time (TT), activated partial thromboplastin time (APTT) and an increase in the level of fibrinogen in fish blood by the 4th day of the experiment, that the coagulation processes were accelerated under the influence of hypoxic stress. Also, the dynamics of the stress markers corresponds to the stages of the classical adaptation syndrome. It has been concluded that any of them can be used to indicate stressful conditions.
KEYWORDS:Coagulation; Cortisol; Fish; Hemostasis; Hypoxia; Stress
Introduction
The study of the physiological adaptations of an organism to various environmental conditions, one of which is the hemostatic system, represents a current scientific problem. Thus, the main goal of this work was to assess the effect of stress reactions caused by hypoxia on carp coagulogram indices.
In view of the fragmentation of the sources, the differences in methodology and facilities,1,2 as well as the lack of standardization of the study of hemostasis in various fish species under various stressful environments, this problem remains unclear.
The internal, external, and general pathways of the blood coagulation system of bony fish were first demonstrated in the works of other researchers 3,4,5. Studies conducted on bony fish indicate that the coagulation process is fundamentally similar to that of other vertebrates, in particular to mammals 1,6,7. Recently, Russian researchers obtained data on the functionality of primary and secondary hemostasis in various fish species with low activity of plasma factors, such as fibrinogen level, TP, and PP compared with mammals.8 A comparative analysis of these data revealed that there are both similarities and differences in the coagulogram indices in different classes of fish.9
Fish handling can result in a significant stress response, and it is safe to assume that interspecies differences in blood coagulation in fish may well be the result of different responses of these fish to stress.
Stress resulting from fish-farming operations is mainly associated with hypoxia, which is exacerbated by increased activity during the pursuit, attempts to break free of the net, etc. Stressful reactions are caused mainly by catecholamines and cortisol,15,16,17 which act for two different but overlapping time periods.
Since the content of catecholamines has not been measured in most studies on fish stress, some authors identify them by indirect signs.18,19,20 However, the adrenal response to stress in fish remains unclear. Smith claims that adrenaline secretion increases under conditions of acute hypoxia.18 Some studies show that catecholamines, primarily adrenaline, play a significant role in all types of reproduced stress.21
There is an extensive database of studies on the effect of various types of stress of commercial and wild fish. In most of these studies an increase of cortisol (and glucose) concentrations in plasma were experimentally recorded. 22,23,24,25,26,27,28,29,30,31,32 In other experiments, the levels of cortisol, glucose, and some other hematological parameters did not change significantly.33 The conclusions of some studies emphasize the importance of cortisol in fish as a stress hormone,34,35 as well as an indicator of various disturbances in the aquarium environment.36 Other researchers also noted that the level of cortisol in the organs and tissues of fish can be used in biomonitoring their wintering conditions.14 Wedemeyer and Yasutake suggested using cortisol and glucose of plasma for fish health evaluation.18
The literature indicates that coagulation time in fish is a rather unstable indicator, which depends not only on the method of blood drawing, but also on environmental factors and the physiological state of fish.37 The same source suggested that the stress factors obviously increase the rate of blood coagulation in fish, although the author advises that a caught fish is a fish subjected to a severe stress, and interspecific differences in blood coagulation in fish may well be the result of differences resistance of these fish to stress.
It is also worth noting a review of studies where the activation of hemostatic mechanisms in fish under stress conditions was identified.1 According to a number of the researches coagulation time is a good indicator of stress, and its reduction can be the result of an increase in the level of catecholamines and cortisol that are released during stress.
Material and Methods
The research was conducted in strict accordance with ethical principles established by the European Convention on protection of the vertebrata used for experimental and other scientific purposes (adopted in Strasbourg in March 18, 1986 and confirmed in Strasbourg in June 15, 2006) and approved by the local ethic committee of the Federal State Budgetary Educational Institution of Higher Education the Vereshchagin State Dairy Farming Academy of Vologda (Record 12, dated December 3, 2015).
The studies were carried out in aquaria conditions on 8 carps (Cyprinus carpio), grown under production-line conditions in a fish farm. The fish were kept in a tank with continuous water circulation and forced aeration at a temperature of 18–20 ° C; the feeding regime was one time per day with a specialized food for this fish species.
Blood drawing from animals was carried out after twenty-four-hours acclimatization and also 24, 48, and 72 hours after the influence of the stress factor what meets the method of conducting an acute experiment for fish. The complex stress factor was the actual fish capture for blood sampling and the total hypoxia, as well as the further deprivation of dissolved oxygen to the environment by turning off the oxygen compressor for all the next days of the experiment.
Fish were anesthetized with clove oil at a dose of 0.033 ml / l.38 Blood drawing was carried out with a syringe from the tail hemal canal in a volume of 0.77% of the fish body weight (1.2 kg on average) for examination of the coagulogram — in plastic test-tubes (3.8% sodium citrate solution in a ratio of 1: 9), for the analysis of stress markers — in plastic test-tubes without anticoagulant. All studies were performed during the first two hours after blood drawing.
The parameters of plasma-coagulation hemostasis were determined on the coagulometer “Thrombostat” manufactured by Behnk Elektronik, Germany.39 To assess the state of plasma-coagulation hemostasis the following indicators were determined: APTT (activated partial thromboplastin time), PT (prothrombin time), TT (thrombin time) using human thrombin, quantitative analysis of fibrinogen. The plasma fibrinolytic activity was measured by detecting soluble fibrin-monomer complexes (SFMCs) in an o-phenanthroline sample (tablet version). The concentration of cortisol in blood plasma was determined by means of solid-phase chemiluminescent immunoassay. Plasma glucose concentration was determined by biochemical method. Blood hemoglobin was determined by the cyanmethemoglobin photometric method using KFK-2 (ZOMZ, USSR). The level of dissolved oxygen in water was determined by means of O2-test-systems (Tetra, Germany).
The values of the results obtained are presented in the form of the average value and the standard error of mean (M ± m). The significance of differences in the coagulogram indices of carps was evaluated using the Mann-Whitney test for independent samples. The significance of differences in the coagulogram indices and the carp stress markers obtained during the experiment was evaluated using the Wilcoxon test for dependent samples. A qualitative interpretation of the strength of the connection between stress reactions and coagulogram indices was performed according to the obtained value of R based on the Cheddock scale 40.
Results and Discussion
As a result of the experiment, the following data on the dynamics of oxygen in the aquarium were obtained: on the 1st day — 5.0 mg / l, on the 2nd day — 4.8 mg / l, on the 3rd day — 3.2 mg / l, and on 4th day – 2.0 mg /l.
It was noted that the plasma cortisol level on the 1st and 3rd days after the combined exposure to stress factors was significantly different from the 2nd day, and by the 4th day the cortisol level decreased significantly. This can be explained according to classical concepts on the process occurrence in stages, where the 1st and 2nd days of the experiment correspond to the first stage (anxiety), the resistance stage appears on the 3rd day with a significant increase of plasma cortisol level, and its sharp decrease by the 4th day corresponds to the stage of exhaustion [graph. 1].
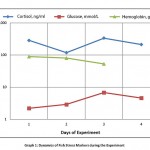 |
Graph 1: Dynamics of Fish Stress Markers during the Experiment |
The plasma glucose level in the experiment on the 1st day was significantly different from the 3rd and 4th days, while the 2nd one had significant differences with only the 4th day. Analyzing the dynamics of glucose level, one can draw the same parallel with the occurrence in stages of the stress process as with cortisol [tabl.1].
Table 1: Dynamics of Carp Stress Markers
| Parameter | The first day, n=8 | The second day, n=8 | The third day, n=8 | The fourth day, n=8 |
| Cortisol, ng/ml | 287,2±28,9b | 118,9±56,6ac | 333,6±65,2b | 211,8±112,2 |
| Glucose, mmol/L | 2,2±0,5cd | 2,9±0,3d | 6,8±3,3a | 4,6±0,5ab |
| Hemoglobin, g/l | 89,1±2,12bd | 80,3±9,8ad | – | 52,9±1,9ab |
| a – differences are significant with the first day of research (p≤0,05)
b – differences are significant with the second day of research (p≤0,05) c – differences are significant with the third day of research (p≤0,05) d – differences are significant with the fourth day of research (p≤0,05) |
||||
The concentration of hemoglobin on the 1st, 2nd and 4th days of studies was determined under the conditions of hypoxia. It was on the 1st day significantly different from the 2nd and 4th days. An obvious decrease can be noticed in the chromoprotein in the blood of experimental animals during the experiment. Most likely, this effect is caused by blood loss associated with daily blood drawing for tests. Along with this, the effect of corticosteroids is not ruled out.
APTT on the 2nd and 3rd day of the experiment was significantly different from that on the 4th day. It can be noted that by the fourth day this indicator underwent a sharp understatement of time according to which the rate of the first phase of hemocoagulation increased.
PT on the 3rd day has significant differences with the indicators of the 2nd and 4th days. Studying PT in dynamics it should be noted that it practically did not change during the experiment.
The amount of fibrinogen in the tested animals on the 3rd day of the experiment had significant differences from that on the 1st and 4th days. It can be seen that by the 4th day of exposure to stress factors the blood fibrinogen underwent a large jump [graph.2].
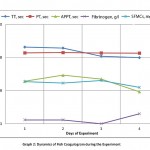 |
Graph 2: Dynamics of Fish Coagulogram during the Experiment |
TT on the 1st day of the study had significant differences with the indicators of the 3rd and 4th days; while on the 2nd day it had significant differences only from the 3rd one. Analyzing TT in dynamics it can be noted that, like APTT, it has noticeably decreased by the 4th day, what indicates an acceleration of the processes in the third phase of coagulation [tabl. 2].
Table 2: – Dynamics of Carp Coagulogam
| Parameter | The first day, n=8 | The second day, n=8 | The third day, n=8 | The fourth day, n=8 |
| TT, sec | 206,8±17,3cd | 193,0±44,8c | 109,3±10,0ab | 99,3±10,5a |
| PT, sec | 138,5±21,96 | 141,6±12,0c | 137,0±27,5bd | 135,4±0,6c |
| APTT, sec | 19,3±5,3 | 29,3±4,4d | 22,4±2,6d | 9,2±1,1bc |
| Fibrinogen, g/l | 1,3±0,2c | 1,3±0,4 | 1,0±0,2ad | 2,0±0,1c |
| SFMCs, mg % | 18,7±2,8 | 17,0±1,8c | 20,3±2,0bd | 12,5±2,5c |
| a – differences are significant with the first day of research (p≤0,05)
b – differences are significant with the second day of research (p≤0,05) c – differences are significant with the third day of research (p≤0,05) d – differences are significant with the fourth day of research (p≤0,05) |
||||
The number of SFMCs on the 2nd and 4th days of the experiment was significantly different from the 3rd day. Contrary to the assumptions about the occurrence in stages of changes SFMCs of blood plasma decreased by the 4th day.
Correlation analysis revealed the presence of a moderate to close correlation relationship between indicators of stress reactions [tabl. 3]. Analyzing the data of the table, we can conclude that all three stress markers are quite strongly interconnected, this makes it possible to use any of them to identify stress conditions. The highest quality regression models were obtained by analyzing the dependence of cortisol and glucose on hemoglobin level (R2 was 0.44 and 0.45, respectively). Correlation analysis revealed the presence of medium and high links between some indicators of the secondary link of hemostasis and the content of stress markers in the blood serum of carps [tabl. 4]. The strongest relationship was found between plasma hemostasis and levels of hemoglobin and cortisol. The correlation between the hemoglobin content and the hemostatic parameters in the blood of the tested fish was revealed from noticeable to very close. Cortisol most noticeably affects the duration of PV (r = 0.4) and inversely correlates with fibrinogen level (r = -0.3).
Table 3: The correlation Relationship between Stress Markers in Carp
| Parameter | Glucose, mmol/L | Hemoglobin, g/l |
| Cortisol, ng/ml | 0,45 | -0,70 |
| Glucose, mmol/L | 1,00 | -0,67 |
Table 4: Correlation Parameters between Stress Markers and Coagulogram Indices in Carp
| Parameter | TT, sec | PT, sec | APTT, sec | Fibrinogen, g/l | SFMCs, mg % |
| Cortisol, ng/ml | 0,10 | 0,40 | 0,05 | -0,30 | 0,15 |
| Hemoglobulin, g/l | 0,98 | -0,30 | 0,96 | 0,70 | 0,58 |
| Glucose, mmol/L | -0,16 | 0,16 | 0,06 | -0,30 | -0,13 |
Studying the complex effect of stress factors, it was found that the dynamics of the levels of cortisol and glucose used in this experiment as stress markers corresponds to the classical occurrence in stages of stress, where all three stages are visible. The main interest for us is the adaptive reaction of a coagulogram of carps to critical environmental conditions. According to numerous indicators of plasma coagulation of blood, it can be seen that its speed increased significantly during the days of the experiment and closer to the stage of exhaustion, and the prothrombin time, which plays a significant role in the formation of a blood clot in carps, deviated slightly compared to other indicators.
Based on the correlation and regression analysis, we, first of all, established a close relationship between the hemostasis indices and the hemoglobin level in the blood of stressed carps. Furthermore, the less hemoglobin level is, the more actively the internal and general links of the fish coagulation system function. Besides the indicator of the work of the external coagulation link – PT will lengthen with a decrease in hemoglobin. All these changes are likely to help stop possible bleeding, as the causes of low hemoglobin, but, at the same time, prevent excessive activation of the coagulation system, as the cause of thrombosis. Cortisol most noticeably affects the duration of PT and inversely correlates with fibrinogen level.
It is equally important that the correlation analysis revealed a moderate to close correlation between the indicators of stress reactions: cortisol and plasma glucose. All three stress markers are highly interconnected, this makes it possible to use any of them to identify stressful conditions.
An important factor was the presence of medium and high links between some indicators of the secondary link of hemostasis and the content of stress markers in the blood serum of carps, and therefore, these indicators of the coagulogram can also be used as bioindicators of critical conditions in fish.
Conclusion
Data on hemostatic indications of commercial fish in the literature, as before, remain fragmentary. The results of this work confirm the thesis of the sources cited on the large role of cortisol in the stress response, and on the acceleration of coagulation in fish in stress.
Since fish, both in natural and in artificial growing conditions, is subjected to multiple stress factors of different nature and origin, the work carried out may become the basis for further study of the impact of various conditions on the blood physiology of these animals. It is also promising to develop alternative assessments of fish health status, including hemostasis indicators.
Acknowledgments
Thanks RFBR for the source of financial support this research.
Conflict of interest
We certify that we have no Conflict of interest.
Funding Source
The reported study was funded by RFBR, project number 19-34-90109.
References
- Tavares-Dias M, Oliveira S. R. A review of the blood coagulation system of fish. Revista Brasileira de Biociências., 2009; 2.
- Lewis, Jessica H. “Comparative hemostasis.” Comparative hemostasis in vertebrates. Springer, Boston, MA, 1996. 325-359.
- Doolittle R. F, Jiang Y, Nand J. Genomic evidence for a simpler clotting scheme in jawless vertebrates. J. of molecular evolution., 2008; 66 (2):185-196.
- Doolittle R. F, Surgenor D. M. Blood coagulation in fish. American J. of Physiology-Legacy Content., 1962; 203(5): 964-970.
- Herwald H, Theopold U. Hemostasis in invertebrates and vertebrates: an evolutionary excursion. J. of innate immunity.,2010; 3(1):1.
- Kudryashov B.A. Biological problems of regulation of the liquid state of blood and its coagulation. Medicine., 1975.
- Jagadeeswaran P, Gregory M, Day K, Cykowski M and Thattaliyath B. Zebrafish: a genetic model for hemostasis and thrombosis. J. of Thrombosis and Haemostasis., 2005; 3(1): 46-53.
- Fomina L.L, Vaitsel A.E, Berezina D.I. Functional state of the system of fish hemostasis. Dairy Farming J., 2015; 2: 41-45.
- Berezina D.I, Fomina L.L, Vaitsel A.E. Comparative-physiological aspects of the system of fish hemostasis. Evolutionary and ecological aspects of studying living matter: materials I sci. conf., 2017; 1:38-43.
- Pickering, A. D., T. G. Pottinger, and P. Christie. “Recovery of the brown trout, Salmo trutta L., from acute handling stress: a time‐course study.” Journal of Fish Biology 20.2 (1982): 229-244.
- Ruane N. M., Huisman E. A., Komen J. Plasma cortisol and metabolite level profiles in two isogenic strains of common carp during confinement. J. of fish biology., 2001; 59(1): 1-12.
- Grutter, A. S., and N. W. Pankhurst. “The effects of capture, handling, confinement and ectoparasite load on plasma levels of cortisol, glucose and lactate in the coral reef fish Hemigymnus melapterus.” Journal of fish biology2 (2000): 391-401.
- O’Connor, E. A., T. G. Pottinger, and L. U. Sneddon. “The effects of acute and chronic hypoxia on cortisol, glucose and lactate concentrations in different populations of three-spined stickleback.” Fish physiology and biochemistry 37.3 (2011): 461-469.
- Prichepa M.V. Cortisol in tissues ruff and pike-perch under different conditions hibernation. Scientific notes of the Ternopil National Pedagogical University named after V. Hnatiuk. Biology. Hydroecology, 2015; 3/4 (64): 547-550.
- Schreck, Carl B., and Lluis Tort. “The concept of stress in fish.” Fish physiology. Vol. 35. Academic Press, 2016. 1-34.
- Petitjean, Quentin, et al. “Stress responses in fish: From molecular to evolutionary processes.” Science of the Total Environment684 (2019): 371-380.
- Pankhurst, N. W. “The endocrinology of stress in fish: an environmental perspective.” General and comparative endocrinology2 (2011): 265-275.
- Smith L. S. Introduction to fish physiology. Tfh Pubns Inc., 1982.
- Barcellos L. J. G. et al. Plasmatic levels of cortisol in the response to acute stress in Nile tilapia, Oreochromis niloticus (L.), previously exposed to chronic stress. Aquaculture Research., 1999; 30 (6): 437-444.
- Barry T. P. et al. Validation of a microtitre plate ELISA for measuring cortisol in fish and comparison of stress responses of rainbow trout (Oncorhynchus mykiss) and lake trout (Salvelinus namaycush). Aquaculture., 1993; 117 (3-4): 351-363.
- Mazeaud M. M., Mazeaud F., Donaldson E. M. Primary and secondary effects of stress in fish: some new data with a general review. Transactions of the American Fisheries Society., 1977; 106(3): 201-212.
- Kudryashov B.A. Biological problems of regulation of the liquid state of blood and its coagulation. Medicine., 1975.
- Romanenko, V.D, Potrokhov A.S, Zinkovsky O.G. The hormonal mechanism of energy supply of adaptation of fish to the action of mineral nitrogen. Hydrobiological J., 2010; 46(6): 58-66.
- Barcellos L. J. G. et al. Plasmatic levels of cortisol in the response to acute stress in Nile tilapia, Oreochromis niloticus (L.), previously exposed to chronic stress. Aquaculture Research., 1999; 30(6):437-444.
- Barry T. P. et al. Validation of a microtitre plate ELISA for measuring cortisol in fish and comparison of stress responses of rainbow trout (Oncorhynchus mykiss) and lake trout (Salvelinus namaycush). Aquaculture., 1993; 117 (3-4): 351-363.
- Davis K. B., Parker N. C. Plasma corticosteroid stress response of fourteen species of warmwater fish to transportation. Transactions of the American Fisheries Society., 1986; 115(3): 495-499.
- Grutter A. S., Pankhurst N. W. The effects of capture, handling, confinement and ectoparasite load on plasma levels of cortisol, glucose and lactate in the coral reef fish Hemigymnus melapterus. J. of Fish Biology., 2000; 57(2): 391-401.
- Gluth G., Hanke W. A comparison of physiological changes in carp, Cyprinus carpio, induced by several pollutants at sublethal concentrations: I. The dependency on exposure time. Ecotoxicology and environmental safety., 1985; 9(2): 179-188.
- Gluth G., Hanke W. A comparison of physiological changes in carp, Cyprinus carpio, induced by several pollutants at sublethal concentration–II. The dependency on the temperature. Comparative biochemistry and physiology. C, Comparative pharmacology and toxicology.,1984; 79(1): 39-45.
- Hegab S. A., Hanke W. The significance of cortisol for osmoregulation in carp (Cyprinus carpio) and tilapia (Sarotherodon mossambicus). General and comparative endocrinology., 1984; 54(3): 409-417.
- Ruane N. M., Carballo E. C., Komen J. Increased stocking density influences the acute physiological stress response of common carp Cyprinus carpio (L.). Aquaculture Research., 2002; 33(10): 777-784.
- Yin Z., Lam T. J., Sin Y. M. The effects of crowding stress on the non-specific immune response in fancy carp (Cyprinus carpio L.). Fish and Shellfish Immunology., 1995; 5(7): 519-529.
- Dobšíková R. et al. The effect of transport on biochemical and haematological indices of common carp (Cyprinus carpio L.). Czech J. of Animal Science., 2009; 54 (11): 510-518.
- Patiño R., Redding J. M., Schreck C. B. Interrenal secretion of corticosteroids and plasma cortisol and cortisone concentrations after acute stress and during seawater acclimation in juvenile coho salmon (Oncorhynchus kisutch). General and comparative endocrinology., 1987; 68(3): 431-439.
- Strange R. J., Schreck C. B., Golden J. T. Corticoid stress responses to handling and temperature in salmonids. Transactions of the American Fisheries Society., 1977; 106(3): 213-218.
- White, Ann, and Thelma C. Fletcher. “Serum cortisol, glucose and lipids in plaice (Pleuronectes platessa L.) exposed to starvation and aquarium stress.” Comparative biochemistry and physiology. A, Comparative physiology4 (1986): 649-653.
- Ivanov, A.A. Physiology of fish. Lan., 2011; 279.
- Hamackova, J., et al. “Clove oil as an anaesthetic for different freshwater fish species.” Bulgarian Journal of Agricultural Science2 (2006): 185.
- Fomina, L.L, Kulakova T.S, Berezina D.I. Determination of plasma-coagulation unit activity of fish hemostasis system by clotting methods using the coagulometer. Actual questions of veterinary biology., 2017; 3(35): 54-58.
- Shikhova, O. A. Mathematical Biostatistics. Vologda State Dairy Farming Academy., 2016; 90.
Accepted on: 27-07-2020
Second Review by: A K M Shafiul Kadir Shawon and Timothy Bowden
Final Approval by: Dr. Susana Rodriguez-Couto


![]()
![]()
