
The Quality by design Approach for Analytical Method Development and Validation of the RP-HPLC Method for Estimation of Quercetin in Pure, Marketed, and Cream Formulation
 and Moreshwar P. Patil
 Department of Pharmaceutics MET’s Institute of Pharmacy, Adgaon, Nashik, Maharashtra 422 003, India.
Corresponding Author E-mail: deshmukh0072@gmail.com
DOI : http://dx.doi.org/10.13005/bbra/3224
Download this article as:
![]()
A simple, precise reverse phase high performance liquid chromatographic (RP-HPLC) method has been developed and validated for the flavonoid quercetin, isolated from Tridax procumbens L. The method was validated by using Phenomenex C18 (250 x 4.6mm i.d) Column. A simple, cost effective mobile phase consisting of (ACN and 10 m/moL Phosphate buffer as mobile phase in proportion of 50:50 v/v ) pH 3, 1.0 ml/min Flow rate at 370nm by using UV Visible detector. The retention time of Quercetin was found to be 3.392 minutes. The Quercetin linearity range was found to be 05 to 25 μg/mL. The accuracy and precision of commercially available preparations and in-house cream formulations were investigated using a one-way ANNOVA test. The Percentage recovery of both formulations was found to be 99.83%, 99.88%, 99.82% and 98.92%, 98.18%, 98.86%. Robustness of analytical method was studied by using 2/3 full factorial design by using Design expert software. The Percentage assay and % RSD of marketed capsule and in house cream was found to be 98.38 %, 97.40% and 0.05273, 0.02053 respectively. The Limit of Quantitation and Limit of detection were found to be 0.9053μg/mL and 2.5435μg/mL respectively. The development method of quercetin is simple, accurate, precise, sensitive, and robust
KEYWORDS:Design Expert software; Quercetin; RP-HPLC; Validation
Introduction
Herbal medications are commonly utilised in traditional folk medicine in both developed and developing regions, including Africa, India, and China. Scientists studying viral and non-infectious disorders are particularly interested in the biologically active chemicals found in herbal sources. The name “Quercetin” (3, 3,4,5,7 pentahydroxyflavone) (Fig.no.1) comes from the Latin word “Quercetum,” which means “Oak Forest.”1 It is yellow in color and insoluble in cold water. Quercetin is one of the most widely used bioflavonoids in the treatment of inflammatory and metabolic illnesses.2 It can be found in olive oil, many seeds, buckwheat, nuts, flowers, barks, broccoli, apples, onions, green tea, red grapes, red wine, dark cherries, and berries like blueberries and cranberries. It is mostly found in citrus fruits3. The largest levels of flavonols were found in vegetables like onions and broccoli, fruits like apples, cherries, and berries, and beverages like tea and red wine.4 Quercetin is an antioxidant-rich flavonoid3.Quercetin is thought to have a variety of health benefits, including protection against osteoporosis, lung cancer, cardiovascular disease and skin disease.5, 6
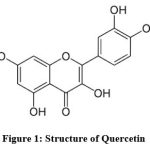 |
Figure 1: Structure of Quercetin |
The literature survey reveals that spectrophotometric 6-7, high-performance thin layer chromatography (HPTLC) [8], reverse-phase high-performance liquid chromatography (RP-HPLC) based method based methods have been reported for analysis of these drugs alone and in combination with other drugs9-10. However, no HPLC method has been reported for quantitative estimation of quercetin, in any cream formulation. Therefore, an attempt had been made to develop a novel, rapid and sensitive method for determination of quercetin, in an cream formulation and to validate the developed method according to international council on harmonization (ICH) guidelines 11. This novel validated method has applicability in industry and academia for routine quality control testing
The current study aims to validate a simple, inexpensive, quick, and sensitive RP-HPLC technique for quantitative quantification of quercetin. Using the established method, in-house cream formulations, commercial formulations, and bulk quercetin concentrations were all satisfactorily determined.
Materials and Methods
Materials
Quercetin was acquired as a sample gift by Yucca Private Limited in Mumbai. HPLC grade acetonitrile, Analytical Grade Sodium acetate, glacial acetic and orthophsphoric acid were purchased from SD fine chemicals, Mumbai, India. HPLC grade water and Millipore membrane filter (0.22 mm, Millipore) were used throughout the experiments. The marketed formulation (Health vit 100mg) was purchased from an ayurvedic medicine store in Nashik. pH meter (Hanna), Sonicator (Bronson), HPLC instrument (Water Alliance e2695), Spectrophotometer UV/Vis (Shimadzu).
Experiment
Wavelength Selection
A 10-ppm quercetin sample was produced in methanol and scanned against ACN as a blank to determine the absorption maxima in the 200–800 nm regions. The ultraviolet spectrum of quercetin was measured at 370nm.
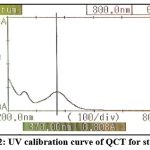 |
Figure 2: UV calibration curve of QCT for standard. |
Chromatographic Parameter 7, 8, 9
The chromatographic system consisted of an Alliance e2695 Separation Module equipped with an online degasser and an automatic injector, as well as a 2998 photodiode array detector .The method was developed by using reverse phase on a Phenomenex C18 column (250 4.6mm i.d, particle size 5 mm). Several tests revealed that the mobile phase (ACN and 10 m/moL Phosphate buffer in a 50:50 v/v) pH 3 with 1.0 ml/min flow rate and 20 l sample size) provided increased chromatographic separation with good resolution. The experiment was carried out at room temperature and at 370 nm wavelength. The total run time of chromatographic separation was 10 min. Data were collected and processed using Empower 3 software for an HPLC system (Waters, Milan, Italy).
Standard Stock Solutions Preparation 10
10mg of Quercetin was accurately weighed and placed to a 10ml volumetric flask before filling with methanol. (Stock solution A-1000 μg/mL.).1ml of Stock solution A was introduced to a 10ml volumetric flask and makeup the volume by using mobile phase (Stock solution B-100 μg /mL).
Procedure for Calibration curve 11
Pipette out 0.5, 1.0, 1.5,2, 2.5, mL of Quercetin solution from stock solution (B-100 μg /mL) and makeup the volume upto 10 Ml by using mobile phase with concentrations ranging from 5 μg /mL to 25 μg /mL was generated.
Procedure for analysis of Capsule formulation 12
Twenty capsules were precisely weighed. A quantity of powder containing 10 mg of QCT was weighed and placed in a 10 mL volumetric flask with 7 mL of methanol. After 15 minutes, it was ultrasonically treated and Makeup the remaining volume. To make sure there was no particle matter, a small amount was taken and put through a 0.45 m filter.
Procedure for Analysis of Cream Formulation 9, 13
The amount of cream equivalent to 10 mg Quercetin was weighted and transfer into 10 mL methanol. After 15 minutes, the content was ultrasonicated. To ensure the absence of particle matter, a small sample was taken and filtered through a 0.45m filter before being diluted again.
Analytical method validations 13-25
The International Conference of Harmonization recommendations were followed in the validation of the developed quercetin RP-HPLC technique.
Specificity
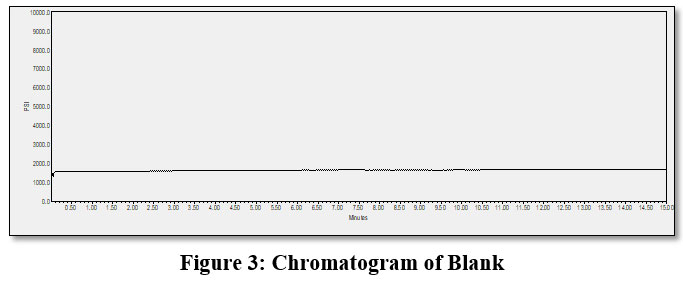
The placebo solution was diluted to the equivalent concentration of drug in standard solution and subjected to the chromatographic analysis. Specificity was carried out as bank, placebo, standard and sample solution was injected and interference was examined. The blank chromatogram did not shown any peak at the quercetin retention time. As a result, we can conclude that the established method was specific shown in fig.no.3.
Linearity.
The linearity of the given method of quercetin standard solutions with concentrations ranging from 05 to 25 μg /mL were produced. A calibration curve with concentration vs. Peak area was plotted by injecting above prepared solutions.
Accuracy and precision
According to the label claim, the accuracy was assessed using the standard addition method at three distinct drug concentrations (80%, 100%, and 120%). Analyzing the resulting mixture in triplicates over successive three days. The % recovery of added drug and % RSD were taken as a measure of accuracy and precision, respectively. Also, the results obtained were subjected to one way ANOVA and within-day mean square and between-day mean square were determined and compared using F-test with standard F-value.
Limit of detection
The limit of detection (LOD) is the lowest analyte concentration that produces an accurate response but cannot be measured. DL = (3.3 / S), where S is the slope of the calibration curve and is the standard deviation (SD) of the response (y-axis).
Quantitation limit
The limit of quantitation (LOQ) is the smallest amount of analyte required to generate a valid response. QL = (10 / S), where is S the calibration curve slope and is the response standard deviation (SD) (y-axis).
Robustness
The term “robustness” relates to a method’s ability to stay unaffected by tiny but deliberate changes in method parameters (such as pH, mobile phase composition, temperature, and instrument settings).
System suitability.
System suitability was established by injecting six replicate injections of standard solution of quercetin. The theoretical plate number, tailing factor, resolution Quercetin peaks, and height equivalent to theoretical plate (HETP) for drugs were calculated.
Results and Discussion
The method was developed by utilizing the several mobile phase. The different compositions were tried and a satisfactory separation and good peak symmetry were obtained with the selected mobile phase composition 50:50 v/v, pH 3, 1.0 ml/min flow rate at 370nm. The revised procedure took 3.392 minutes to elute quercetin. The chromatogram of Quercetin generated is shown in Figure 4. Quercetin has 5152 theoretical plates, according to study. It took roughly ten minutes to finish each experiment. The comparative data were obtained through the marketed Healthvit Quercetin 100mg Capsule formulation with quercetin(1%) loaded Shatdhauta Ghrita cream that showed the better result with the standard range.
Method Validation
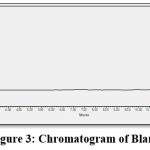 |
Figure 3: Chromatogram of Blank |
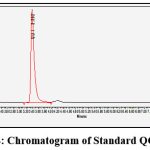 |
Figure 4: Chromatogram of Standard QCT drug |
Specificity
Figure 3 the blank Chromatogram has no peak at the Quercetin retention time. As a result, it is reasonable to conclude that the established approach is specific.
Linearity
To find the detection wavelength, quercetin in methanol at a concentration of 10 ppm was utilized. The investigation was conducted at 370 nm for the drugs that had demonstrated the best response. The peak quercetin concentration curve (5 to 25 g/ml) was found to be linear. The correlation coefficient (R2) for each medicine was greater than 0.999 it shown that method was linear. The calibration curves for QCT are shown in Figure 5. The regression equations are also depicted in these figures. Table.no.1 displays linearity data.
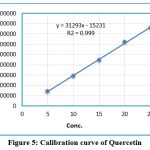 |
Figure 5: Calibration curve of Quercetin |
Table 1: Linearity data of Quercetin
| Conc. | Area |
| 05 | 144874 |
| 10 | 293247 |
| 15 | 447865 |
| 20 | 622032 |
| 25 | 762809 |
| R2 | 0.999 |
| Slope | y = 31293x – 15231 |
Accuracy and precision
According to the label claim, the accuracy was assessed using the standard addition method at three distinct drug concentrations (80%, 100%, and 120%). The percentage recovery of added drug was used as a measure of accuracy. The accuracy and precision experiment results are shown in the table below. The accuracy and precision investigations demonstrated that the mean value of the amount of drug identified was quite comparable to the amount of drug added. One way ANOVA was used to measure accuracy and precision data .Statistical data shown in table no.2 and 3.
Table 2: Accuracy Precision data of Capsule Formulation.
| Amount Added | Amount Found (μg/mL) | Within mean square | Between mean square | F value | ||
| 80%
( 18 μg/mL) |
18 | 17.9 | 18.031 | 0.01655 | 0.014315 | 2.594 |
| 17.89 | 18.01 | 18.02 | ||||
| 17.879 | 18 | 18.011 | ||||
| Mean | 17.923 | 17.97 | 18.02 | |||
| Recovery (%) | 99.57 | 99.83 | 100.11 | |||
| SD | 0.06691 | 0.608 | 0.010 | |||
| %RSD | 0.3682 | 0.3384 | 0.0554 | |||
| 100%
(μg/mL) |
19.98 | 20.1 | 20.04 | 0.02646 | 0.043089 | 4.884 |
| 19.79 | 20 | 20 | ||||
| 19.87 | 19.99 | 20.03 | ||||
| Mean | 19.88 | 20.03 | 20.023 | |||
| Recovery (%) | 99.4 | 100.15 | 100.11 | |||
| SD | 0.0953 | 0.0608 | 0.0208 | |||
| %RSD | 0.4793 | 0.3035 | 0.1038 | |||
| 120%
( μg/mL) |
21.99 | 22.01 | 22.014 | 0.027933 | 0.00435 | 4.671 |
| 21.869 | 21.9 | 21.967 | ||||
| 21.95 | 22.06 | 21.897 | ||||
| Mean | 21.936 | 21.99 | 21.959 | |||
| Recovery (%) | 99.70 | 99.95 | 99.81 | |||
| SD | 0.0614 | 0.08185 | 0.05887 | |||
| %RSD | 0.2799 | 0.3722 | 0.2680 | |||
Table 3: Accuracy Precision data of cream formulation.
| Amount Added | Amount Found (μg/mL) | Within mean square | Between mean square | F value | ||
| 80%
( 18 μg/mL) |
17.85 | 17.78 | 17.69 | 0.009133 | 0.015622 | 5.1318 |
| 17.85 | 17.84 | 17.77 | ||||
| 17.84 | 17.86 | 17.79 | ||||
| Mean | 17.846 | 17.826 | 17.75 | |||
| Recovery (%) | 99.14 | 99.033 | 98.611 | |||
| SD | 0.00577 | 0.0146 | 0.05291 | |||
| %RSD | 0.0323 | 0.2335 | 0.2981 | |||
| 100%
(μg/mL) |
19.68 | 19.59 | 19.6 | 0.002067 | 0.008089 | 11.74 |
| 19.67 | 19.63 | 19.61 | ||||
| 19.69 | 19.64 | 19.63 | ||||
| Mean | 19.68 | 19.62 | 19.61 | |||
| Recovery (%) | 98.40 | 98.10 | 98.05 | |||
| SD | 0.01 | 0.0264 | 0.01527 | |||
| %RSD | 0.05081 | 0.1345 | 0.07786 | |||
| 120%
( μg/mL) |
21.72 | 21.69 | 21.77 | 0.003954 | 0.008747 | 6.63486 |
| 21.74 | 21.7 | 21.74 | ||||
| 21.75 | 21.711 | 21.82 | ||||
| Mean | 21.73 | 21.70 | 21.82 | |||
| Recovery (%) | 98.77 | 98.63 | 99.18 | |||
| SD | 0.01527 | 0.01050 | 0.04041 | |||
| %RSD | 0.07027 | 0.04838 | 0.1851 | |||
Detection Limit
The LOD stands for the lowest detectable limit. The detection limit for quercetin was calculated using the slope and SD of the response, result of 0.9053 μg /mL.
Quantitation Limit
The quantitation limit for quercetin was found to be 2.5435 μg /mL.
Assay
The retention time in the chromatograms of the drug samples did not change. There were no excipient obstructions, which are typically found in solutions. The drug content was found to be 98.38% with a % RSD of 0.05273 in capsules and 97.40 with a % RSD of 0.02053 in creams, as indicated in Table no.4 and 5. The % RSD value suggested that the approach was suitable for regular analysis of Quercetin in commercial and in-house cream formulations.
Table 4: Assay of marketed preparation.
| Amount of drug in vial (mg) | Amount of Drug Found (mg) | % Amount found | Average | ±SD | %RSD |
| 10 mg | 9.854 | 98.54 | 98.38 | 0.05188 | 0.05273 |
| 10mg | 9.88 | 98.80 | |||
| 10mg | 9.78 | 97.80 |
Table 5: Assay of In house cream preparation.
| Amount of drug in vial (mg) | Amount of Drug Found (mg) | % Amount found | Average | ±SD | %RSD |
| 10 mg | 9.76 | 97.60 | 97.40 | 0.020 | 0.02053 |
| 10mg | 9.741 | 97.41 | |||
| 10mg | 9.72 | 97.20 |
Robustness
The robustness of the validated method was analysed by using 2/3 full factorial design by using Design Expert® ver.7.0.0 software. As shown in Fig. 6, 7, and 8. The following polynomial equation indicates that there is no substantial influence. It demonstrates the dependability of our method.
Theroetical Plate = 5181.50-5.75× A+32.00× B+13.75× C-5.75 × A × B+4.50× A ×C+19.7 × B × C+5.00 × A × B × C
Tailing = 1.23-0.025-0.050× A-0.10× C+0.050× A× B-0.050× A× C+0.075× B× C-0.025× A× B× C
Retention time =3.32-0.063× A-0.31× B-0.44+C0.28× A× B-0.090× A+C0.19× B× C-0.44× A× B× C
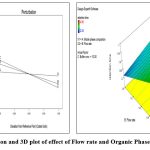 |
Figure 6: Perturbation and 3D plot of effect of Flow rate and Organic Phase composition on RT. |
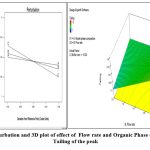 |
Figure 7: Perturbation and 3D plot of effect of Flow rate and Organic Phase composition on Tailing of the peak |
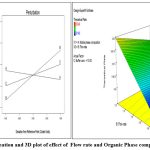 |
Figure 8: Perturbation and 3D plot of effect of Flow rate and Organic Phase composition on RT. |
System Suitability testing
System appropriateness tests are important in method development because they demonstrate what constitutes an acceptable level of performance for chromatographic systems. Peak asymmetries, retention period, and the assumed number of plates (N). Table 6 reveals that the results were within acceptable limits.
Table 6: System Suitability testing data
| Sr.no | Parameter | Result |
| 1 | Retention time (min) | 3.392 |
| 2 | Theoretical plates | 5152.4 |
| 3 | Asymmetry | 1.3 |
| 4 | Capacity factor | 32.9 |
| 5 | Tailing Factor | 1.1 |
Conclusion
The goal of the current study was to develop an RP-HPLC method for quantifying Quercetin in bulk and pharmaceutical dosage forms. The procedure passed all method validation requirements, including linearity and range, precision, accuracy, and robustness, and was produced successfully. Additionally, the approach was effectively used to measure the amount of Quercetin in a variety of commercial formulations and an internal cream formulation, indicating the selectivity and sensitivity of the method that was established. The developed method can be adopted for the routine quantification and quality control of quercetin and in in-vivo animal studies. This method was found to be better than the reported HPLC method for quercetin. The study’s favourable findings revealed that the established approach can be used to measure these medications in biological samples during preclinical or clinical trials.
Acknowledgment
The authors would like to thank the management and Principal Dr. Sanjay Kshirsagar of the MET Institute of Pharmacy in BKC for providing the essential facilities and support. The author would like to express gratitude to Dr. Sandeep S. Sonawane for technical guidance and Ms. Kavita R. Chandramore for technical assistance, as well as the NFST/RGNF/UGC, Government of India, for providing financial assistance in the form of a fellowship (Award no -2021-NFST-MAH-04091).
Ethical Approval and Consent of Participant
Not Applicable
Conflict of Interest
The author declares that they do not have any conflict of interests.
Funding Sources
There is no funding sources
References
- Anand David, A.V., Arulmoli, R. and Parasuraman, S., Overviews of biological importance of quercetin: a bioactive flavonoid. Pharmacogn Rev 10: 2016:84–89.
CrossRef - Rajesh, R.U. and Sangeetha, D A Critical Review on Quercetin Bioflavonoid and its Derivatives: Scope, Synthesis, and Biological Applications with Future Prospects. Arabian Journal of Chemistry 2023:104-881.
CrossRef - Ahmed, O.A., El-Bassossy, H.M., El-Sayed, H.M. and El-Hay, S.S.A., RP-HPLC determination of quercetin in a novel d-α-tocopherol polyethylene glycol 1000 succinate based SNEDDS formulation: Pharmacokinetics in rat plasma. Molecules, 2021 26(5), p.1435.
CrossRef - Awwalu, S., Musa, A., Musa, M.A., Nasir, I. and Garba, M, Development and validation of RP-HPLC Method for identification and quantification of quercetin in chloroform extract of Guiera senegalensis Leaf. Journal of Pharmaceutical and Allied Sciences 15 (1) (2018) 2701 – 2709
- Carvalho, D., Jesus, Â., Pinho, C., Oliveira, R.F., Moreira, F. and Oliveira, A.I, Validation of an HPLC-DAD Method for Quercetin Quantification in Nanoparticles. Pharmaceuticals, 2023 16(12), p.1736.
CrossRef - Sanghavi N, Bhosale SD, Malode Y. RP-HPLC method development and validation of Quercetin isolated from the plant Tridax procumbens L. Journal of Scientific and Innovative Research. 2014; 3(6):594-7.
CrossRef - Patil N, Mahajan H. Development and validation of RP-HPLC method for simultaneous qualitative and quantitative estimation of curcumin and quercetin in bulk mixture. Indian J Pharm Educ Res. 2022 Jan 1;56:247-54.
CrossRef - Azeem, M., Hanif, M., Mahmood, K., Ameer, N., Chughtai, F.R.S. and Abid, U, An insight into anticancer, antioxidant, antimicrobial, antidiabetic and anti-inflammatory effects of quercetin: A review. Polymer Bulletin, 80(1): 241-262.
CrossRef - Savic, I.M., Nikolic, V.D., Savic, I.M., Nikolic, L.B. and Stankovic, Development and validation of a new RP-HPLC method for determination of quercetin in green tea. Journal of analytical chemistry, 68, 2013:906-911.
CrossRef - Awwalu, S., Musa, A., Musa, M.A., Nasir, I. and Garba, Development and validation of RP-HPLC Method for identification and quantification of quercetin in chloroform extract of Guiera senegalensis Leaf. Journal of Pharmaceutical and Allied Sciences, 2018: 15(1).
- Pawanpreet, K. and Singh, Analytical method development and validation of quercetin: A review. Inter J Pharma Clin Res, 11(2) 2018:56.
- Ramaswamy, S., Gowthamarajan, K., Priyanka Dwarampudi, L., Bhaskaran, M. and Kadiyala, M, Analytical method development, validation and forced degradation studies for rutin, quercetin, curcumin, and piperine by RP-UFLC method. Drug Development and Industrial Pharmacy, 47(4), 2021:562-568.
CrossRef - Prasad, H.K., Hariprasad, R. and Rahman, S.H, Method development and validation for the simultaneous estimation of Resveratrol and Quercetin in bulk and pharmaceutical dosage form by RP-HPLC. Journal of Pharmaceutical Sciences and Research, 11(12), 2019: 3777-3781.
- Chaudhari VS, Borkar RM, Murty US, Banerjee S. Analytical method development and validation of reverse-phase high-performance liquid chromatography (RP-HPLC) method for simultaneous quantifications of quercetin and piperine in dual-drug loaded nanostructured lipid carriers. Journal of Pharmaceutical and Biomedical Analysis. 2020 Jul 15;186: p-1133-25.
CrossRef - Souza MP, Vaz AFM, Correia MTS, Cerqueira MA, Vicente AA, Carneiro-da-Cunha MG. Quercetin-loaded lecithin/chitosan nanoparticles for functional food applications. Food Bioprocess Technol. 2014;7(4):p-1149-59
CrossRef - Khursheed R,Sigh SK, Kapoor B, Gulati M,Wadhawa S,Gupta S. Development and validation of RP-HPlc method for simultaneous determination of curcumin and quercetin in extracts, marketed formulation and self-nano emulsifying drug delivery system 2021:1(1); p 43-52
CrossRef - Phattanaphakdee, W., Ditipaeng, C., Uttayarat, P., Thongnopkoon, T., Athikomkulchai, S. and Chittasupho, C,Development and Validation of HPLC Method for Determination of Quercetin in Hydrogel Transdermal Patches Loaded with Red Onion Peel Extract. Tropical Journal of Natural Product Research, 2022: 6(9).
CrossRef - Prakash O, Mahapatra DK, Singh R, Singh N, Verma N, Ved A. Development of a New Isolation Technique and Validated RP-HPLC method for Quercetin and Kaempferol from Azadirachta indica leaves. Asian Journal of Pharmaceutical Analysis. 2018; 8(3):164-8.
CrossRef - Shaikh SU, Jain VA. Development and validation of a RP-HPLC method for the simultaneous determination of quercetin, ellagic acid and rutin in hydroalcoholic extract of Triphala churna. International Journal of Applied Pharmaceutics. 2018; 10(3):169-74.
CrossRef - Patil N, Mahajan H. Development and validation of RP-HPLC method for simultaneous qualitative and quantitative estimation of curcumin and quercetin in bulk mixture. Indian J Pharm Educ Res. 2022:247-54.
CrossRef - Kumar V, Bharadwaj R, Gupta G, Kumar S. An Overview on HPLC Method Development, Optimization and Validation process for drug analysis. The Pharmaceutical and Chemical Journal. 2015; 2(2):30-40.
- Validation of Analytical Procedures: Text and Methodology, International Conferences on Harmonization, Draft Revised (2005), Q2 (R1). 20. Validation of Compendial Procedures United State Pharmacopeia, USP 36 NF, 27 (2) (2010).
- Gupta, A.D. K. Jain, N.S. Gill, K. Gupta, Development and validation of HPLC method – a review , Int. Res J Pharm. App Sci., 2(4) 20121:7-25
- Borman P, Elder D. Q2 (R1) validation of analytical procedures. ICH Quality Guidelines. 2017; 5:127-66.
CrossRef - ICH Haromonised Tripartite Guideline, International Conference on Harmonisation on Technical Requirements for Registration of Pharmaceuticals for Human Use, Q2A, Text on Validation of Analytical Procedures, Step 4 of the ICH process, 1994 and Q2B, Validation of Analytical Procedures: Methodology, Step 4 of the ICH process, 1996, ICH Steering Committee.
Abbreviations
QCT: Quercetin
RP-HPLC: Reverse Phase High Performance Liquid Chromatography.
ICH: International Conference on Harmonisation
RT-Retention time
LOD: Limit of Detection
LOQ: Limit of Quantitation
SD: Standard Deviation
%RSD: Relative Standard Deviation
Accepted on: 19-02-2024
Second Review by: Dr. Nitin Kokare
Final Approval by: Dr. rer. Nat. Hesham Ali El-Enshasy


![]()
![]()
