
Exploring the Proximate Composition, Antioxidant Content, Glycemic Index, and Microbiological Analysis of Idiyappam Enriched with Black Rice (Oryza sativa L. indica) Flour
 and S. Parameshwari2*
 Department of Nutrition and Dietetics, Periyar University, Salem, Tamil Nadu, India.
Corresponding Author E-mail: parameshwari@periyaruniversity.ac.in
DOI : http://dx.doi.org/10.13005/bbra/3228
Download this article as:
![]()
Notwithstanding being rich in numerous antioxidant components, black rice flour hasn't been frequently used in the manufacture of food goods. This study aimed to create idiyappam, examine its proximate compositions, minerals, antioxidant, glycemic, organoleptic and shelf-life attributes. The study focused on evaluating these qualities in idiyappam produced with various replacement levels of black rice flour and white rice flour, in various proportions with 0%, 25%, 50%, 75%, and 100%. The findings showed that the idiyappam with 100% raw black rice flour (BRFI4) had significantly higher levels of total dietary fiber, protein but can be found that it has a lowest of moisture content, while carbohydrates and fat content can be seen more in BRFI1. There were noticeable differences in mineral composition among the various formulations. BRFI4 exhibited strong antioxidant potential, and all formulations had a low glycemic index. BRFI3 received superior sensory ratings compared to the other idiyappam variations. The shelf-life study revealed substantial variation among the idiyappam formulations after 5 days of storage. This study highlights that incorporating black rice flour into idiyappam not only enhances the levels of protein, dietary fiber, but also results in low glycemic index values and favorable organoleptic evaluations, particularly up to a 75% substitution level.
KEYWORDS:Antioxidant; Black Rice; Glycemic Index; Idiyappam; Shelf Life
Introduction
A common staple food in Asia and throughout the world, black rice is officially known as Oryza sativa L.indica. Because it can be used as flour, starch, or cooked form, it is an essential component of many different recipes, including puffed rice. To guarantee the superiority, uniformity, and contentment of the finished product, one must comprehend the special characteristics of rice1.
Asia is home to the majority of the world’s producers of black rice, including Bangladesh, China, Indonesia, India, Japan, Myanmar, Sri Lanka, and Thailand. Emperor’s rice, fortune rice, forbidden rice, purple rice, and king’s rice are some of the names given to this type of rice2.
Key areas for farming black rice in North Eastern India are Manipur, Assam, and Meghalaya. This kind of rice is called differently in each state. It is called Kola sawl in Assam and Chak-Hao in Manipur. It is called Jaiong by the Jaintia and Khasi tribes of Meghalaya, while the Garo or A’chik ethnic group refers to it by such name as Mi-gisim.
It is well known that black rice has more nutritional value than regular rice since it frequently has higher amounts of minerals and trace elements. Its sensory qualities, nutritional advantages, and functional health aspects have drawn attention. In addition to being a high-quality source of fibre and carbohydrates, black rice also has a wealth of functional lipids, dietary fibre, vitamins B complex, A, and E, minerals potassium, iron, zinc, copper, magnesium, manganese, and phosphorus, anthocyanins, phenolic compounds, and phytosterols3.
Furthermore, whereas white rice contributes significantly to glycemic load in many rice-consuming communities, black rice grain has been recognised by Chinese traditional medicine for its ability to control diabetes4.
The class of flavonoids called anthocyanins, which gives black rice its colour, is essential to human health. They function as the grain’s main bioactive component4. Their capacity to lower oxidative stress and offer defence against hypercholesterolemia and associated metabolic disorders is just one of their many beneficial health impacts5. In Europe, Australia, and New Zealand, these naturally occurring colorings (sometimes referred to as anthocyanins) are certified under E number E163, which makes them suitable for use as clean-label substitutes for artificial colouring agents. They may give food vibrant shades of blue, purple, and red6.
Studies have demonstrated that anthocyanins exhibit antioxidant characteristics; cyanidin, in particular, has been shown to impede the vitro activities of cyclooxygenase (COX) enzymes7. The chemo-preventive and anticancer effects of antioxidants have been established by Kadiri et,al8. A dose-dependent decrease in cell growth and proliferation has been seen in studies employing cancer cell lines from several origins, including the mouth, breast, colon, and prostate9. But it’s been noted that different cell lines may react differently to these impacts.
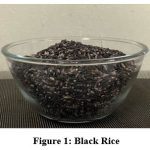 |
Figure 1: Black Rice |
Idiyappam, also recognized as “String Hopper,” are a well-loved culinary delight in Sri Lanka, Tamil Nadu, Kerala, and the southern reaches of Karnataka. These delicate creations are crafted from rice flour, meticulously kneaded into a dough, and combined with a pinch of salt and water, whether hot or cold. The dough is then skillfully shaped into noodle-like strands and gently steamed to perfection. String hoppers hold a special place in the hearts and meals of the people, often gracing the breakfast and dinner tables due to their economical nature. The essential ingredients for idiyappams are white rice flour, salt, and water. While in most regions of Tamil Nadu and Kerala, idiyappams are transformed into sevai and subsequently steamed, the Kongu district in Tamil Nadu follows a distinctive approach more a kin to Ottu Shavige, a traditional dish in neighboring Karnataka, as elucidated by Malkanthi and Hiremath10.
These health advantages have led to an increase in interest in exploiting colored rice for manufacturing food products for consumption by people.
Food’s function has evolved to include more than just satisfying hunger and meeting nutritional requirements; it is now expected to have health benefits (functional food). The consumption of harmful foods selected for their cheaper cost, simpler preparation, and higher palatability has, however, markedly shifted away from attributes that promote healthier meals. As a result, the prevalence of diabetes, obesity, heart disease, and conditions linked to cancer has increased11. Specifically, diabetes is a common ailment that affects 463 million individuals worldwide (74.9% of whom live in low- and middle-income countries), and its diagnosis is estimated to cost the healthcare system USD 760.3 billion11.
Based on the synthesis of reactive oxygen molecules that can result from hyperglycaemia, type 2 diabetes has been linked to oxidative stress in the past. By inducing oxidative injury in the pancreatic islets, this oxidative stress may have an impact on insulin production. However, studies have demonstrated that antioxidants can lower blood sugar and shield pancreatic cells from oxidative damage9.
Since rice often affects blood sugar levels more slowly than other carbs, its source has a considerable impact on the variety of carbohydrates consumed and the makeup of the diet12. Furthermore, a prior study found a link between the prevention of degenerative diseases including diabetes and cardiovascular disease and the ability of foods high in antioxidants to neutralise free radicals13.
Shelf-life studies encompass a wide range of food types and forms, encompassing solid, semi-solid, and liquid varieties. Various storage methods are employed for different samples, often simulating real-world conditions by placing them on store shelves or during transportation processes. Foods can be subjected to a variety of ecological conditions, including relative humidity, temperature, exposure to light, and air concentrations of oxygen, as demonstrated by Kongkachuichai et al14. In light of this, the present investigation aimed to evaluate how different levels of black rice flour replacement impact the proximate composition, mineral content, sensory attributes, antioxidant capacity, glycemic index, and overall shelf life of idiyappam.
This study aims to formulate black rice flour idiyappam and evaluate the nutrient composition, antioxidant activity, glycaemic response, sensory quality and shelf life of the idiyappam to provide a healthier and more nutritious snack option.
Materials and Methods
Organic black rice was procured from North-East store from Chennai, Tamil Nadu, India. Additionally, rice flour and salt for making idiyappam were sourced from the local Salem market in Tamil Nadu, India.
Formulation of Flour Blends for Preparation of Idiyappam
In the preparation of idiyappam, the control sample exclusively utilized 100% white raw rice flour, while different flour blends were created based on the combinations outlined in Table 1. Subsequently, all these formulations were stowed in impermeable containers at room temperature for subsequent analysis.
Table 1: Ingredients for Formulation of Idiyappam
| Ingredients for Idiyappam | Control | BRFI1 | BRFI2 | BRFI3 | BRFI4 |
| Raw rice flour (White) (%) | 100 | 75 | 50 | 25 | – |
| Raw black rice flour (%) | – | 25 | 50 | 75 | 100 |
| Salt (g) | 1 | 1 | 1 | 1 | 1 |
| Water (ml) | 120 | 120 | 120 | 120 | 120 |
| Olive Oil (ml) | 2 | 2 | 2 | 2 | 2 |
BRFI- Black Rice Flour Idiyappam
Preparation of idiyappam
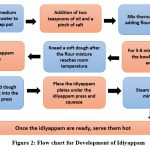 |
Figure 2: Flow chart for Development of Idiyappam |
Proximate Composition of Idiyappam
The idiyappams underwent proximate analysis, encompassing assessments for moisture and ash content15, total fat16, protein levels17, total dietary fiber18, total carbohydrate and the determination of caloric value, all carried out using standardized methods.
Minerals Composition of Idiyappam
Phosphorus, Iron, Zinc, and Copper were analyzed according to the AOAC18 protocol, while Potassium, Calcium, Magnesium, and Sodium were determined using the Indian standard methodology19.
Antioxidant Activities of Idiyappam
Preparation of Crude Extract
Two hundred grams of desiccated idiyappam powder were extracted with methanol employing the Soxhlet method at a constant temperature. By using a vacuum rotary evaporator to evaporate the solvent, the methanolic extract was recovered. The crude extract was then further processed to yield residual fractions by extracting with hexane, chloroform, and ethyl acetate after being diluted with water. To get the corresponding crude extracts, the fractions were first filtered using Whatman 1 filter paper and then evaporated under reduced pressure using a rotary evaporator. Three times these extraction processes were carried out. All crude extracts had been weighed after the solvent had evaporated and kept for later use in capped bottles at 4°C.
Total Phenolic Content
The total amount of phenolic compounds was determined using a spectroscopic technique, as explained by Ainsworth and Gillespie20. The reaction mixture was made up of 1 ml of extracts with a 1 mg/ml quantity, 1 ml of 10% Folin-Ciocalteu’s reagent, 13 ml of deionized water as the solvent, and 5 ml of a 7% Na2CO3 solutions. After being well combined, the mixture was allowed to sit at ambient level in a darkened room for a period of two hours. A solution without any components was also made ready. The absorbance at 760 nm was determined with a spectrometer. After carrying out the complete experiment in three cycles, the mean absorbance value was calculated. Through propagating the calibration range, which was created using a gallic acid solution, the total phenolic content was ascertained. The TPC was expressed as a percentage of the gallic acid equivalent (mg GAE) per gram.
Total Flavonoid Content
The aluminum chloride-based colorimetric technique was used to determine the idiyappam’s total flavonoid content, and it was modified from the strategy used by Afify et al21. To do this experiment, 0.5 mL of the sample (1 mg/ml) was mixed with 1 mL of 10% aluminum chloride, 1 ml of potassium acetate (1M), and 2.5 ml of distilled water. The calibration curve’s construction involved quercetin. The mixes’ absorbance at 415 nm was measured employing a UV spectrophotometer. The total flavonoid concentration was then determined as milligrams of quercetin equivalent per gram of the substance. The analysis was repeated three times to establish the mean wavelength value.
DPPH Radical Scavenging Activity
The technique that was proposed by Brand-Williams et al22 was slightly modified, and the antioxidant activity of the preparations was quantified by evaluating their capacity to scavenge stable 1, 1-diphenyl-2-picrylhydrazyl (DPPH) radicals. This consisted of mixing plant extract preparations at doses ranging from 0.05 to 0.20 mg/mL with 1 mL of a 0.5 mm DPPH solution in methanol. The mixed mixture was subsequently left to incubate in the dark for 30 minutes at 37°C. Butylated hydroxytoluene (BHT) was used as a positive control for comparison using the same assay conditions, and the absorbance was determined using calorimetric at 517 nm. The percentage that consisted of inhibition was calculated using the following formula after every experiment was carried out in a triplet.
DPPH Scavenging Activity (%) = [(Ao-As)/Ao)] ×100
Here, Ao represents the absorbance of the control (DPPH solution only, no sample), and as reflects the absorbance when the sample is present.
Extraction of Anthocyanin
Idiyappam was extracted three times over a period of 120 minutes each time using buffer solutions with a pH of 3.2 that contain 0.2 M disodium hydrogen phosphate and 0.1 m citric acid. A 3 kDa membrane running at 0.5 MPa was used for the first stage of filtration, which took place at room temperature. The filtrate was then added to an AB-8 resin-infused glass column that was 20 mm in diameter and 1000 mm in length. An 80% (v:v) ethanol solution was used as the eluent, flowing at a rate of 1.0 ml/min. For next experiments, the produced eluate had been gathered and kept in a freezer at -20°C. This method has been carried out from previous study done by Shozib et,al23.
Cyanidin-3-glycoside (C3G) and Peronidin-3-glycoside (P3G) content
To separate and quantify the extracts, high-performance liquid chromatography (HPLC-SSLC702) was used on a Santa Clara, California, USA-based Agilent Technologies system. The present study used a C18 rapid resolution column as the chromatographic column. Water, methanol, and formic acid were combined to create the mobile phase, which was then eluted from the column using an isocratic elution technique at a flow rate of 0.5 ml/min. The sample loop had a ten microliter (10 L) capacity. Settapramote et,al24 paper describes how the various forms of C3G and P3G were isolated and characterized at a wavelength of 510 nm.
Tocopherol Characterization and Quantification
Tocopherol, frequently referred to as vitamin E, were characterized and quantified using reverse phase HPLC-SSLC702. A Shimadzu CBM-10A system with an RF10AXL fluorescence detector and LC10AT pump was used to conduct the analysis. In order to capture and evaluate chromatograms, LC-10A class software was used. An acetonitrile, methanol, isopropanol, and aqueous acetic acid gradient solvent system was used with a Merck Hibar C18 column (4.6 mm x 250 mm, 5 m) for pump A and a mixture of acetonitrile, methanol, and isopropanol in a ratio of 25:70:5 for pump B for separating the standard solutions and extracts. 1 ml/min was chosen as the flow rate.
The fluorescent detector was set up using the methods explained by Chen and Bergman25, with the emission and stimulation wavelengths set at 298 nm and 328 nm, respectively. By contrasting their retention times to those of known standards, different vitamin E components were identified. Within the designated concentration ranges alpha-tocopherol from 3 to 45 ng, gamma-tocopherol from 3 to 55 ng, and delta-tocopherol from 0.4 to 5 ng both tocopherol and tocotrienol benchmarks showed a linear response.
Glycemic Index of Idiyappam
The amount of area underneath the glucose release curve for every sample across the 0–180 minute was subtracted from the area under the curve for a reference food (50 g of white bread) to determine the glycemic index (GI). The formula developed by Goni et al26 was used to predict the glycemic index (pGI), and it reads: pGI = 8.198 + 0.549 * HI (Hydrolysis Index).
Organoleptic Evaluation of Idiyappam
Black rice idiyappam samples were assigned codes and given out randomly to 60 trained and semi-trained panelists. The samples were evaluated for various sensory attributes, such as appearance, color, texture, aroma, taste, and overall acceptance, according to Gat & Ananthnarayan27. The sensory characteristic ratings were determined using a hedonic scale consisting of nine points, with 1 denoting “dislike extremely,” 5 denoting “neither dislike nor like,” and 9 denoting “like extremely”28.
Microbiological Analysis
Idiyappam was kept at atmospheric temperature, specifically at 28±2°C, in closed storage containers. On days 0, 3, and 5, its shelf-life had been assessed using recognized microbiological analysis which included calculating the total plate count, counting the amount of yeast and mold, and checking for the presence of E. coli by using spreading plate method. In accordance with Aljobair29 explanation, the total number of aerobic plates was counted using nutrient agar (Himedia-M001), whereas the number of yeasts and molds was counted using potato dextrose agar (Himedia-MH096) and for E.coli determination IS 5887 Part (II) method has been used.
Statistical Analysis
Three different duplicates of the data collection were used, and the results were statistically analysed using analysis of variance (ANOVA). The Duncan’s Multiple Range (DMR) test was implemented in IBM Statistical Analysis Version-25 in New York to assess the difference between means, with a significance level of 0.05.
Results and Discussion
Proximate Composition of Black Rice Flour Incorporated Idiyappam
Table 2: Proximate composition of black rice incorporated Idiyappam
| Proximate Composition | Control | BRFI1 | BRFI2 | BRFI3 | BRFI4 | F value |
| Moisture (%) | 46.2±0.01d | 46.66±0.01b | 43.28±0.01a | 41.27±0.01e | 41.00±0.02c | 146.68** |
| Ash (%) | 0.4±0.00b | 0.59±0.02d | 0.62±0.05a | 0.82±0.02c | 0.86±0.01c | 267.38** |
| Total CHO (%) | 48.52±0.67e | 48.25±0.62d | 46.51±0.34c | 45.72±0.57a | 43.56±0.47b | 169.35** |
| Protein (%) | 7.14±1.54c | 8.44±1.89a | 8.49±2.41b | 8.85±2.61c | 9.14±2.31d | 532.20** |
| Total fat (%) | 0.85±0.01b | 0.81±0.30b | 0.75±0.01c | 0.72±0.02c | 0.61±0.0a | 273.26** |
| Total Dietary Fibre (%) | 0.85±0.05c | 0.9±0.01a | 0.92±0.04d | 0.94±0.06d | 0.97±0.05b | 209.15** |
| Caloric value (kcal/100g) | 236.3±2.61e | 236.7±2.41c | 227.66±1.96d | 214.4±1.87b | 211.47±2.5a | 158.89** |
** – Significant at 1% level; * – Significant at 5% level; BRFI – Black Rice Flour Idiyappam
Table 2 illustrates the proximate attributes of idiyappam. Idiyappam crafted from black rice flour exhibited the lowest moisture content at 41%, attributable to its abundant fiber content and swelling capability. As the proportion of black rice flour in idiyappam increased, the moisture content steadily decreased from BRFI1 (46.66%) to BRFI4 (41.00%) by p<0.05. It is worth noticing that the water concentration in food products has a significant impact on their texture and overall acceptability among consumers, as noted by Sharma et al30. To ensure preservation and prolong shelf life, the product’s moisture level remained within the recommended range of 10% moisture content, as advised by Okaka and Potter31.
Idiyappam had an ash level between 0.4% to 0.86%, which is quite similar to the published range of 0.26-0.97% for rice flour by Zhu et al,32. The BRFI4 sample had the maximum ash content (0.86%), whereas the control and BRFI1 samples had the lowermost ash content (0.59%). Ashes are a necessary component of a balanced diet and essential for maintaining regular metabolic processes33. As noted by Gidamis et al34, changes in the mineral quality of the soil, species, and section of the plant, as well as the stage of harvest, may all affect the ash content.
The total amount of carbohydrates ranged from 48.52% to 43.56%, with control sample had the highest level of (48.52%), and BRFI4 had significantly lower levels (43.56%). Black rice and mung bean flours had respective carbohydrate contents of 64.46% and 62.11%. This was consistent with earlier findings for food made with arrowroot flour with carbohydrate content of 72.19%35.
The amounts of protein significantly increased and ranged from 7.14 to 9.14%. According to Torbica et al36, when the protein content of the biscuits declined, more rice flour was utilized to replace wheat flour. This wasn’t consistent with our research, which showed that when comparing with biscuits by gradually introducing black rice enhanced the quantity of protein in idiyappam. The protein content of biscuit formulations and rice cultivars varied37. Starch and protein, the two primary components of food, change physicochemical properties and are essential to the final product’s quality of the biscuits30.
The control sample of the idiyappam had the higher value for fat content, at 0.85%, while the BRFI4 group had the lowest (as shown in Table -2), with the fat percentage ranging from 0.85% to 0.61%. These values were higher than what Wireko-manu and Amamoo38 communicated to but they were still within the parameters of the measurements made by Twinomuhwezi et al39. The various amounts of black rice flour was observed least value in fat content than the control sample with significant difference (p<0.05). It’s crucial to remember that during the milling and polishing of rice, the outer layer of the grain, which is composed of a substantial amount of lipids, is eliminated40.
In this investigation, the range of dietary fiber levels observed among the five idiyappam formulations ranged from 0.85% to 0.97% (see Table -2). These values align with those reported by Wireko-manu and Amamoo38, who documented a range of 0.5% to 1.95%. Eshun’s research showed slightly lower fiber levels for various rice varieties, falling between 0.59% and 0.89%41. In contrast to the present study’s findings, Twinomuhwezi et al39 reported a dietary fiber range of 0.99% to 1.01%. According to statistical analysis, the dietary fiber content of the various idiyappam formulations varied significantly (p<0.01). Rice is frequently milled to generate polished rice, which has less fiber content, as suggested by Oko and Ugwu42. Barron highlighted that the bran portion of rice is particularly abundant in dietary fiber and includes significant amounts of starch, which helps explain why brown rice has a greater carbohydrate content43. The observed heterogeneity could be explained by the fact that foreign brands of rice are typically more cultivated than domestic rice types. According to Oko and Ugwu42, other environmental elements that may affect carbohydrate percentages include soil type, agricultural techniques, precipitation, solar exposure, and temperature during growth.
Idiyappam caloric content, BRFI1 having the most calories (236.7 kcal) and BRFI4 having the least (211.47 kcal). Calorific value quantifies the quantity of heat energy generated when a certain source is ignited and is often expressed in kilojoules per kilogram (kJ/kg). It is also known as calorific power, and it measures the amount of heat produced by a unit volume of a substance after its complete combustion.
Minerals Composition of Black Rice Flour Incorporated Idiyappam
Table 3: Minerals composition of black rice flour incorporated Idiyappam
| Mineral compositions | Control | BRFI1 | BRFI2 | BRFI3 | BRFI4 | F value |
| Phosphorus (%) | 8.08±0.01ab | 10.06±0.01a | 12.09±0.01c | 14.38±0.01c | 16.56±0.02b | 241.58** |
| Potassium (%) | 6.05±0.24d | 9.07±0.15c | 10.11±1.54ac | 12.23±2.51b | 15.42±2.29a | 246.36* |
| Calcium (%) | 08.25±0.47d | 15.14±0.28a | 26.35±0.68c | 37.47±1.82ab | 42.35±5.01b | 261.35* |
| Magnesium (%) | 50.03±3.01c | 51.04±2.51c | 55.18±6.02d | 67.18±4.62c | 72.35±8.91b | 155.67** |
| Sodium (%) | 8.20±2.15b | 9.25±0.76a | 7.21±0.89d | 5.23±0.46ab | 3.26±0.53c | 326.36* |
| Iron (%) | 1.85±0.10ac | 2.54±0.20c | 3.95±0.65b | 4.75±0.62d | 6.95±0.75e | 221.38* |
| Zinc (mg/100g) | 5.26±0.97a | 12.56±2.58b | 12.58±2.49a | 13.57±1.68ac | 13.84±3.41c | 261.65* |
| Copper (mg/100g) | 5.62±1.68a | 14.52±2.67b | 15.1±2.68c | 16.24±1.68b | 17.12±2.68ac | 714.69** |
** – Significant at 1% level; * – Significant at 5% level; NS – not significant; BRFI – Black Rice Flour Idiyappam
The Table 3 presents the mineral composition of various idiyappam formulations. Phosphorus levels varied from 8.08% to 16.56%, with the highest concentrations found in BRFI4 (16.56%) and BRFI1 (10.06%) idiyappam. While BRFI3 and BRFI4 idiyappam exhibited a notable distinction from the control idiyappam at a significance level of 1%, there was no significant difference observed for BRFI1 and BRFI2 idiyappam.
The potassium content assessments in the study spanned from 6.05% to 15.42%. The highest potassium content was detected in the idiyappam made with 100% of black rice flour BRFI4 (15.42%), whereas the lowest potassium levels were observed in control idiyappam (6.05%) and BRFI1 (9.07%). There was a notable variation in potassium levels among idiyappam prepared with black rice flour.
The calcium levels in the various idiyappam formulations ranged from 08.25% to 42.35%. When comparing these four newly developed idiyappam formulations along with the control idiyappam, all four showed a statistically significant difference from the control idiyappam at a significance level of 1%. These results align with previous findings reported Abouel-Yazeed et al44.
According to Table 3, the samples of idiyappam ranged in magnesium content from 50.03% to 72.35%, with BRFI3 and BRFI4 exhibiting a statistically significant difference (p<0.05), while BRFI1 showed no significant variation when compared to the control idiyappam. These numbers are significantly less than what Ebuehi and Ovewole45 found. Additionally, as reported by Oko and Ugwu42, a larger loss of minerals occurs when more rice bran is removed during the polishing procedure.
Regarding sodium content, the lowest sodium concentration was observed in BRFI4 (3.26%), while the highest sodium content was recorded in BRFI1 (9.25%).
The iron content per 100 grams ranged from 1.85% to 6.95% in the idiyappam samples. Interestingly, all the idiyappam formulations exhibited the high iron concentration. There was a significant variation in iron content among the idiyappam formulations (p < 0.05), as illustrated in Table 3. These iron values were remarkably higher than those reported by Diako et al46. Factors like nitrogen application and soil conditions could also contribute to the variability in iron concentration among different rice varieties.
In this study, the concentrations of zinc varied between 5.26 mg and 13.84 mg per 100 grams. These values show a slight increase compared to previous research conducted by Trinidad et al47, where they observed a range of 1.40 mg to 1.79 mg per 100 grams. Wireko-manu and Amamoo38 reported a range of 1.05 mg to 2.9 mg per 100 grams, which is also slightly higher than the results obtained in our current investigation. And the copper can be observed higher in BRFI4 with the value of 17.12 mg per 100g comparing to those of other variations. The least copper content in this study can be found in control.
As per the findings of Roy et al48, the nutritional composition of rice grains exhibits significant variation based on factors such as rice plant variety (breeds), environmental factors such as geographical location and growth season, fertilizer application, extent of milling, and storage conditions. Similar to other natural foods, the specific nutritional profile of rice is influenced by factors like rice variety, soil attributes, climate conditions, and the types of fertilizers used.
Antioxidant Activities of Black Rice Flour Incorporated Idiyappam
Table 4: Antioxidant activities of black rice flour incorporated idiyappam
| Antioxidant activities | Control | BRFI1 | BRFI2 | BRFI3 | BRFI4 | F value |
| Total flavonoids (mg /100g) |
0.56±0.01a | 2.45±0.04e | 2.75±1.36d | 3.54±1.65c | 5.12±1.52b | 3.58** |
| Total phenolic content (mg/100g) | 0.45±0.01ab | 1.24±0.02c | 1.78±0.04d | 2.78±0.01b | 3.24±0.02c | 2.39** |
| Cyanidin-3-glycoside (mg/100g) | 0.86±0.12a | 12.41±1.52c | 12.85±0.98c | 23.54±2.64b | 45.12±2.34d | 4.56** |
| Peonidin-3- glucoside (mg/100g) | 0.07±0.01d | 2.35±0.97c | 3.74±1.02c | 4.58±1.52ab | 8.78±2.34d | 1.99** |
| Tocopherol (mg/100g) | ND* | 0.05±0.01b | 0.06±0.00d | 0.12±0.00a | 0.24±0.01c | 3.58** |
| DPPH (%) | 8.85±1.25a | 13.22±1.62ab | 15.67±2.45b | 22.74±1.63c | 23.45±1.64d | 5.69** |
** – Significant at 1% level; BRFI – Black Rice Flour Idiyappam, ND*- Not Detected
Comparing each formulation to the control group, the total flavonoids were noticeably higher in all of them. Idiyappam’s ingredients were different from the control preparation’s and can be found significant difference at (p<0.05) level. Water-soluble flavonoid molecules were liberated from idiyappam during steaming, giving BRFI4 idiyappam a high flavonoid concentration (5.12 mg), and control idiyappam the lowest flavonoid content (0.56 mg). Anthocyanin which is antioxidant compound has a number of positive health effects. It is a naturally obtainable flavonoid pigmentation that gives certain foods their red, purple, and blue hues. Black rice mostly contains cyanidin-3-glucoside (C3G), an important anthocyanin source in Asia. Tocopherol, oryzanols, B complex vitamins, and phenolic compounds are just a few of the biologically productive phytochemicals that can be found in black rice49.
Table 4 provides a summary of the anti-oxidant characteristics and antioxidant activity of the prepared idiyappam, which is created using various percentages of black rice flour substitute. The idiyappam made with white rice flour had a considerably lower total phenolic content than other idiyappam varieties (p<0.05). With a total phenolic content of 3.24 mg, BRFI4 had the highest level among the different idiyappam formulations, followed by BRFI3 at 2.78 mg. Notably, Loypimai et al50 found that entire colored cereal grains contain significant levels of gallic acid (GAE), a major phenolic acid, as well as numerous other phenolic acids in diverse forms (free, soluble conjugated, and insoluble bound forms).
Cyanidin-3-O-glucoside (C3G), the primary anthocyanin compound found in black rice as investigated by Hosseinnian et al51, has demonstrated anti-diabetic effects in type 2 diabetes mouse models. Purple rice flour is notably rich in C3G. In this study, it was observed that idiyappam made with 0% of black rice flour (control) contained significantly lower levels of cyanidin-3-glycosides is 0.86 mg (p < 0.05) compared to idiyappam made with varying proportions of black rice flour, including 25%, 50%, 75%, and 100%. The highest concentration have found in BRFI4 with the value of 45.12 mg. Consequently, the study suggests that black rice flour can reduce the production of glucose during starch digestion, primarily because anthocyanins like C3G inhibit the enzymes responsible for starch breakdown. According to Shao et al52, the content of C3G in black rice varies between 12.03 and 1106.00 mg/kg DW in different cultivars. Additionally, Kim et al53 observed an upward correlation between the expression of anthocyanin biosynthesis genes and the anthocyanin content of rice. This backs up the claim made by Sutharut and Sudarat54 that colored rice cultivars have higher levels of anthocyanins and antioxidant activity than non-colored rice. According to recent studies, the percentage of anthocyanins found in cereal grains, including those that are black, blue, pink, purple, and red, is greatly influenced by their color55. Additionally, this research demonstrated a significant correlation between rice anthocyanin content and grain color.
Peonidin-3-glucoside (P3G) emerged as the second notable anthocyanin compound detected in black rice. In comparison to the control group, all the prepared idiyappam variants exhibited elevated P3G levels. At a 5% significance level, a noteworthy distinction was observed between the control group and the BRFI1 and rest of the formulations. Conversely, the idiyappam formulations BRFI2 and BRFI3 were indistinguishable and displayed no significant differences.
Tocopherol level ranged from 0.05 to 0.24 mg per 100g, with a high tocopherol content found in BRFI4 idiyappam, while lesser tocopherol content was found in BRFI1 formulations, and no tocopherol content was found in control idiyappam. Black varieties of rice are characterized by their elevated levels of protein, fat, and dietary fiber, while red-hued grains are notable for their iron and zinc content (Kumar and Murali56. Rice that has been colored is an excellent source of vitamin E. Our findings are consistent with the body of research that indicates black rice flour contains high amounts of tocopherol. The consumption of black rice can lower the cholesterol levels and get rid of reactive oxygen species (ROS) including lipid peroxide and superoxide anion radicals, according to studies by Nam et al57. Black rice contains substances such anthocyanins, polyphenol compounds and flavonoids which are responsible for this advantageous effect.
The percent of inhibition of DPPH radicals, BRFI4 idiyappam had the greatest DPPH concentration (23.45), while control idiyappam had the lowest (8.85). When black rice flour was added to idiyappam instead of conventional idiyappam without it, the DPPH activity of the dish significantly increased (p<0.05). These findings suggest that switching from white rice flour to black rice flour improves the ability to scavenge DPPH free radicals. When compared to the control idiyappam, all of the different idiyappam formulations showed high DPPH activity. Notably, BRFI4 idiyappam demonstrated superior antioxidant potential among the formulations, showcasing reduced DPPH activity in control sample. The free form of the molecule exhibited the lowest DPPH value, underscoring its superior antioxidant capabilities compared to bound compounds, as reported by Ghasemzadeh et,al58. It’s worth noting, as mentioned by Pereira et,al59, that the choice of extraction techniques and solvent can influence the antioxidant potential exhibited by the samples.
Glycemic Index of Black Rice Flour Incorporated Idiyappam
Table 5: Glycemic index of black rice flour incorporated idiyappam
| Glycemic Index | Control | BRFI1 | BRFI2 | BRFI3 | BRFI4 | F value |
| GI (%) | 5.68±1.35a | 5.14±1.30d | 4.78±0.98ac | 4.25±2.10c | 3.14±1.68b | 250.35** |
** – Significant at 1% level, BRFI – Black Rice Flour Idiyappam
Table 5 and graph-1 present the glycemic index data for idiyappam containing black rice flour. The glycemic activity of idiyappam ranged from 5.68% to 3.14%. Most significantly, the glycemic indices of all the idiyappam recipes that used black rice flour were lower than those of the control group, and this result was statistically noteworthy at the 1% level. The formulations with the lowest GI value were found in BRFI4, and the control idiyappam exhibited a somewhat greater GI value. Cyanidin 3-glucoside, the main bioactive component in black rice, was discovered in earlier research by Belwal et al60 to have the ability to lessen insulin resistance. Black rice bran has been shown in studies by Hlaing et al61 and Zheng et al62 to enhance hepatic insulin signaling. Anthocyanins, which are found in black rice, have also been demonstrated to decrease plasma glucose levels, insulin resistance, and glucose intolerance in rats while raising plasma insulin secretion. It is significant to note that Watanabe63 found fewer instances of oxidative damage in the control group.
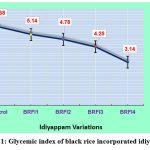 |
Graph 1: Glycemic index of black rice incorporated idiyappam |
According to Ghasemzadeh et al58, the flavonoids quercetin, apigenin, and catechins can be found in black rice bran. This was supported by the aforementioned literature, was consistent with our investigation, and was one of the primary causes of the formulated idiyappam’s low GI value. The control curve had a high starting point, however BRFI1, BRFI2, and BRFI3 had lower starting curves that showed low GI. As seen in graph-2, the curve for BRFI4 idiyappam progressively attained the lowest GI value.
Sensory Analysis of Black Rice Flour Incorporated Idiyappam
Table 6: Sensory analysis of black rice flour incorporated idiyappam
| Variations | Appearance | Colour | Aroma | Texture | Taste | Overall acceptance |
| Control | 6.93±1.05a | 6.88±0.97a | 6.83±1.18a | 6.78±1.02a | 6.66±1.27a | 6.98±0.99ab |
| BRFI1 | 7.25±1.03a | 7.25±0.70b | 7.03±1.04a | 7.13±1.06ab | 6.96±1.27ab | 7.35±0.99a |
| BRFI2 | 7.30±1.07a | 7.26±0.75b | 7.18±1.14a | 7.25±1.08b | 7.13±1.17b | 7.31±1.12b |
| BRFI3 | 7.78±0.82b | 7.61±1.09c | 7.58±0.84b | 7.63±1.05c | 7.65±0.97c | 8.03±0.86c |
| BRFI4 | 6.96±1.08a | 6.98±1.11a | 6.91±1.12a | 6.88±1.04ab | 6.73±1.26ab | 6.93±1.07a |
| F value | 7.15** | 6.45** | 5.16** | 6.45** | 6.84** | 12.58** |
In each column, sample means not having the same letter attached to them are significantly different (Duncan’s multiple range test, p < 0.05); data are expressed as mean ± standard deviation.
Table 6 presents the average sensory evaluations for various levels of black rice flour substitution in idiyappam. These evaluations spanned from 6 to 8 and indicated a range of neutrality to moderate acceptability. The idiyappam variant with the most favorable appearance was BRFI3, scoring an average of 7.78, while the appearances of all other variants did not significantly differ from the control idiyappam. Customers showed a preference for the color of idiyappam with 75% black rice flour substitution (BRFI3), as it was statistically distinguishable (p < 0.05) from the control. The color ratings for other variants, including the control, BRFI1, BRFI2, and BRFI4, did not exhibit statistically significant differences. BRFI3 also received a high aroma score of 7.58, which, at a 5% significance level, significantly set it apart from the control formulation in terms of aroma, as compared to BRFI1, BRFI2, and BRFI4.
Mancebo and colleagues in their study, developed biscuits by varying the proportions of protein and white rice flour, achieving notably high overall acceptance ratings64. Notably, substitutions with black rice flour yielded higher mean ratings for both texture and taste compared to the control, with scores increasing from 7.63 and 7.65, respectively. However, when the quantity of black rice flour in the idiyappam recipe exceeded 50%, the overall acceptability score gradually rose from 6.93 to 8.03. Nonetheless, sensory scores experienced a decline at 100% replacement levels. These findings indicate that, concerning overall acceptability, the most favored idiyappam formulations featured a 75% replacement of black rice flour.
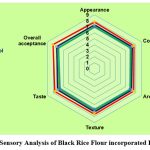 |
Graph 2: Sensory Analysis of Black Rice Flour incorporated Idiyappam |
Microbiological Analysis of Black Rice Flour Incorporated Idiyappam
Table 7: Microbiological analysis of black rice flour incorporated idiyappam
| Shelf life analysis | 0 day | 3rd day | 5th day |
| Total plate count (cfu/g) | Nil | 0.1×10² | 0.2×10² |
| Yeast & Mold (cfu/g) | Nil | <10 | <10 |
| Escherichia coli (g) | Nil | Present | Present |
The findings of the analysis of the idiyappam made with black rice shelf life are presented in Table -7. The levels of total contamination by microorganisms were calculated using total viable counts as an indicator of microbiological competence. The plate count was nil on the first day, 0.1×10² reading was found on the third day, and 0.2×10² on the fifth day of storage, according to studies on the shelf life of all the samples of prepared idiyappam. On the first day the yeast and mold count was nil, and on the third, fifth days of storage, the yeast and mold counts were found to be lower than 10 cfu/g. Furthermore on the E. coli test on the first day it was found to be nil and on the other two days (third and fifth day) the sample was found that the E.coli was present during the storage period. The TPC can be used as an indicator for monitoring sanitary practices throughout the processing of milk, transportation, and preservation, in accordance with Worku et al65.
Conclusion
The identification of the possible health advantages of adding black rice flour to idiyappam formulations is one novel conclusion of this investigation. The study found that when idiyappam supplemented with up to 75% black rice flour was prepared differently from traditional formulations, it showed better proximate composition qualities, such as higher amounts of protein and dietary fibre and lower levels of moisture and fat. These enhanced idiyappam also showed remarkable mineral content, with notable amounts of vital minerals like potassium, phosphorus, calcium, magnesium, iron, zinc, and copper.
Moreover, adding black rice flour to the idiyappam increased its antioxidant capacity; formulations with larger black rice flour percentages demonstrated the strongest antioxidant activity. Crucially, in their anti-glycemic evaluations, every formulation showed reduced glycemic index values, indicating possible advantages for those with diabetes and other non-communicable disorders. Idiyappam with 75% black rice flour was rated as having better taste and overall sensory appeal than other formulations, according to the results of the sensory evaluation. Nevertheless, after five days of storage, evaluations of the microbiological analysis showed differences in the quality of the idiyappam formulations. Ultimately, the study shows that adding black rice flour to idiyappam can improve its nutritional content and health-promoting qualities, which makes it a viable choice for people looking to make healthier dietary choices, especially those who have non-communicable diseases like diabetes.
Acknowledgement
The authors are thankful towards the Department of Nutrition and Dietetics, Periyar University, Salem and Global Laboratory and Consultancy Services, Salem for providing the laboratory for analysis facility and guidance to carry out this research work.
Conflict of Interest
The author(s) did not disclose any potential conflicts of interest.
Funding Sources
National Fellowship for Schedule Tribes (NFST Fellowship)
Authors’ Contribution
Authors are required to provide a statement detailing the specific contributions of each author to the manuscript.
This original research manuscript belong to first author HYMIE CHERIK R. SANGMA and the manuscript has been edited and corrected by the second author as well as the Corresponding Author – PARAMESHWARI S.
Data Availability Statement
Not applicable
Ethics Approval Statement
Not applicable
References
- Joshi ND, Mohapatra D, Joshi DC. Varietal selection of some indica rice for production of puffed rice. Food and bioprocess technology. 2014;7:299-305.
CrossRef - Ito VC, Lacerda LG. Black rice (Oryza sativa L.): A review of its historical aspects, chemical composition, nutritional and functional properties, and applications and processing technologies. Food chemistry. 2019;301:125304.
CrossRef - V., Zielinski. A., Demiate, I., Spoto, M., Nogueira, A., Lacerda, L. Effects of gamma radiation on the stability and degradation kinetics of phenolic compounds and antioxidant activity during storage of (Oryza sativa L.) black rice flour. Brazil Arch Biol Technol. 2019; 62:1–14.
CrossRef - Aalim H, Wang D, Luo Z. Black rice (Oryza sativa L.) processing: Evaluation of physicochemical properties, in vitro starch digestibility, and phenolic functions linked to type 2 diabetes. Food Research International. 2021; 141:109898.
CrossRef - Daotong L, Pengpu W, Yinghua L, Mnegyao Z, Fang C. Health benefits of anthocyanins and molecular mechanisms: Update from. Critical reviews in food science and nutrition. 2017; 58(7):1729-41.
- Kang SY, Seeram NP, Nair MG, Bourquin LD. Tart cherry anthocyanins inhibit tumor development in ApcMin mice and reduce proliferation of human colon cancer cells. Cancer letters. 2003; 194(1):13-9.
CrossRef - Oboh, G. ,Ademosun, A. O. , Olasehinde, T. A. , Oyeleye, S. I. , &Ehiakhamen, E. O. Effect of processing methods on the antioxidant properties and inhibition of α‐amylase nd α‐glucosidase by African pear (Dacryodes edulis) fruit. Nutra Foods. 2015; 14(1):19-26.
CrossRef - Kadiri O. A review on the status of the phenolic compounds and antioxidant capacity of the flour: Effects of cereal processing. International Journal of Food Properties. 2017; 20(1):798-809.
CrossRef - Reynolds A, Mann J, Cummings J, Winter N, Mete E, Te Morenga L. Carbohydrate quality and human health: a series of systematic reviews and meta-analyses. The Lancet. 2019; 393(10170):434-45.
CrossRef - Malkanthi A, Hiremath US. Pumpkin powder (Cucurbita maxima)-supplemented string hoppers as a functional food. International Journal of Food Nutrition Sci. 2020; 9: 2-6.
CrossRef - International diabetes federation. IDF Diabetes Atlas, 7th edition. Brussels, Belgium: International Diabetes Federation. 2015; 33:2.
- Saragih B, Rachmawati M, dan Suhardi M. Nutrition and blood glucose response of food formulated four types of local flour east kalimantan added plant extracts tiwai (Eleutherina americana Merr). IOSR J Environ Sci Toxicol Food Technol. 2017; 11(2):37-43.
CrossRef - Oboh, G., Ademosun, A. O., Ademiluyi, A. O., Omojokun, O. S., Nwanna, E. E., &Longe, K. O. In vitro studies on the antioxidant property and inhibition of a-amylase, a-glucosidase and angiotensin-1-converting enzyme by polyphenol-rich extracts from cocoa (Theobroma cacao) bean. Pathology Research International, 2014; 549287.
CrossRef - Kongkachuichai, R., Kounhawej, A., Chavasit, V., & Charoensiri. Effects of various iron fortificants on sensory acceptability and shelf-life stability of instant noodles. Food and nutrition bulletin, 2007; 28(2): 165-172.
CrossRef - Indian Standard (IS 1155:1968 (R.2010) method for determination of sodium and potassium (flame photometric), New Delhi.
- AOAC Official Methods of Analysis of the Association of Official Analytical Chemists: Official Methods of Analysis of AOAC International. 21st Edition, AOAC, Washington DC, 2019; 2003.05.
- Indian Standard (IS 7219:1973(R.2005), method for determination of sodium and potassium (flame photometric), New Delhi.
- AOAC (AOAC 21st Edn. 2019, 991.25) Official Methods of Analysis of the Association of Official Analytical Chemists: Official Methods of Analysis of AOAC International. 21st Edition, AOAC, Washington DC; 2019.
- Indian Standard (IS 5949:1990) method for determination of sodium and potassium (flame photometric), New Delhi.
- Annisworth, EA & Gillespie, K. Estimation of total phenolic content and other oxidation substrates in plant tissues using Folic–Ciocalteu reagent. Nature protocols, 2007; 2 (4): 875-877.
CrossRef - Afify, AE, El-Beltagi, HS, El-Salam, SM & Omran, AA. Biochemical changes in phenols, flavonoids, tannins, vitamin E, β– carotene and antioxidant activity during soaking of three white sorghum varieties. Asian Pacific Journal of Tropical Biomedicine, 2012; 2(3): 203-209.
CrossRef - Brand-Williams, W., Cuvelier, M. E., & Berset, C. L. W. T. Use of a free radical method to evaluate antioxidant activity. LWT-Food science and Technology, 1995; 28(1): 25-30.
CrossRef - Shozib HB, Islam MM, Mahmud SA, Bari MN, Akter N, Jahan S, Hosen S, Hossain MN, Nabi AN, Siddiquee MA, Haque MM. Application of Cyanidin-3-Glucosides as a functional food ingredient in rice-based bakery products. Saudi Journal of Biological Sciences. 2021; 1;28(12):7472-80.
CrossRef - Settapramote N, Laokuldilok T, Boonyawan D, Utama-ang N. Physiochemical, antioxidant activities and anthocyanin of rice berry rice from different locations in Thailand. Food Application of Bioscience Journal. 2018; 6:84–94.
- Chen, M.H., & Bergman, C.J. (2005). A rapid procedure for analyzing rice bran tocopherol, tocotrienols and gama oryzanol contents. Journal of Food Composition and Analysis, 2005; 18:319–331.
CrossRef - Goni, I., A. Garcia-Alonso, and F. Saura-Calixto, “A starch hydrolysis procedure to estimate glycemic index,” Nutrition Research, 1997; 17 (3): 427–437.
CrossRef - Gat, Y.; Ananthanarayan, L. Use of paprika oily extract as pre-extrusion colouring of rice extrudates: impact of processing and storage on colour stability. J. Food Sci. Technol. 2016; 53(6): 2887–94.
CrossRef - FDA/CFSAN. U.S., F.D.A.C.f.F.S.A.N. Bacteriological Analytical Manual. 2001.
- Aljobair MO (2022) Physicochemical, nutritional, and sensory quality and storage stability of cookies: effect of clove powder, International Journal of Food Properties, 2022; 25(1): 1009-20.
CrossRef - Sharma, S., Saxena, D.C. and Riar, C.S. Nutritional, sensory and in-vitro antioxidant characteristics of gluten free cookies prepared from flour blends of minor millets, Journal of Cereal Science, 2016; 72:153–161.
CrossRef - Okaka J. C. and Potter, N. N. Functional and storage properties of cowpea-wheat flour blends in bread making,” Journal of Food Science, 1977; 42(3): 828–833.
CrossRef - Zhu, L. J., Liu, Q. Q., Wilson, J. D., Gu, M. H., & Shi, Y. C. Digestibility and physicochemical properties of rice (Oryza sativa L.) flours and starches differing in amylose content. Carbohydrate Polymers, 2011; 86(4): 1751-59.
CrossRef - Lucarini, M., Canali, R., Cappelloni, M., Di Lullo, G., & Lombardi-Boccia, G. (1999). In vitro calcium availability from brassica vegetables (Brassica oleracea L.) and as consumed in composite dishes. Food Chemistry, 1999; 64(4):519-23.
CrossRef - Gidamis, A. B., Panga, J. T., Sarwatt, S. V., Chove, B. E., & Shayo, N. B. Nutrient and anti-nutrient contents in raw and cooked young leaves and immature pods of Moringa oleifera, Lam. Ecology of Food and Nutrition, 2003; 42(6):399-411.
CrossRef - Irmawati, F.M., Ishartan, D & Affandi, D.R. Pemanfaatan tepung umbi garut (Maranta arundinacea L) sebagai pengganti terigu dalam pembuatan biskuit tinggi energi protein dengan penambahan tepung kacang merah (Phaseolus vulgaris L). Jurnal Teknosains Pangan, 2014; 3(1):1-14.
- Torbica A., HadnaCev M., and HadnaCev C.T., “Rice and buckwheat flour characterization and its relation to cookie quality,” Food Research International, 2012; 48 (1):277–83.
CrossRef - Uthumporn, U., Woo U.W.L., Tajul A. Y., and Fazilah A., “Physico-chemical and nutritional evaluation of cookies with different levels of eggplant flour substitution,” CyTA-Journal of Food, 2015; 13 (2): 220–26.
CrossRef - Wireko-manu F.D., & Amamoo C., Comparative Studies on Proximate and Some Mineral Composition of Selected Local Rice Varieties and Imported Rice Brands in Ghana. Agriculture and Food Sciences Research, 2017; 4(1):1–7.
CrossRef - Twinomuhwezi, H., Awuchi C.G., & Rachael M., Comparative Study of the Proximate Composition and Functional Properties of Composite Flours of Amaranth, Rice, Millet, and Soybean. American Journal of Food Science and Nutrition, 2020; 6(1):6–19.
- Frei, M., Siddhuraju P., & Becker K., Studies on the in vitro starch digestibility and the glycemic index of six different indigenous rice cultivars from the Philippines. Food Chemistry, 2003; 83: 395–402.
CrossRef - Eshun G., Baseline data on the nutrient content and physicochemical properties of selected varieties of soybean, groundnut and rice for the development of nutritious, energy-dense diets, 2009.
CrossRef - Oko A. O., & Ugwu S.I., The proximate and mineral compositions of five major rice varieties in Abakaliki, South-Eastern Nigeria. International Journal of Plant Physiology and Biochemistry, 2011; 3(2):25–27.
CrossRef - Barron J. Black Rice Bran, the Next Superfood. Baseline of Health Foundation Retrived. 2010.
CrossRef - Abouel-Yazeed, A. M.; Nassar, M. A.; Ebaid, R. A. and Hassan, M. A., Chemical and Sensory Properties of Black Rice Compared with Giza 177 Rice Cultivar. Alexandria Science Exchange Journal, 2019; 40:574-84.
CrossRef - Ebuehi O.A.T., & Oyewole A.C., Effect of cooking and soaking on physical characteristics, nutrient composition and sensory evaluation of indigenous and foreign rice varieties in Nigeria. African Journal of Biotechnology, 2007; 6(8): 1016–20.
- Diako C., Sakyi-dawson E., Bediako-Amoa B., Saalia F.K. & Manful J.T., Consumer Perceptions, Knowledge and Preferences for Aromatic Rice Types in Ghana. Nature and Science, 2010; 8(12): 12–19.
- Trinidad, T. P., Mallillin, A.C., Sagum, R.S., Briones, D.P., Encabo, R.R., & Juliano, B.O., Iron absorption from brown rice / brown rice-based meal and milled rice / milled rice-based meal. International Journal of Food Sciences and Nutrition, 2009; 60(8): 688–693.
CrossRef - Roy P., Ijiri T., Okadome H., Nei D., Orikasa T., Nakamura N., & Shiina T., Effect of processing conditions on overall energy consumption and quality of rice (Oryza sativa L.). Journal of Food Engineering, 2008; 89(3): 343–348. https://doi.org/ 10.1016/ j.jfoodeng.2008.05.015.
CrossRef - Jang HH, Park MY, Kim HW, Lee YM, Hwang KA, Park JH, Park DS, Kwon O. Black rice (Oryza sativa L.) extract attenuates hepatic steatosis in C57BL/6 J mice fed a high-fat diet via fatty acid oxidation. Nutrition & Metabolism. 2012;9:1-1.
CrossRef - Loypimai P, Moongngarm A, Chottanom P, Moontree T. Ohmic heating-assisted extraction of anthocyanins from black rice bran to prepare a natural food colourant. Innovative food science & Emerging technologies. 2015;27:102-10.
CrossRef - Hosseinian F.S., Li W., and Beta T., “Measurement of anthocyanins and other phytochemicals in purple wheat,” Food Chemistry, 2008; 109(4): 916–924.
CrossRef - Shao Y., Hu Z., Yu Y., Mou R., Zhu Z., and Beta T., “Phenolic acids, anthocyanins, proanthocyanidins, antioxidant activity, minerals and their correlations in non-pigmented, red, and black rice,” Food Chemistry, 2018; 2(39): 733–41.
CrossRef - Kim BG, Kim JH, Min SY, Shin K-H, Kim JH, Kim HY, Ryu SN., Anthocyanin content in rice is related to expression levels of anthocyanin biosynthetic genes. Journal of Plant Biology, 2007; 50(2):156–60.
CrossRef - Sutharut J, Sudarat J., Total anthocyanin content and antioxidant activity of germinated colored rice. International Food Research Journal 2012; 19(1):215–21.
- Abdel-Aal ESM., Young JC., Rabalski I., Anthocyanin composition in black, blue, pink, purple, and red cereal grains. Journal of Agriculture Food Chemistry, 2006; 54(13):4696–704.
CrossRef - Kumar, N., Murali, R.D. Black Rice: A Novel Ingredient in Food Processing. Journal of Nutrition and Food Science.2020; 10: 771.
- Nam YJ, Nam SH, Kang MY. Cholesterol – lowering efficacy of unrefined bran oil from the pigmented black rice (Oryza sativaL cv. Suwon 415) in hypercholesterolemia rats. Food Sci. Biotechnology. 2008; 17:457–63.
- Ghasemzadeh, A., Karbalaii, M.T., Jaafar, H.Z.E. et al.Phytochemical constituents, antioxidant activity, and antiproliferative properties of black, red, and brown rice bran. Chemistry Central Journal, 2018; 12(1): 1-13.
CrossRef - Pereira, P., Cebola, M.-J., Oliveira, M.C. and Bernardo Gil, M.G. Supercritical fluid extraction vs conventional extraction of myrtle leaves and berries: Comparison of antioxidant activity and identification of bioactive compounds. The Journal of Supercritical Fluids, 2016; 113: 1-9.
CrossRef - Belwal, T., Nabavi, S. F., Nabavi, S. M., & Habtemariam, S. Dietary anthocyanins and insulin resistance: When food becomes a medicine. Nutrients. 2017;9(10):1–22.
CrossRef - Hlaing, E. E., Rungjarernarreejitt, S., Fakfum, P., Kamdenlek, P., & Piamrojanaphat, P., Asian Journal of Pharmaceutical Technology & Innovation. Asian Journal of Pharmaceutical Technology & Innovation. 2019; 06(38): 33–39.
- Zheng, H. X., Qi, S. S., He, J., Hu, C. Y., Han, H., Jiang, H., & Li, X. S. Cyanidin-3-glucoside from Black Rice Ameliorates Diabetic Nephropathy via Reducing Blood Glucose, Suppressing Oxidative Stress and Inflammation, and Regulating Transforming Growth Factor β1/Smad Expression. Journal of Agricultural and Food Chemistry. 2020; 68(15): 4399–410.
CrossRef - Watanabe, M. Effects of black rice containing anthocyanins on plasma and hepatic parameters in type 2 diabetic db/db mice. Food Science and Technology Research, 2016; 22(5): 719–725.
CrossRef - Mancebo C.M., Rodriguez P., and Gomez M., “Assessing rice flour-starch-protein mixtures to produce gluten free sugarsnap cookies,” LWT-Food Science and Technology, 2016; 67: 127–132.
CrossRef - Worku, T., Negera, E., Nurfeta, A. and Welearegay, H. Microbiological quality and safety of raw milk collected from Borana pastoral community, Oromia Regional State. African Journal of Food Science and Technology, 2012; 3(9): 213–22.
Accepted on: 08-03-2024
Second Review by: Dr. Meryem Aydemir Atasever
Final Approval by: Dr. rer. Nat. Hesham Ali El-Enshasy


![]()
![]()
