
Investigation on the Mineral Configurations, Antioxidant Power, and Durability in Processed Tamarind (Tamarindus indica L.) Seed Powder
 and Parameshwari. S*
 Department of Nutrition and Dietetics, Periyar University, Salem, Tamil nadu, India.
Corresponding Author E-mail:parameshwari@periyaruniversity.ac.in
DOI : http://dx.doi.org/10.13005/bbra/3171
Download this article as:
![]()
The pulp from the tamarind (Tamarindus indica L.) manufacturing sector disposes of the tamarind seed as waste materials. In the present investigation, processed Tamarindus indica L. seed powders' mineral compositions, antioxidant activities, and duration of shelf life have been investigated. Standard techniques were used to analyze the mineral compositions, antioxidant activity (Total Phenolic, Flavonoid content and 2,2-diphenyl-1-picrylhydrazyl) and shelf life (Total plate count (TPC), fungi, and mold) in processed tamarind powder at periodic intervals of 0, 2, 4, 6, and 8 months. The subsequent minerals were substantially more abundant in the roasted T.indica seed flour. The roasted T. India seed powder had high antioxidant powers of 19.83mg of TFC, 49.5mg of TPC, and 31 g/ml of 2,2-diphenyl-1-picrylhydrazyl (DPPH). The roasting method increases the best antioxidant potency and low glycemic index and glycemic load. The total plate counts of the processed T. India seed powder were within the legally permitted ranges of 107 cfu/g, and fungi and mold proliferation were at extremely low levels, so the powder could be used to make additional nutritional products. Roasted seed powder can be employed as a therapeutic food and as a food supplement because of its vital mineral elements and strong antioxidant potential.
KEYWORDS:Antioxidant; Mineral; Processing; Powder; Shelf Life; Seed; Tamarind
Introduction
The tamarind (Tamarindus indica L.) ranks as one of the foremost well-known plants in India. The leguminous tree is a tree with multiple uses since all of its parts are utilized in a wide range of businesses. 250,000 tons of tamarind produce 100,000 tons of discarded seeds1. It is a commodity that is underutilized, and an examination of these seeds is crucial because little is known about how they are arranged or how to use them since the bulk of them are annually thrown away as waste. These seed oils can be used for a variety of purposes if they are studied. Even though there hasn’t been much research on the seeds and their full potential, they are typically viewed as a waste2. The tamarind polysaccharide, sold under the trade name jellose, is used in both the food and pharmaceutical sectors. Tamarind seeds contain the ideal amount of both necessary and optional amino acids3. The tamarind seed is an excellent source of polyunsaturated fatty acids and contains certain minerals like potassium, calcium, and phosphorus4, 5.
Currently, businesses are interested in generating value-added goods from the agricultural and food crop sectors’ waste by-products6. Plant waste materials such seeds, peels, stalks, stems, and leaves have high phenolic content and can be exploited as inexpensive sources of organic antioxidants for food, beauty products, and pharmacological applications7. Consuming meals made from plants that are rich in bioactive phytochemicals, often known as phytochemicals, has been shown in epidemiological studies by Ovaskainen et al. (2008)8 and Galili and Hovav (2014)9 to have a protective impact against diseases linked to oxidative stress. Human cancer, aging, atherosclerosis, and oxidative stress are all strongly correlated with one another10. Thus, the advantageous phytochemical substances lessen the risk of chronic illnesses, cardiovascular disease, cancer, and age-related degenerative disorders11, 12.
Tamarind seeds consists of a variety of phytochemicals, including the phenolic antioxidants epicatechin, 2-hydroxy-3, 4-dihydroxyacetophenone, methyl 3, 4-dihydroxybenzoate, and 3, 4-dihydroxyphenyl acetate, according to Andabati and Muyonga (2014)13. Tamarind seeds that have been extracted show antioxidants abilities by lowering in vitro lipid peroxidation and possessing antibacterial qualities14, 15. Tamarind seeds may therefore offer beneficial nutritional and nutraceutical qualities at an acceptable cost.
The period of time a product may be stored without losing its usability or nutritional value is known as its shelf life. It is the recommended maximum storage period for products16, during the period when a specific percentage of the items maintain the proper quality under the conditions of transportation, preservation, and exhibition. A food product must be safe to eat, maintain its look, flavor, and texture as well as any nutritional claims made on the label, all within the recommended shelf life. Even though the rate of decay varies, all foods eventually become less nutritious. Microbial (bacteria, yeast, and mold) and non-microbial (rancidity, browning, and loss of nutrients) growth, as well as product-related elements including oxygen accessibility, pH, and water activity, have a direct effect on the nutritional value of food17, 18.
The goal of this study is to replace conventional food with processed tamarind seeds because of their high nutrient and phytochemical content, making them a necessary raw material for the food industry. The goal of the present study was to study the mineral contents, antioxidant capacities, and durability in processed T. indica seed powders.
Materials and Methods
Selecting components
At the Salem district, local market in Tamilnadu, India, tamarind (T. Indica) seeds had been purchased. Prior to examination, the seeds were properly cleaned, dried in the sun, processed using a variety of processes, ground into powder, and stored in an airtight container.
Estimation of mineral compositions of processed Tamarindus indica L. seed powder
About 1g of the ash material was placed in 250 ml pre-cleaned borosilicate beakers were used for digestion. Nitric acid (20 ml) was added to the weighted sample in the beaker for ingestion in the fume cupboard. The beaker and the liquid inside were allowed to digest for some time, then cooled. The combination in the fume cupboard received an additional 20ml of the dissolving solvent before being allowed time to cool to room temperature. The mixture was passed through filtering using a borosilicate container with a volumetric capacity of 250ml. The filtration system was topped off with deionized water. For measurement using an atomic absorption spectrophotometer (AAS), every component that had been digested was subsampled and put in meticulously cleaned borosilicate glass containers. From the heavy metal base solution of the analyte, which contained 1000 mh/l, solutions of iron, calcium, potassium, sodium, magnesium, copper, and zinc were created. The set of reference solutions and the filtrate from the digestion specimen were both subjected to AAS analysis. Using the SOLAAR programme and UNICAM 929 London Atomic Absorption Spectrophotometer, it was discovered that the sample’s metal content was 0.0001 mg/l. The mineral concentrations in the reference standards and sample supernatant were determined using cathode lamps with calcium, iron, sodium, potassium, magnesium, and zinc. The flammable substance was produced by compressing an acetylene and air gas combination. The calibration curve is different for each metal analysis. The measurement curve also contains the equation and the correlation coefficient2.
Antioxidant activity of processed Tamarindus indica L. seed powder
Total Flavonoid Content (TFC)
The Total Flavonoid Content (TFC) has been identified using the Chougui et al., (2013)19 technique. A small amount was created by mixing 1.5 mL of the aluminium chloride reagent (2%) and 1.5 mL of the methanol extracts. At room temperature and in the dark, the aliquot was then let to stand for 30 seconds. A comparison to a control was used to determine the absorbance at 430 nm. To create the control, combine 1.5 mL of methanol with 1.5 mL of the aluminium chloride reagent (Sigma-Aldrich, St. Louis, MO, USA). TFC was calculated using catechin as the standard in a linear regression (R2 = 0.97). mg of catechin equivalent (CE) per 100 g of dry weight (DW) was used as the unit of measurement to show the results.
Total Phenolic Content (TPC)
The Chougui et al., (2013)19 method was used to determine the Total Phenolic Content (TPC). Separately, the 1.5 mL of the Folin-Ciocalteu reagent (Sigma-Aldrich, St. Louis, MO, USA) and the 0.5 mL of the methanol extract were diluted ten times. After incubation for five minutes, 1.5 mL of sodium carbonate (6%) had been added. The mixture’s absorbance at 760 nm was assessed after an hour of dark incubation before being compared to a control. The linear fitting method was employed to calculate TPC using gallic acid, which is the industry standard (R2 = 0.96). A milligram of gallic acid equivalent (GAE) per 100 gram of dry weight (DW) is used to express the results.
2,2-diphenyl-1-picrylhydrazyl (DPPH) radical scavenging assay
The antioxidant capacity (DPPH assay) was evaluated using the procedure described by Abdel-Hameed et al. (2014)20. One millilitre of newly made DPPH solution (100 mM, Sigma-Aldrich, St. Louis, MO, USA) was added to the obtained extract. The control was made by combining 1 mL of DPPH methanolic solution with 1 mL of methanol. The spectral density of the reaction product at 517 nm has been evaluated in comparison to a control after 30 minutes of dark incubation. The scavenging activity (%) was calculated using the equation shown below:
In vitro starch digestibility, GI and GL of processed T. Indica seed powder
Considering the methods that were outlined by Goni et al. (1997)21, the sample’s in-vitro starch digestibility and GI were evaluated. The samples were thoroughly gelatinized by cooking them in 5 mL of tap water for 30 min at 80°C in sealed tubes. White bread was the sole specimen left out of this process. After homogenizing for 2 minutes, 10 mL of HCl-KCl buffer (pH 1.5) had been added. The sample was then treated with 0.2 mL of a 1 g pepsin solution diluted in 10 mL of HCl-KCl buffer (pH 1.5), and it was allowed to incubate for 60 minutes at 40 °C in a water bath with shaking. After that, the sample was increased to 25 mL employing 15 mL of tris maleate buffer (pH 6.9). For the formation of maltodextrins, approximately 5 mL of tris maleate buffer containing 2.6 IU of -amylase from pig pancreas (Sigma Aldrich) was added to the sample. After that, the flask was dropped into a bath of agitated, 37°C water. To inactivate the -amylase, aliquots of 0.1 mL from each flask were taken and put into the test tube at intervals of 0, 10, 20, 30, 60, 90, 120, 150, and 180 minutes. After that, the mixture had been treated with amyloglucosidase (Sigma Aldrich) and 0.4 M sodium-acetate buffer (pH 4.75) at 60°C for 45 minutes to produce glucose from the maltodextrins. A glucose oxidase-peroxidase kit from Sigma Aldrich was used to measure the glucose levels. The transformation of glucose into starch is described by the following formula.
Starch % = mg glucose x 0.9
The average time of starch digestion has been estimated using the total amount of starch hydrolysed at various times (0, 10, 20, 30, 60, 90, 120, 150, and 180 minutes). The following formulae were used to compute the rates of starch hydrolysis, the hydrolysis index (HI), the area under the hydrolysis curve (AUC), and the index of glycemic control (GI).
Calculating the Glycemic Load
A processed T. indica seed powder’s glycemic load is determined through doubling the quantity of easily digestible carbohydrates by the food’s glycemic index, then dividing by 100.
Shelf-life evaluation of processed Tamarindus indica L. seed powder
At intervals of 0, 2, 4, 6 and 8 months, each processed tamarind powder was tested in triplicate for Total Plate Count (TPC), fungus, and mold using standardized procedures. On Plate Count Agar pour plates, total plate counts were computed and counted after 48–72 hours of incubation at 37°C. Total plate count (TPC) gives information on the food’s shelf life and hygiene characteristics. Higher values outside of the range that is permitted at most imply inappropriate handling of the raw materials and unsanitary processing methods. On Potato Dextrose Agar pour plates, fungi and moulds were enumerated after 120 hours of incubation at 25°C22. Petri plates are gradually rotated, moved diagonally or parallel, or arranged into an eight shape until the material is thoroughly mixed. A blank check is also carried out concurrently by fusing the buffer and the media. The next mixture in a petri dish is given time to freeze. The next stage entails placing all of the petri dishes upside-down in the incubators. This is known as incubation. 24-48 hours were spent incubating the cells at 36 °C. Colony growth is calculated and recorded using colony factors forming units (cfu) per gram or ml of samples23.
Data analysis
Every measurement was carried out three times in total, the data were calculated as an average, and the standard error was calculated. Data were analyzed for ANOVA (p<0.05) using IBM 25th edition (an American multinational technology company, Armonk, New York). The mean values for every processed tamarind powder have been compared employing Duncan’s Multiple Range Tests24.
Results and Discussion
The tables below summarize the findings on the mineral compositions, antioxidant activity, and shelf-life study of processed T. indica seed powder.
Mineral compositions of processed Tamarindus indica L. seed powder
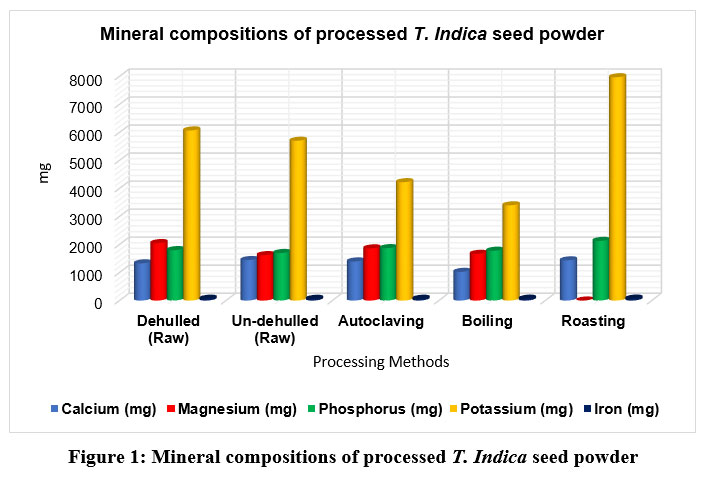
The mineral contents of processed T. indica seed flour is shown in Table 1. The amount of calcium in the processed tamarind flour ranged from 1023 mg to 1443 mg. The flour that had the most calcium, 1432 mg, and the least calcium, 1023 mg, were both discovered to be roasted flour. The presence of calcium, an essential mineral required for the growth of bones, teeth, and other neurological functions, was shown to be present in significant amounts (1432 mg/100g). However, compared to pumpkin and gourd seeds, which had an average calcium level of 73.2 and 54.9 mg/100g, respectively25, our study’s calcium content was much greater.
The magnesium content of the T. indica powder after processing ranges from 1619.66 mg to 2155 mg. Magnesium is a mineral that may be found in bones and is necessary for the synthesis of proteins, the contraction of muscles, the transmission of nerve signals, and the health of the immune system. Both dehulled and un-dehulled flour contain some magnesium, however roasting flour has a high magnesium value (2155mg) and un-dehulled flour has a low magnesium concentration (1619.66 mg). The amount of magnesium in the flour varied significantly between both processed and raw tamarind flours (p<0.05) (see Figure 1).
Every cell contains phosphorus, which is essential for strong bones and teeth. It also supports the system that regulates the acid-base balance. The amount of phosphorous in roasted tamarind seed flour (2127.66 mg/100g) was substantially greater than that of M. myristica seed flour (17.200.20 mg/100g)26. Calcium calcinations in bones are encouraged by low Ca/P ratios. Furthermore, zinc helps in taste perception, wound healing, immune system maintenance, appropriate sperm production, regular development, and achieving sexual maturity.
Table 1: Mineral compositions of processed T. Indica seed powder.
| Mineral compositions | Calcium (mg) | Magnesium (mg) | Phosphorus (mg) | Potassium (mg) | Iron (mg) |
| Dehulled (Raw) | 1325.66±251.36a | 2049±269.31a | 1798±267.65ab | 6070±648.56ac | 64.33±26.30ab |
| Un-dehulled (Raw) | 1443.66±263.41b | 1619.66±231.05c | 1694.66±295.62c | 5701.33±564.3b | 61.33±28.41a |
| Autoclaved | 1395±201.56c | 1861±204.65ab | 1868.66±231.65a | 4222.66±387.94c | 62.66±24.95c |
| Boiled | 1023±241.30ac | 1666±248.62ac | 1776.33±241.36ac | 3396.33±314.56ab | 66.33±23.64b |
| Roasted | 1432±215.63ab | 2155±268.63b | 2127.66±436.12b | 7966.66±541.63ac | 68.66±18.65ac |
Results are calculated as means with a standard deviation of three. Different superscript letters in the identical column’s mean values indicate a statistically significant variance (p<0.05).
Potassium is necessary for healthy fluid balance, nerve conduction, and muscular contraction. The potassium content of the roasted flour obtained in this study (7966.66 mg/100 g) was significantly higher than the average potassium content reported for monodora myristica seed flour (353.950.10 mg/100 g) and Hura Crepitan seed flour (62.170.1 mg/100 g), respectively26, 27. The sodium-to-potassium ratio in the body is very important in preventing excessive blood pressure support a sodium and potassium ratio that is less than 128. Because the sodium and potassium ratio in T. indica seed flour is less than 1, it may help control high blood pressure.
The iron-containing component (haemoglobin) that carries oxygen throughout the body and is essential for calorie consumption is found in red blood cells. Copper is included in several enzymes needed for iron metabolism. The iron content of processed tamarind flour ranged from 61.33 mg to 68.66 mg. The iron level of the processed tamarind flour varied depending on how it was handled, with roasted flour having the greatest iron concentration (68.66 mg), followed by boiled flour (66.33 mg), and autoclaved flour (62.66 mg).
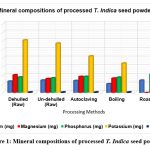 |
Figure 1: Mineral compositions of processed T. Indica seed powder |
Antioxidant activities of processed T. Indica seed powder
The TFC varied between 6.42 mg and 19.83 mg QE. The greatest overall flavonoid content was found in the roasted T. indica powder (19.83mgQE), which distinguished itself noticeably from the other processing methods. The lowest total flavonoid content (6.42 mgQE) was found in dehulled powder as compared to un-dehulled, boilled and autoclaved powder (see Table 2; Figure 2). Every processing showed a high level of flavonoid content overall and a 5% degree of variance between the powder that was noticeably different. Flavonoids are one of the main families of phenolic chemicals29. They have many different chemical and biological impacts, but their antibacterial and radical-scavenging abilities stand out30. Plants of all kinds contain them, and they are beneficial to human health. Flavonoid compounds molecules have been found to be beneficial for anti-cancer, anti-inflammatory, antibacterial, antiviral, and anti-allergic properties through investigations.
The TPC of the T. indica seed powder that had undergone treatment varied from 38.7 mg GAE/g to 49.5 mg GAE/g. Roasted flour had the highest total amount of phenolic compounds of the powders that had been treated (49.5 mg GAE/g), whereas dehulled flour had the lowest (38.7mg GAE/g). All of the processed powder exhibited good total phenolic content and, when compared to raw powder, showed a sizable difference between the flours at a 5% level. The TPC of a sample of milk thistle seed flour prepared from 50% acetone extract has been found by Parry along with other researchers to be 25.2 mg GAE/g seed flour31, which is less than what was discovered in the present study. The phenolic content of plant-based extracts is frequently determined using the Folin-Ciocalteau reagent. When samples contain a lot of ascorbic acid or the material being removed contains biological contaminants, this approach might not be as precise32. It is still a reliable way to determine phenolic content, though.
Table 2: Antioxidant activities of processed T. Indica seed powder.
| Antioxidant activity | TFC (mg QE 100 mgˉ¹) | TPC (mg GAE in 100 mgˉ¹) | DPPH (µg/ml) |
| Dehulled (Raw) | 6.42±0.85a | 38.7±2.15ac | 34.6±2.16ab |
| Un-dehulled (Raw) | 8.25±0.12ab | 39.9±2.36c | 35.1±2.43c |
| Autoclaved | 11.75±2.16b | 41.8±3.14b | 36.7±3.15ac |
| Boiled | 14±2.60c | 44±3.58a | 33±2.61b |
| Roasted | 19.83±3.54ac | 49.5±4.23ab | 31±2.68a |
TFC -Total Flavonoid Content; TPC -Total phenolic Content; Results are calculated as means with a standard deviation of three. Different superscript letters in the identical column’s mean values indicate a statistically significant variance (p<0.05).
The key determinants of a sample’s antioxidant activity32, 33are its phenolic and flavonoid content as well as additional phenolic compounds formed by the non-enzymatic browning reaction during the course of the procedure. In the current study, the activity of DPPH scavenging was seen in all of the processed T. indica seed powder samples. The amount of DPPH that was scavenged by roasted tamarind flour was the highest (31 µg/ml), and the amount of DPPH that was scavenged by autoclaved flour was the lowest (36.7 µg/ml). But compared to the other flours, the processed T. indica seed powder’s DPPH activity was substantially different (p<0.05). The IC50, or the quantity of an antioxidant molecules sufficient to reduce the initial concentration of DPPH by 50% in steady state, was another way to describe the capacity to scavenge DPPH radicals. A lower IC50 value reveals a sample’s higher radical scavenging capacity. The decrease in DPPH scavenging capacity may be brought on by an altered structure of phenolic compounds and/or peptides produced during hydrolysis as a result of protein denaturation, interactions between proteins, and/or protein-phenolic interactions34, 35.
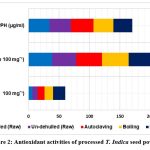 |
Figure 2: Antioxidant activities of processed T. Indica seed powder |
Glycemic responses of processed T. indica seed powder
The processed T. indica seed powder’s glycemic index is shown in Figure 3. The GI and GL values of the treated powders varied from 42.56 to 50.17 and 7.10 to 8.45, accordingly. The formed T. indica seed powders, that were classified as having a low glycemic index as well as low glycemic load, differed significantly (p< 0.05) from the processed powders in terms of their glycemic response. One could infer that incorporating processed T. indica seed powder to foodstuffs will result in a low-GI meal that could be recommended for patients experiencing diabetes who have type 2 diabetes. Foods with a GI of 55 are classified as low-GI foods by the World Health Organization (WHO)36.
A typical and significant source of carbs is meal. The significance of how the kind and quantity of carbohydrates affect human health has been demonstrated in numerous researches. The glycemic index (GI), which evaluates the nutritional value of carbohydrates in relation to how well they ability to be absorbed and digested, has gained popularity as human diets and habits have changed37. To describe the impact of the kind and amount of carbohydrates in meal components on blood sugar levels, the words glycemic index (GI) and glycemic load (GL) were created38. Consequently, these measurements are crucial for the well-being of humans. According to a study by Brand-Miller et al. (2007)39, proteins, lipids, and acidity all lower GI by prolonging stomach emptying. The glycemic response is delayed as a result of fibers. It causes the initial phase of the gut’s flow to be slowed down, delaying the assimilation of assimilable carbohydrates and producing a hypoglycemic effect40. Fibers prevent the activity of the enzyme’s glucosidase and pancreatic amylase, which lowers the absorption of macronutrients via the gastrointestinal tract41.
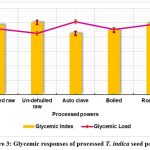 |
Figure 3: Glycemic responses of processed T. indica seed powder |
Shelf-life evaluation of processed T. indica seed powder
All of the samples had the same TPC value of 0.1 x 10⁻⁶ cfu/g, with the exception of the un-dehulled and roasted powder from the first month of the storage period (see in Table 3). When un-dehulled and autoclaved powder was stored for two, four, and six months, the TPC values rose from 0.1 x 10⁻⁶ cfu/g to 0.3 x 10⁻⁶ cfu/g, and even the TPC count decreased to 0.1 x 10⁻⁶ cfu/g. The maximum peak of TPC value of dehulled, un-dehulled, autoclaved, boiled, and roasted T. indica seed powder was discovered at the eighth month of storage periods, with values of 8 x 10⁻⁶, 7 x 10⁻⁷, 6 x 10⁻⁶, 8 x 10⁻⁷, and 6 x 10⁻⁷, respectively.
Fungi growth is a similar indicator of T. indica seed powder quality to the TPC value. Only a very little percentage of fungal growth, 0.1×10⁻⁶ to 0.3×10⁻⁶ cfu/g, was seen in the first month of storage. The fungal growth does not change in terms of its cumulative detection as the number of months of storage rises. The fungal growth charts shifted in the eighth month of storage, and their ranges were 1×10⁻⁷cfu/g to 2×10⁻⁶cfu/g.
During the fourth month of storage, mold was found. The highest mold value, which ranged from 0.3×10⁻⁶ cfu/g and was present in all processed T. indica seed powder, was discovered in the sixth month. Due to the largest water retention of the powder during the boiling process, the highest mold value (4×10⁻⁷ cfu/g) was discovered in boiled powder in the eighth month. Un-dehulled powder contained the next-highest mold value (3×10⁻⁶ cfu/g). The roasted powder had the lowest mold growth value (1×10⁻⁶ cfu/g), indicating that heating to a specific temperature for a specific amount of time will improve the qualities of the flour. Across all intervals, the differences were significant (p<0.05).
Table 3: Shelf-life evaluation of processed T. indica seed powder.
| Parameters | Intervals (months) | Dehulled | Un-dehulled | Autoclaved | Boiled | Roasted |
| TPC (cfu/g) | 0 | 0.1×10⁻⁶ | 0.2×10⁻⁶ | 0.1×10⁻⁶ | 0.1×10⁻⁶ | 0.2×10⁻⁶ |
| 2 | 0.2×10⁻⁷ | 0.3×10⁻⁶ | 0.2×10⁻⁷ | 0.3×10⁻⁶ | 0.2×10⁻⁶ | |
| 4 | 0.2×10⁻⁶ | 0.1×10⁻⁶ | 0.2×10⁻⁶ | 0.1×10⁻⁶ | 0.1×10⁻⁶ | |
| 6 | 0.1×10⁻⁶ | 0.3×10⁻⁶ | 0.1×10⁻⁶ | 0.3×10⁻⁶ | 0.3×10⁻⁶ | |
| 8 | 8×10⁻⁶ | 7×10⁻⁷ | 6×10⁻⁶ | 8×10⁻⁷ | 6×10⁻⁷ | |
| Fungi (cfu/g) | 0 | 0.2×10⁻⁶ | 0.1×10⁻⁶ | 0.2×10⁻⁷ | 0.3×10⁻⁶ | 0.2×10⁻⁶ |
| 2 | 0.2×10⁻⁶ | 0.2×10⁻⁶ | 0.2×10⁻⁶ | 0.1×10⁻⁶ | 0.2×10⁻⁶ | |
| 4 | 0.1×10⁻⁶ | 0.1×10⁻⁶ | 0.1×10⁻⁶ | 0.3×10⁻⁶ | 0.1×10⁻⁶ | |
| 6 | 0.2×10⁻⁶ | 0.3×10⁻⁶ | 0.1×10⁻⁶ | 0.3×10⁻⁶ | 0.3×10⁻⁶ | |
| 8 | 2×10⁻⁶ | 1×10⁻⁷ | 1×10⁻⁷ | 2×10⁻⁶ | 0.9×10⁻⁷ | |
| Mold (cfu/g) | 0 | 0.2×10⁻⁶ | 0.2×10⁻⁶ | 0.2×10⁻⁶ | 0.3×10⁻⁶ | 0.2×10⁻⁶ |
| 2 | 0.2×10⁻⁶ | 0.1×10⁻⁶ | 0.2×10⁻⁶ | 0.2×10⁻⁶ | 0.2×10⁻⁶ | |
| 4 | 0.1×10⁻⁶ | 0.3×10⁻⁶ | 0.1×10⁻⁶ | 0.1×10⁻⁶ | 0.1×10⁻⁶ | |
| 6 | 0.3×10⁻⁶ | 0.3×10⁻⁶ | 0.3×10⁻⁶ | 0.3×10⁻⁶ | 0.3×10⁻⁶ | |
| 8 | 2×10⁻⁶ | 3×10⁻⁶ | 2×10⁻⁷ | 4×10⁻⁷ | 1×10⁻⁶ |
TPC:Total Plate Count; cfu: Colony Forming Units
The total amount of plates of the produced powders were under the 107 cfu/g threshold that is thought to be appropriate for flours42. The mold may have been discovered on day 14 as a result of post-production environmental damage from the environment (including the storage material), temperature, increased pH, and water activity. The possibility of microbial infection in naturally manufactured supplemental foods was reduced thanks to fermentation’s anti-microbial environment43. The roasting of the food samples may have contributed to the decreased microbial burden. To improve keeping characteristics, roasting lowers microbes and digestive enzyme activity and kills insects44.
Conditions such as readily accessible water (water activity), a suitable pH, the optimum temperature and nutrients, as well as time, are necessary for microbial proliferations in food. One can stop microbial growth and increase a food’s shelf life by managing these factors. The T. indica seed powder exhibited TPC values that were within the range at the conclusion of the storage period. The multiplication of fungi and mold was quite low, and it only begins to grow after the sixth month of storage, allowing the flour to be used in the creation of other food products. Sanitation plays a role in regulating microbial growth. The flour needs to be produced under sanitary conditions, carried in a sealed container that is airtight and stored in a dry, hygienic location that is not dark in order to forestall the development of mold.
Conclusion
Tamarind is a commonly accessible and inexpensive plant. A largely underused product is tamarind seed, an unwanted by product of the pulp from the tamarind industries. The study’s findings demonstrated that roasted T. indica seed powder had excellent mineral compositions, a significant amount of antioxidant power was low glycemic, and was capable of being stored for a period of time exceeding six months. It can be used when making a variety of culinary goods that call for cereal flour. Experts in medicine say that some synthetic antioxidants can cause cancer; therefore, using them frequently entails health risks. As a result, natural antioxidants are currently more popular than synthetic ones. One such widely accessible seed that functions as a natural source of antioxidants is tamarind. It makes a significant contribution to the conventional healthcare system, and it has enormous potential for use in expanding the development of contemporary meals.
Acknowledgment
Authors have received help from the Department of Nutrition and Dietetics and Department of Food Science and Nutrition and Technology at Periyar University in Salem, Tamil Nadu, India, wherever the experiments were carried out.
Conflict of interest
There were no documented conflicts of interest by the authors of the paper.
Funding Sources
The co-author of the paper is delighted that Periyar University in Salem, Tamil Nadu, granted her a University Research Fellowship (URF) in order to provide funding for her research endeavours.
References
- Singh D, Wangchu L, and Moond S. K. (2007). Processed products of tamarind. Nat Prod Radiance., 2007; 6(4): 315-321.
- Adeleke A.E., 1Onifade A.P., Adegbite A.A., Adegbite S.A, Isola O.E. and Sangoremi A.A (2021). Chemical Composition and Nutritional Evaluation of Tamarindus indica (Tamarind) Seed Flour. J Emer Technol and Inno Research., 2021; 8 (11): c623-c632.
- Sultana F. Standardization of protein-enriched cookies made from Tamarind seed flour. J App and Nat Sci. 2021; 13 (SI): 194 – 197.
CrossRef - Sou D.S., Ba C.A., Wellingtonda Silva O., Jose Teixeira F., and Helena Teixeira G. Quantitative profile of fatty acids and tocopherols in tamarind seeds (Tamarindus indica L.) from different states of Brazil. Res J Phytochem., 2017; 11: 118-128.
CrossRef - Bagul M.B., Sonawane S.K. and Arya S.S. Bioactive characteristics and optimization of tamarind seed protein hydrolysate for antioxidant-rich food formulations. , 2018; 8(4): 218.
CrossRef - Balasundram N., Sundram K., and Samman S. Phenolic compounds in plants and agri-industrial by-products: antioxidant activity, occurrence, and potential uses. Food Chem. 2006; 99:191–203.
CrossRef - Bucic´-Kojic´ A., M. Planinic´ S. Tomas L. Jakobek and M. Šeruga. Influence of solvent and temperature on extraction of phenolic compounds from grape seed, antioxidant activity and colour of extract. Int J Food Sci Tech. 2009; 44: 2394–2401.
CrossRef - Ovaskainen M. L., Törrönen J., Koponen M., Sinkko H., Hellström J., and Reinivuo H. Dietary intake and major food sources of polyphenols in Finnish adults. Nutr., 2008; 138:562–566.
CrossRef - Galili S., and R. Hovav. 2014. Chapter 16 – Determination of polyphenols, flavonoids, and antioxidant capacity in dry seeds. Pp. 305–323 in R. R. Watson, ed. Polyphenols in plants. Academic Press, San Diego.
CrossRef - Abnet C.C., D. A., Corley N. D., Freedman and F. Kamangar. Diet and upper gastrointestinal malignancies. Gastroenterology., 2015; 148: 1234–1243. e1234.
CrossRef - Everitt A. V., S. N. Hilmer J. C. Brand-Miller H. A. Jamieson A. S. Truswell A. P. Sharma Dietary approaches that delay age-related diseases. Clin Interv Aging., 2006; 1:11.
CrossRef - Keservani R. K., R. K. Kesharwani N. Vyas S. Jain R. Raghuvanshi and A. K. Sharma. Nutraceutical and functional food as future food: a review. Der Pharmacia Lettre. 2010; 2:106–116.
- Andabati B., and J. H. Muyonga. Phenolic content and antioxidant activity of selected Ugandan traditional medicinal foods. Afri J Food Sci. 2014; 8:427–434.
CrossRef - El-Siddig K., H. Gunasena B. Prasad D. Pushpakumara K. Ramana P. Vijayanand, 2006. Tamarind: Tamarindus Indica L (Vol. 1): Crops for the Future.
- Tsuda T., M. Watanabe K., Ohshima A., Yamamoto S., Kawakishi and Osawa. T. Antioxidative components isolated from the seed of tamarind (Tamarindus indica L.). J Agr Food Chem. 1994; 42:2671–2674.
CrossRef - Ibeanu V.N., Ene-Obong H.N., Peter-Ogba G.U., and Onyechi U. A. (2015). Microbiological evaluation and shelf life of seed flour mixes used for infant feeding in rural northern Nigeria, Afri J Biotechnol., 2015; 14(20): 1718-1723.
CrossRef - Fontana A.J. (2008). Water activity and pH measurement for Food Safety, Retail Food Systems Research Conference IFT Foodservice Division, Decagon Devices, Inc.
- Sivasankar B. Food processing and preservation. New Delhi, PHI Learning Private Limited. 2010; 12-19.
- Chougui N., Tamendjari A., Hamidj W. Oil composition and characterisation of phenolic compounds of Opuntia ficus-indicaFood Chemistry., 2013;139(1–4): 796–803.
CrossRef - Abdel-Hameed E.S. S., Nagaty M. A., Salman M. S. and Bazaid S. A. Phytochemicals, nutritional and antioxidant properties of two prickly pear cactus cultivars (Opuntia ficus indica) growing in Taif, KSA. Food Chemistry., 2014; 160: 31–38.
CrossRef - Goni I., Garcia A.A., and Saura, C.F. A Starch Hydrolysis Procedure to Estimate Glycemic Index. Nutrition Research., 1997;17: 427–437.
CrossRef - Batool S.A., Rauf N., Tahir S.S. and Kalsoom R. Microbial and Physico-chemical contamination in the wheat flour of the twin cities of Pakistan. Int J. Food Safety., 2012; 14: 75-82.
- Hazan R., Que Y.A., Maura D., and Rahme L.G. A method for high throughput determination of viable bacteria cell counts in 96-well plates, BMC Microbiol., 2012; 12 (1), 1.
CrossRef - Field A. Discovering statistics using IBM SPSS statistics. Sage, 2013.
- Olaofe O., Adeyemi F.O., and Adediran G.O. Amino acid and mineral compositions and functional properties of some oilseeds. J Agri Food Chem., 1994; 42(4): 878-881.
CrossRef - Adeleke A. A., Odusote J. K., Lasode O. A., Ikubanni P. P., Malathi M., and Paswan, D. Densification of coal fines and mildly torrefied biomass into composite fuel using different organic binders. Heliyon, 2019; 5(7).
CrossRef - Olatidoye O.P., Adeleke A.E., Adegbite S.A. and Sobowale S.S. Chemical Composition and Nutritional Evaluation of Sand Box (Hura Crepitan) Seed Flour for Domestic Consumption and Industrial Utilization in Nigeria’, 2019.
- Niermans K., Woyzichovski J., Kröncke N., Benning R., and Maul R. Feeding study for the mycotoxin zearalenone in yellow mealworm (Tenebrio molitor) larvae—investigation of biological impact and metabolic conversion. Mycotoxin Research, 2019; 35: 231-242.
CrossRef - Weli A. M., AL-Hinai J. R., Al-Mjrafi J. M., Alnaaimi J. R., Hossain M. A., Saeed S., and Aktar M. S. Effect of different polarities leaves crude extracts of Omani juniperus excels on antioxidant, antimicrobial and cytotoxic activities and their biochemical screening. A Pac J Reprod., 2014; 3(3): 218-223.
CrossRef - Hossain M. K., Strezov V., Chan K. Y., Ziolkowski A., and Nelson P. F. Influence of pyrolysis temperature on production and nutrient properties of wastewater sludge biochar. J environ manag., 2011; 92(1): 223-228.
CrossRef - Parry D. A., Fraser R. B., and Squire J. M. Fifty years of coiled-coils and α-helical bundles: A close relationship between sequence and structure. J struc biology, 2008; 163(3), 258-269.
CrossRef - Sánchez-Rangel J. C., Benavides J., Heredia J. B., Cisneros-Zevallos L., and Jacobo-Velázquez D.A. The Folin–Ciocalteu assay revisited: improvement of its specificity for total phenolic content determination. Analytical methods., 2013; 5(21): 5990-5999.
CrossRef - Manzocco L., Calligaris S., Mastrocola D., Nicoli M. C., and Lerici C. R. (2000). Review of non-enzymatic browning and antioxidant capacity in processed foods. Trends in food sci & technol., 2000; 11(9-10): 340-346.
CrossRef - Sacchetti G., Di Mattia C., Pittia P., and Mastrocola D. Effect of roasting degree, equivalent thermal effect and coffee type on the radical scavenging activity of coffee brews and their phenolic fraction. J Food Eng., 2009; 90(1): 74-80.
CrossRef - Norra I., Aminah A., and Suri R. Effects of drying methods, solvent extraction and particle size of Malaysian brown seaweed, Sargassum sp. on the total phenolic and free radical scavenging activity. Int Food Res J., 2016; 23(4).
- Nayak B., Berrios J.D., and Tang, J. Impact of food processing on the glycemic index (GI) of potato products. Food Res Inter., 2014; 56: 35–46.
CrossRef - Adel K. Indice et charge glycémiques de l’alimentation et relations avec l’obésité et le syndrome métabolique au sein de l’étude des familles de Québec (QFS), Mémoire de maitrise. Université Laval, Québec, 2014; 380.
- Liu S., and Willett W.C. Dietary Glycemic Load and Atherothromobotic Risk. Curt Atheros Rep., 2002; 4: 45-61.
CrossRef - Brand-Miller J., Dickinson S., Barclay A. and Celermajer, D. The glycemic index and cardiovascular disease risk. Nutrition, 2007; 9: 479-485.
CrossRef - Devi P.B, Vijayabharathi R., Sathyabama S., Gurusiddappa N., Malleshi and Priyadarisini V.B. Health Benefits of Finger Millet (Eleusine coracana L.) Polyphenols and Dietary Fiber: A Review. J Food Sci and Technol., 2014; 51: 1021-1040.
CrossRef - Saleh A.S.M., Zhang Q., Chen J. and Shen Q. Millet Grains: Nutritional Quality, Processing, and Potential Health Benefits. J Food Sci and Food Saf., 2013; 12: 281-295.
CrossRef - International Commission on Microbiological Specifications for Foods. (1996). Microorganisms in foods 5: Characteristics of microbial pathogens(Vol. 5). Springer Science & Business Media.
- Ayoya M. A., Spiekermann-Brouwer G. M., Stoltzfus R. J., Nemeth E., Habicht J. P., Ganz T., and Garza C. (2010). α1-Acid glycoprotein, hepcidin, C-reactive protein, and serum ferritin are correlated in anemic schoolchildren with Schistosoma haematobium. The American j clin nutri., 2010; 91(6): 1784-1790.
CrossRef - A. O., WHO Expert Committee on Food Additives, & World Health Organization. (2012). Safety evaluation of certain food additives and contaminants: prepared by the Seventy fourth meeting of the Joint FAO/WHO Expert Committee on Food Additives (JECFA). World Health Organization.
Accepted on: 04-12-2023
Second Review by: Dr. Bhavana Gundavarapu
Final Approval by: Dr Ali Mohamed Elshafei


![]()
![]()
