
Intelligent Application of Laser for Medical Prognosis: An Instance for Laser Mark Diabetic Retinopathy
 , Dipansu Mondal2 and Diprajyoti Majumdar1
 1JIS College of Engineering, Department of Information Technology, Kalyani, WB, India
2University of Kalyani, CIRM, WB, India
Corresponding Author E-mail:sumit.das@jiscollege.ac.in
DOI : http://dx.doi.org/10.13005/bbra/3109
Download this article as:
![]()
Refractive laser surgery is all about the accuracy, whether screening or surgery, given the age and profile of the patient enduring these trials, there is no margin for error. Most of them are for aesthetic reasons, contact lens intolerance, or professional reasons, including athletes. In this article, the role of artificial intelligence and deep learning in laser eye surgeries has been introduced. The presence of lingering laser spots on the retina after refractive laser surgery in diabetic retinopathy poses a potential risk to visual integrity and ocular well-being. The hypothesis for the research paper is that the hybridized convolutional neural network models, including LeNet-1, AlexNet, VGG16, PolyNet, Inception V2, and Inception-ResNetV2, will yield varying levels of performance in classifying and segmenting laser spots in the retina after diabetic retinopathy surgery. The hypothesis predicts that Inception-ResNetV2 will demonstrate superior results compared to the other CNN versions. The research aims to provide a novel approach for laser therapies and treatments, facilitating the rapid classification, highlighting, and segmentation of laser marks on the retina for prompt medical precautions. The comparative analysis revealed that Inception-ResNetV2 exhibited exceptional performance in both training and validation, achieving the highest accuracy (96.54%) for classifying diabetic retinopathy images. Notably, VGG16 also demonstrated strong performance with a validation accuracy of 94%. Conversely, LeNet-1, AlexNet, PolyNet, and Inception V2 displayed comparatively lower accuracy rates, suggesting their architectures may be less optimized for this particular image classification task. This achievement holds immense promise for timely detection, precise localization, and optimal management of laser spots, fostering enhanced visual outcomes and elevating the standards of patient care in this context.
KEYWORDS:Biomedical image processing; Convolutional Neural Networks(CNN); Classification algorithms; Diabetic Retinopathy; Feature extraction; Laser Mark
Introduction
Artificial Intelligence(AI) which is based on Soft Computing(SC), Machine Learning(ML), and Deep Learning(DL), is becoming more and more well-liked and accepted in the fields of medicine and healthcare1 due to its ability to outperform people, notably in the recognition and interpretation of images. These algorithms’ findings can be used to accurately screen for Corneal Ectasias before refractive surgery and identify people for whom the treatment is inappropriate. The performance of the current algorithms is comparable to that of an experienced surgeon in terms of safety, efficacy, and predictability. Two more possible uses for AI are predicting the outcomes of laser refractive surgery and increasing the accuracy of SMILE (small incision lenticular extraction), outcomes. SMILE is also known as LASIK (laser-assisted-epithelial-keratomileusis)2,3 and is a minimally invasive, flap-free refractive surgery that uses a femtosecond laser and is becoming increasingly popular as a secure substitute for flap-based procedures4. Diabetic retinopathy is the most prevalent and dangerous vision-related side effect of diabetes mellitus. Its progression can be slowed down in its advanced stages by employing laser photocoagulation therapies, which inhibit the neovascularization processes typical of diabetic retinopathies. These therapies alleviate retinal hypoxia by destroying retinal tissue. Currently, automated algorithms are used by screening software to identify people with diabetic retinopathy 5. Unfortunately, these methods might not work correctly if the patients being tested have previously undergone laser photocoagulation treatments 6. This work proposes a digital retinal fundus image classifier that determines whether the input image has signs of prior photocoagulation laser treatments, which are signs of laser scars, by analyzing characteristics calculated from candidate regions selected from the input image.
Blindness can result from eye conditions like diabetic retinopathy. Laser therapy can halt the further evolution of diabetic retinopathy in its advanced stages. The surface of the retina is damaged by laser treatment, which results in improper responses from automated retinal diagnostic systems. It is desirable to identify laser marks and eliminate them in order to prevent any needless processing because these laser marks obstruct further analysis of the retinal pictures. The method for automatically detecting laser marks from retinal images is presented in this study, along with some performance evaluation-based results7. With laser photocoagulation, which creates scars on the retina, it is possible to slow the disease’s progression in its advanced stages. Automatic diagnostic algorithms are used by modern screening programs to find diabetic retinopathy (DR) in patients. When the patient’s retina has scars from past laser photocoagulation treatments, these systems’ performance may be compromised. It is preferable to identify and exclude these patients from the screening program because they are already receiving treatment. The results on the performance of a proposed technique that uses tree-based classifiers to automatically detect the occurrence of the laser markings in the retinal images are acquired and reported8. In the retinal tissue, photocoagulation treatments for diabetic retinopathy cause scars. These signs must be identified in order to avoid screening patients who have already received treatment and to modify subsequent image-processing operations carried out in the framework of automatic diagnosis. One of the most advanced optical imaging methods for looking through biological tissue is near-infrared diffuse optical tomography (DOT), which enables 3-D quantitative imaging of optical characteristics, including functional and anatomical data. With DOT, it should be possible to get around the drawbacks of standard near-infrared spectroscopy (NIRS) while also presenting the possibility of diagnostic optical imaging. The field of optical tomography9, which is relatively new and employs ultra-short laser pulses to identify anomalies within the body rather than potentially hazardous ionizing radiation as other techniques do, may have made the most impressive advancements. Unlike x-rays, which travel through tissue in straight lines, photons adopt zigzag courses instead, hence, optical tomography entails the challenging process of reconstructing an image from highly scattered photons.
Precision measurement of the number of photons entering in each direction and their arrival time is used to accomplish this. A speckle pattern, also referred to as a random interference effect, is created when the laser light impacts a diffuse object. The strength of the speckles varies when the thing is moving. These variations may reveal details about the movement. Laser speckle10 flowmetry is a second form of laser imaging technology that is beginning to be employed in clinical settings. It is used to track changes in blood flow within tissues. The amount of time the fluorophor spends in the excited state before going back to the ground state is known as the fluorescence lifespan. It is a feature of all dyes and their surroundings. The autofluorescence may be distinctive to a particular tissue and used for tumor detection. Since these uses are more common in tissues or organisms, Two-Photexcitationion (TPE) and Non-Descanned detection (NDD) are frequently combined for deep tissue imaging. The advancement of all-solid-state systems, which make high-performance lasers accessible to smaller research institutions, has been a significant trend in recent years. Fluorescence lifetime imaging (FLIM)11 is one instance of this. In this method, fluorescence signals in biological tissues are excited using brief laser pulses in the femtosecond to picosecond range. Due to their low level of intrusion and efficient ability to transfer biological material to and from cells and tissues, nanoneedles have developed into the ideal platforms for topical biosensing and medication delivery. Because it combines mechanical strength with bioresorbability and has the potential for either continuous drug release or effective biomolecule harvesting due to the mesoporous structure, porous silicon is a promising material for the production of micro- and nanoneedles12.
In the West, proliferative diabetic retinopathy is a serious, disabling condition that accounts for most occurrences of blindness in people13. Proliferative diabetic retinopathy is treated using photocoagulation, although the molecular processes through which it works are still unknown. Angiostatin is known to be a powerful neovascularization inhibitor, as suggested14. The pathologic alterations in the neurosensory retina are described in depth by The Scientist, utilizing particular immunocytochemical markers. The clinical development of the illness process is connected with these alterations. The release of angiostatin could start the anti-angiogenic effects of retinal photocoagulation, together with a potential down-regulation of angiogenic cytokines. Within the first two decades of life, the fundus flavimaculatus (Stargardt illness) group of inherited macular dystrophies frequently causes a decline in central vision15,16.
According to the criteria set forth in several randomized trials, fundus perimetry with the potential for fixation point detection and the stability of fixation would not alter the indication for laser treatment. To assess the clinical utility of knowing the area of fixation before and after laser treatment, more research and a longer follow-up are necessary17,18. This new technique might make it easier to assess the effectiveness of the treatment and predict the aesthetic result with greater accuracy19. An illness that frequently threatens vision is diabetic retinopathy (DR). Panretinal photocoagulation, a procedure used to treat individuals with severe DR, leaves behind scars called laser marks. In this study, researchers created a deep learning system based on the portable U-Net to separate laser marks from the colored fundus images, which could help signal a stage or provide helpful supplemental information for the treatment of DR patients. The small-footprint U-Net approach demonstrated consistent performance in accurately segmenting laser markings in fundus pictures with high numeric metrics, which could aid the AI in supporting the diagnosis of DR at the severe stage20.
Retinal fundus disorders can result in irreversible vision loss if they are not promptly diagnosed and treated. For the diagnosis of glaucoma, age-related macular degeneration, and diabetic retinopathy, separate disease-based deep-learning algorithms have been built. In this study, we created a deep learning platform (DLP) that can recognize a variety of common referable fundus disorders. The detection of numerous retinal disorders and ailments was also highly effective in external multihospital tests, public data tests, and tell reading applications. These findings suggest that our DLP can be used, particularly in distant parts of the world, for retinal fundus disease triage21. The ability to directly observe vascular morphology, which is connected to numerous clinical disorders, is made possible by the retinal vasculature. However, accurate vessel segmentation, which is time- and labor-intensive, is required for objective and quantitative interpretation of the retinal vasculature. The segmentation of retinal vessels has shown considerable potential when using artificial intelligence (AI). Numerous retinal images with annotations are necessary for the creation and assessment of AI-based models22. The findings of this literature review suggest straightforward and efficient techniques for finding these laser marks.
Methodology
One method of eyesight correction is LASIK. The top layer of the cornea is lifted, the inner layers of the cornea are reshaped with a laser, and the flap is then replaced, allowing the eyes to heal rapidly and precisely. AI(Artificial Intelligence) is utilized to assure the accuracy and predictability of outcomes with each type of surgery, in addition to screening for refractive surgery. Numerous patient-specific criteria, including age, prescription, corneal, and other eye features, as well as environmental elements, including the operation suite’s temperature and humidity, are integrated into a rigorous software engine. Such integration enables AI to produce formulas that direct the treatment plan23.
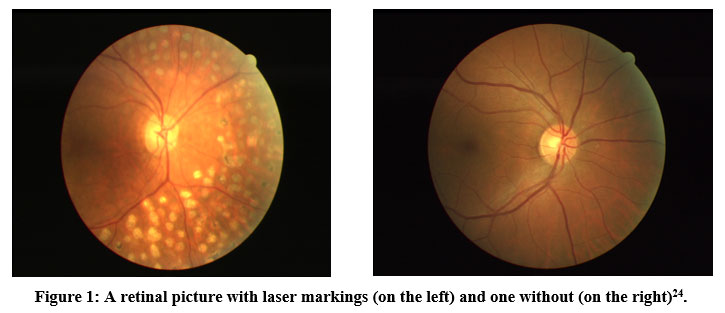 |
Figure 1: A retinal picture with laser markings (on the left) and one without (on the right)24.
|
The most common and well-known kind of treatment for proliferative retinopathy and diabetic macular edema, both severe phases of diabetic retinopathy, is photocoagulation. Due to the laser’s incidence, this type of treatment produces scarring on the retina. We’ll refer to these marks as laser scars. DR screening systems currently use automatic diagnostic algorithms to find lesions connected to DR. Laser markings should be detected because they could impair the functionality of these systems. A database called the Laser Mark Dataset (LMD) allows for comparative research on the segmentation of the laser marks in the retinal pictures. The scientific community is encouraged to use this database to evaluate their laser mark detection techniques.
Description of data
The fundus photos with laser marks in this dataset were created from RGB images in a JPG or JPEG format that was downloaded from Kaggle The clinical section of the Zhongshan Ophthalmic Center, the Lifeline Express charity project in China’s DR screening program, or open internet data were used to collect the fundus photographs. A set of 154 laser-marked fundus shots was divided into two subsets: one contained the remaining 70 images, while the other contained the 84 images that had been manually segmented by the Image Reading Center’s professional graders just once. The 70 pictures in the second dataset have to have all of the assured laser marks labeled by the three experienced graders. At least two graders tagged the image standards that served as the gold standard. The formal data set was built using this sub-data-set since it contained more accurate manual segmentations. The formal training dataset, consisting of 50 photos, and the testing dataset, consisting of 20 images, were created from the 70 fundus shots with gold standards24.
Image Preprocessing and Augmentation
Due to the range of camera devices used, the fundus photographs in the image data differed in size, resolution, and color, making it necessary to preprocess the images in order to artificially summarize the commonality. Differences in intrinsic feature distributions were lessened with the use of preprocessing. All photos were first scaled down to 512×512 pixels. On each channel, the three processes below were consecutively applied in order to remove the overall tone brightness variance between images. After calculating the Z-score standardization, which produced an image with a mean of 0 and a variance of 1, the inner image minimum-maximum normalization was performed with the aim of converting the grayscale values to a scale from 0 to 255.
Image Enhancement
Digital images are modified during the process of image enhancement to provide outcomes that are better suited for display or additional image analysis. The original range of grey levels is widened by the linear transformation, resulting in contrast augmentation or stretching as shown in figure 2.
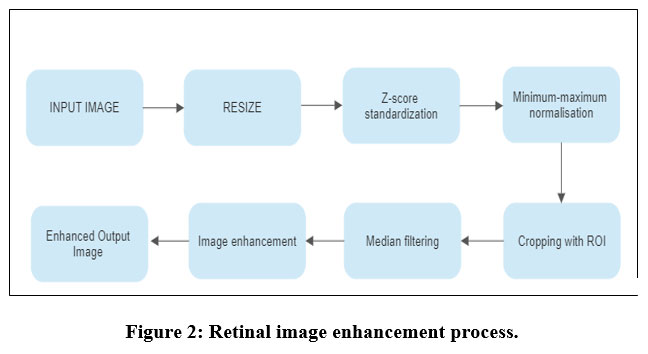 |
Figure 2: Retinal image enhancement process.
|
Spatial filtering enhances the naturally occurring linear characteristics, such as faults, shear zones, and lineaments. Through a process called density slicing, distinct features are represented by a sequence of density intervals, each of which is denoted by a different color or symbol.
Model Evaluation by CNN Architecture
The architecture of the trainable multi-stages made of various stages can be used to define this type of neural network. Each stage’s inputs and outputs are sets of arrays known as feature maps. Each feature map for the outputs represents a distinct feature that was taken from every place on the input. Three layers make up each stage; a filter bank, a nonlinearity layer, and a layer of pooling feature. Three layers or fewer are required for a classic (CNN). The modules for classification come after these first three tiers. The image recognition case’s several layers are described as follows.
Image Input Layer
The image input layer establishes the size of any supplied images in the CNN. Additionally, it includes the raw pixel values for the image. The image size is determined by the input image’s width, height, and number of color channels. For example, there is only one channel for grayscale photos and three for color images. The mean or median of the images in the training dataset is subtracted from each input image by the input layer in order to normalize the data.
Convolutional Layer
The neurons in this layer are related to various areas of the input or output pictures from the layer below. While scanning over the photos, this layer can pick up on any feature that is localized using these regions. A variety of weight sets that may be applied to a specific part of the image were employed in this layer. The input image could be moved vertically and horizontally along the entire filter. For each area, the inputs are convolved again in this phase using the same method. This step’s length and its movements are called a stride. These local regions to which the associated neurons have connections may overlap depending on the filter-Size and the value of the stride. The weight number used in the filter is w*h*c. Where c is the channel number in the input image and w and h are the sizes of each filter, respectively. In this case, the example channel for color photos is 3. The channel number for the convolutional layer output can be determined by the filter number. The comparable weight set and convolution are used, as was previously discussed, to create the feature map as the filters traverse through the input images. As a result, the number of channels in the feature maps for this layer is the same. Every feature map has a unique collection of biases and weights. Consequently, the convolutional layer’s total parameter count is ((w*h* c + 1)* Filters Number). Padding should also be mentioned in this layer. In essence, it is tallied by bordering the input image with zero columns or rows. Controlling the output size of the layer can be beneficial. The output of the layer’s width and height can then be calculated using the formula in Equation 1.
(Input Size – Filter Size + 2*Padding)/Stride + 1. (1)
Batch Normalization Layer
These layers can be used in conjunction with convolutional and ReLU layers to quicken network training and reduce the sensitivity of network initialization. The layer normalizes the activation of each channel by subtracting the mini-batch average and dividing the result by the mini-batch standard deviation. The layer then executes shifting using an offset after scaling the input using a scale factor. These variables are thought of as trainable parameters that can be changed. In a neural network, this layer normalizes gradient activations and their propagation. This is done to help with the network training’s optimization issue. This layer can be used to increase the learning rate to the fullest extent.
Rectified Linear Unit (ReLU) Layer
A nonlinear activation function, in this case, a (ReLU) layer, specifically a “rectified linear unit” layer, is typically followed by convolutional and batch normalization layers. Using this layer, every element is exposed to threshold operations, and every negative input value is equalized to zero, as in equation 2.
f(x) = max(0,x) . (2)
Max Pooling Layers
These layers are placed after any convolutional layer for downsampling. It is employed to reduce the number of connections to the following levels. These layers don’t function for self-learning purposes. Lowering the number of parameters to be learned can reduce over-fitting in the subsequent layers. The max pooling layers return the greatest values for the rectangular region of the layer. The rectangle size region can be determined using the input for the max pooling layer pool size. For instance, the layer will return the greatest value in the sections of height 3 and width 2 if Pool Size is equal to (3,2).
Dropout Layers
These layers randomly and with a predetermined probability change the input elements of the layer to zeros. This procedure equates to arbitrarily removing the unit and all of its network connections during the training period, despite the fact that this layer’s output and input are identical. In this scenario, train the network in a random manner to choose a neural subset to create a distinct layer architecture for each new element input. Architectures with layers share weights However, the layer of dropout may aid in preventing overfitting since the learning process is not dependent on particular neuron and connection types.
Fully Connected Layer
A single, fully connected layer or a number of layers may make up these layers. After the convolutional layer, these layers are displayed. The neurons in the preceding layer are all connected to the neurons in this layer. The completely linked layer combines all learned features from earlier layers. Larger patterns were found using these features, which were then used to classify the photos according to several categorization issues. The dataset’s class numbers are output by the final fully connected layer as size arguments. The output size for regression issues must match the number of response variables.
Output Layers
Classification tasks are performed using the Soft Max and Classification Layers. Following the previous fully connected layer are these two layers. The softmax function is used in this instance to activate the output unit represented in equation 3.
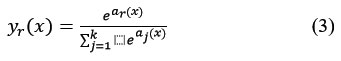
softmax, input vector, input vector, k= number of classes and output vector
This function displays the output unit activation function following the final completely linked layer for problems with multiclass classification:
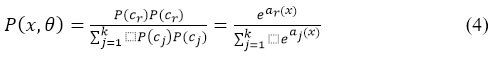
The normalized exponential is another name for the softmax function represented in equation 4. Additionally, the logistic sigmoid multiclass generalization of function is being considered. This work employs the CNN variations Inception-ResNetV2, LeNet-1, AlexNet, VGG16, PolyNet, and Inception V2 to figure out the best model among them.
Result and Discussion
For the classification purpose of laser marks containing fundus images, the different CNN architectures with the previously discussed layers and transfer functions have been used. For classification purposes, a hybrid customized system using Residualnet 50 and Inception v2 has been utilized. Inception-ResNet-v2 is a CNN architecture that builds on the Inception family of architectures and integrates residual connections. For the residual versions of the Inception networks, we use Inception blocks that are less expensive than those in the novel Inception. The inception block is followed by the filter-expansion layer, which is used to make the filter bank more dimensional before being added to match the depth of the input. This is essential to make up for the dimensionality loss brought on by the Inception block, as depicted in Figure 3.
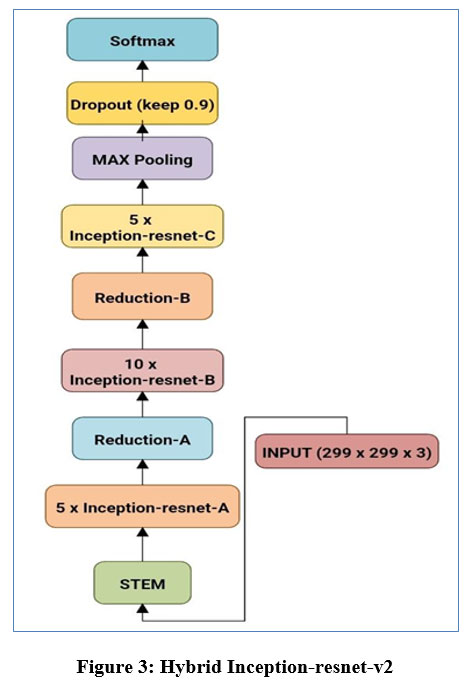 |
Figure 3: Hybrid Inception-resnet-v2
|
For the segmentation process with mapping the masks of the segmented area of laser spots in fundus images, the residual U net is used. The ResNet design serves as the foundation for this U-net variation. ResNet was developed with the goal of overcoming the challenges associated with training extremely deep neural networks, as depicted in Figure 4. It is well recognized that the more layers present in a neural network, the faster it can converge on a solution. The findings of the experiments revealed that adding more layers causes saturation, and adding more layers can result in performance reduction. This deterioration is brought on by the weight vector’s decreasing gradients, which in deeper neural networks result in the loss of feature identities. By using skip connections, which add the feature map from one layer to another layer deeper in the network, ResNet decreases this issue. A skip connection in the residual U-net adds the input from the first convolutional layer to the output from the second convolutional layer at every block in the network. Prior to any down- or up-sampling, the U-net’s respective routes employ this skip connection. The vanishing gradient problem is addressed by using residual skip connections to build U-net models with deeper neural networks.
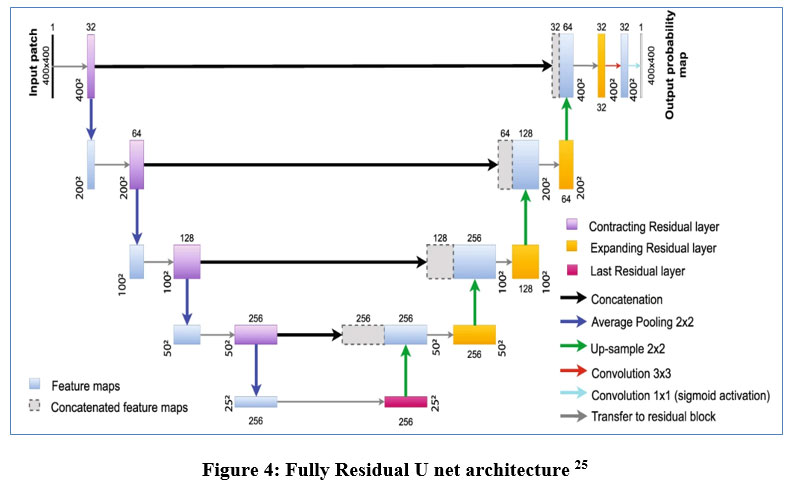 |
Figure 4: Fully Residual U net architecture 25
|
Prior to adopting the recommended dataset, and conducted a five-fold cross-validation to verify the likelihood of the training dataset and testing dataset selection. The 70 highly labeled photos were divided into five folds, each of which had 14 pictures. One of the five folds was chosen to act as the testing dataset and the other four as the training dataset in the ensuing justification experiment. The greatest AUC value was 0.9833, and the lowest was 0.9706. Given that the range produced by these two intense AUC values covered 0.9798, it is obvious that the initial separation of the training and testing dataset was largely arbitrary.
Training and Validation Accuracy Analysis and Discussion
In the subsequent analysis, a dataset of DR images24 with two classes, “No DR sign” and “With DR sign”, was used to train and validate several CNN algorithms, including LeNet-1, AlexNet, VGG16, PolyNet, InceptionV2, and Inception-ResNetV2. After training and validation, Inception-ResNetV2 showed the highest validation accuracy of 96%, followed by VGG16 with 94% accuracy. The other models showed comparatively lower accuracy rates, with LeNet-1 showing the lowest validation accuracy of 65%.
The Inception-ResNetV2 model achieved a high accuracy of 98.82% in training and 96.54% in validation, and its confusion matrix showed that it performed well on the test dataset, with a true positive rate of 96.1% and a true negative rate of 98.0%. The confusion matrix for Inception-ResNetV2 showed that out of the 1500 test images, 735 were correctly classified as having DR signs, and 720 were correctly classified as not having DR signs, as depicted in Figure 5.
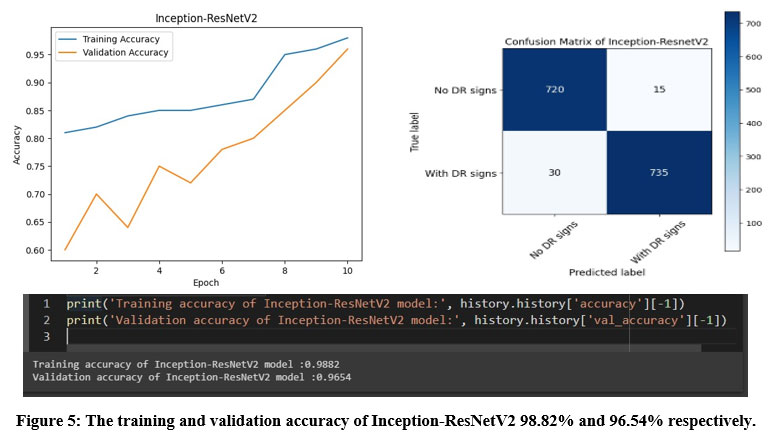 |
Figure 5: The training and validation accuracy of Inception-ResNetV2 98.82% and 96.54% respectively.
|
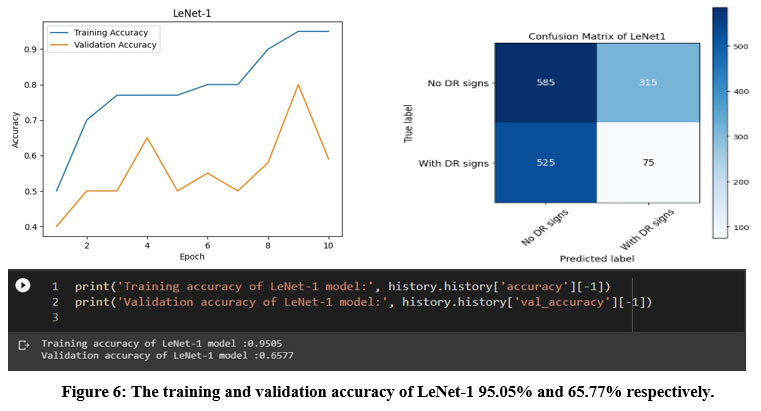 |
Figure 6: The training and validation accuracy of LeNet-1 95.05% and 65.77% respectively.
|
LeNet-1 achieved the lowest accuracy among the six models with 65.77% in testing, and its confusion matrix showed that the model had difficulty distinguishing between the two classes. Specifically, LeNet-1 correctly classified only 75 images as having DR signs, while misclassifying 315 images as having no DR signs and 525 images as having DR signs when they actually had no DR signs, as shown in Figure 6.
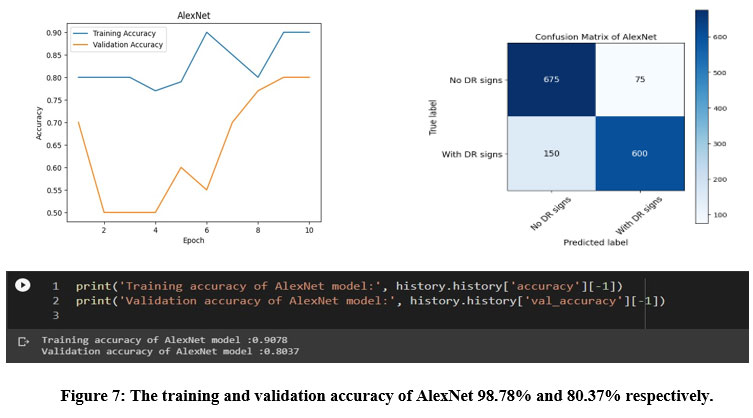 |
Figure 7: The training and validation accuracy of AlexNet 98.78% and 80.37% respectively.
|
AlexNet achieved a testing accuracy of 80.37%, and its confusion matrix indicated that the model correctly classified 600 images as having DR signs and 675 images as having no DR signs. However, the model also misclassified 75 images as having no DR signs when they actually had DR signs, and 150 images as having DR signs when they actually had no DR signs as depicted in figure 7.
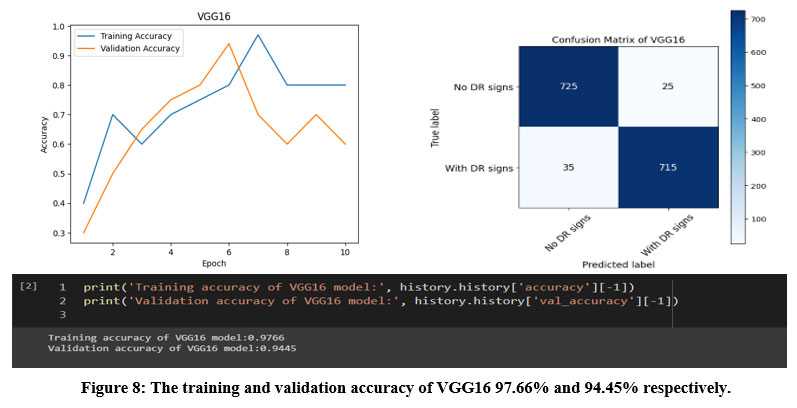 |
Figure 8: The training and validation accuracy of VGG16 97.66% and 94.45% respectively.
|
VGG16 achieved a high testing accuracy of 94.45%, and its confusion matrix showed that the model correctly classified 715 images as having DR signs and 725 images as having no DR signs. However, the model also misclassified 25 images as having no DR signs when they actually had DR signs, and 35 images as having DR signs when they actually had no DR signs as shown in figure 8.
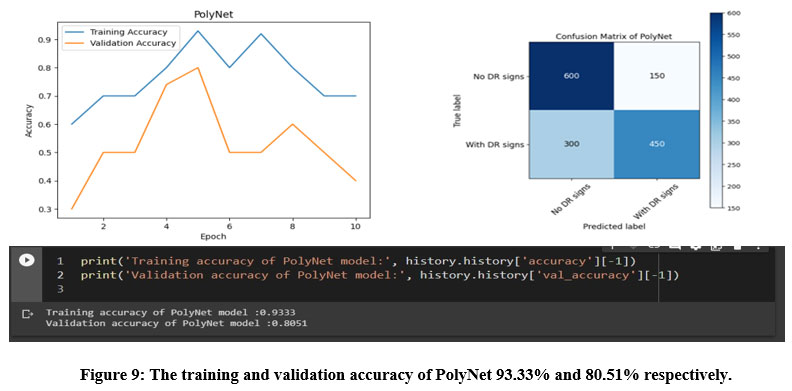 |
Figure 9: The training and validation accuracy of PolyNet 93.33% and 80.51% respectively.
|
PolyNet achieved a testing accuracy of 80.51%, and its confusion matrix showed that the model correctly classified 450 images as having DR signs and 600 images as having no DR signs. However, the model also misclassified 150 images as having no DR signs when they actually had DR signs, and 300 images as having DR signs when they actually had no DR signs, as illustrated in figure 9.
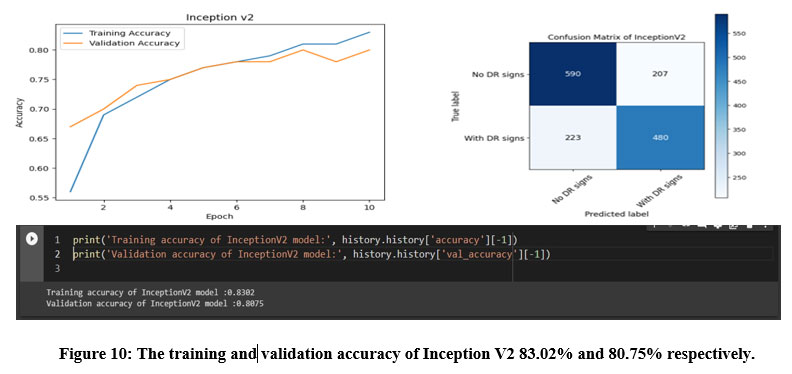 |
Figure 10: The training and validation accuracy of Inception V2 83.02% and 80.75% respectively.
|
Inception V2 achieved a testing accuracy of 80.75%, and its confusion matrix showed that the model correctly classified 480 images as having DR signs and 590 images as having no DR signs. However, the model also misclassified 207 images as having no DR signs when they actually had DR signs, and 223 images as having DR signs when they actually had no DR signs.
The reason behind these results could be attributed to several factors, including the complexity of the model, the number of layers, and the type of architecture used. The Inception-ResNetV2 model is a hybrid model that combines the strengths of the Inception and ResNet architectures, allowing it to capture both local and global features effectively. Additionally, it has a larger number of parameters and is deeper than the other models, allowing it to learn more complex representations from the dataset. Inception-ResNetV2 combines the strengths of Inception and ResNet, making it highly effective in image classification tasks. VGG16 is a deep convolutional neural network with 16 layers, which allows it to capture intricate patterns in the image data. On the other hand, models like LeNet-1 and Inception V2 have fewer layers, which can limit their ability to capture complex features and patterns in the dataset, leading to lower accuracy rates.
In terms of the comparative analysis, it was found that Inception-ResNetV2 outperformed the other models in terms of both training and validation accuracy. This suggests that the hybrid architecture of Inception-ResNetV2 is highly effective in classifying DR images. VGG16 also showed good performance, with a high validation accuracy of 94%. The other models, including LeNet-1, AlexNet, PolyNet, and Inception V2, showed lower accuracy rates, indicating that their architectures may not be well-suited for this particular image classification task.
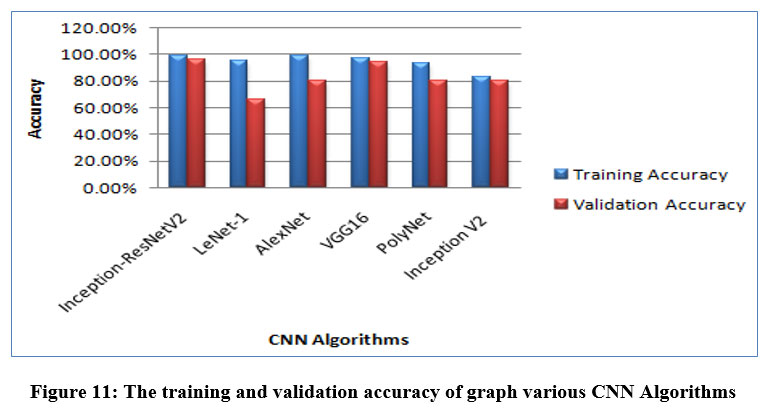 |
Figure 11: The training and validation accuracy of graph various CNN Algorithms.
|
In the finale, the confusion matrices revealed that Inception-ResNet V2 had the best overall performance on the test dataset, with a high true positive and true negative rate. The other models achieved varying degrees of accuracy, with LeNet-1 performing the worst and VGG16 achieving the second-best performance. The confusion matrices provide additional insights into the models’ strengths and weaknesses, indicating that some models struggled with distinguishing between the two classes.
Conclusion and Future Scope
The capacity of deep learning algorithms to be understood is AI’s largest issue. A deep learning algorithm will always diagnose a fundus shot as an image with DR without presenting more understandable justifications for its choice. In this study, both classification and segmentation have been done with a residual-based architecture. This means an inception-resnet hybrid classification system and a fully residual U-net architecture for the segmentation system. We carried out a fivefold cross-validation before using the suggested dataset to verify the randomness of selecting the training set and testing set.
In wrapping up, the analysis shows that Inception-ResVetV2 and VGG16 are highly effective models for classifying DR images, while models like LeNet-1, AlexNet, PolyNet, and InceptionV2 may not be as suitable. The results emphasize the importance of selecting the appropriate CNN architecture for a given image classification task.
These hybrid architectures and the entire prototype system are responsible for fast and reliable classification, along with optimal segmentation tasks on CT scans and fundus image analysis to identify the exact location of laser spots on sensitive eye tissue. After early recognition of those sensitive spots, proper medication consulting or mark removal surgery will take place for further treatment.
Acknowledgments
We acknowledge the diverse R&D resources provided by management, JIS College of Engineering, and JIS Group.
Conflict of Interest
The authors declare that they have no conflicts of interest. This article does not contain any studies with human participants or animals performed by any of the authors. Informed consent was obtained from all individual participants included in the study.
Funding source
There is no funding source linked to this research.
Reference
- Das S, Sanyal MK. Machine intelligent diagnostic system (MIDs): an instance of medical diagnosis of tuberculosis. Neural Comput & Applic. 2020;32(19):15585-15595. doi:10.1007/s00521-020-04894-8
CrossRef - Moshirfar M, Basharat NF, Bundogji N, et al. Laser-Assisted In Situ Keratomileusis (LASIK) Enhancement for Residual Refractive Error after Primary LASIK. JCM. 2022;11(16):4832. doi:10.3390/jcm11164832
CrossRef - Jayadev C, Shetty R. Artificial intelligence in laser refractive surgery – Potential and promise! Indian Journal of Ophthalmology. 2020;68(12):2650-2651. doi:10.4103/ijo.IJO_3304_20
CrossRef - Sharma VK, Sati A, Kumar S. Small incision lenticule extraction (SMILE) refractive surgery: Our initial experience. Medical Journal Armed Forces India. 2022;78:S105-S110. doi:10.1016/j.mjafi.2021.07.012
CrossRef - Proliferative and Nonproliferative Diabetic Retinopathy – American Academy of Ophthalmology. Accessed December 9, 2022. https://www.aao.org/munnerlyn-laser-surgery-center/laser-treatment-of-proliferative-nonproliferative-?msclkid=6c919d58cee711ec9c955581b57ba257
- Al-Hussainy S, Dodson PM, Gibson JM. Pain response and follow-up of patients undergoing panretinal laser photocoagulation with reduced exposure times. Eye. 2008;22(1):96-99. doi:10.1038/sj.eye.6703026
CrossRef - Tahir F, Akram M, Abbas M, Khan A. Laser Marks Detection From Fundus Images.; 2014.
CrossRef - Lerner EJ. ADVANCED APPLICATIONS: BIOMEDICAL LASERS: Lasers support biomedical diagnostics. Laser Focus World. Published May 1, 2000. Accessed December 6, 2022.
https://www.laserfocusworld.com/test-measurement/research/article/16555719/advanced-applications-biomedical-lasers-lasers-support-biomedical-diagnostics - M.d YH, Yamada Y. Overview of diffuse optical tomography and its clinical applications. JBO. 2016;21(9):091312. doi:10.1117/1.JBO.21.9.091312
CrossRef - Briers D, Duncan DD, Hirst ER, et al. Laser speckle contrast imaging: theoretical and practical limitations. JBO. 2013;18(6):066018. doi:10.1117/1.JBO.18.6.066018
CrossRef - Trautmann S, Buschmann V, Orthaus S, Koberling F, Ortmann U, Erdmann R. Fluorescence Lifetime Imaging (FLIM) in Confocal Microscopy Applications: An Overview. :14.
- Nanoneedles – an overview | ScienceDirect Topics. Accessed December 6, 2022. https://www.sciencedirect.com/topics/chemical-engineering/nanoneedles
- Muqit MMK, Marcellino GR, Henson DB, Young LB, Turner GS, Stanga PE. Pascal panretinal laser ablation and regression analysis in proliferative diabetic retinopathy: Manchester Pascal Study Report 4. Eye (Lond). 2011;25(11):1447-1456. doi:10.1038/eye.2011.188
CrossRef - Spranger J, Hammes HP, Preissner KT, Schatz H, Pfeiffer AFH. Release of the angiogenesis inhibitor angiostatin in patients with proliferative diabetic retinopathy: association with retinal photocoagulation. Diabetologia. 2000;43(11):1404-1407. doi:10.1007/s001250051546
CrossRef - Birnbach CD, Järveläínen M, Possin DE, Milam AH. Histopathology and Immunocytochemistry of the Neurosensory Retina in Fundus Flavimaculatus. Ophthalmology. 1994;101(7):1211-1219. doi:10.1016/S0161-6420(13)31725-4
CrossRef - Muqit MMK, Gray JCB, Marcellino GR, et al. Fundus autofluorescence and Fourier-domain optical coherence tomography imaging of 10 and 20 millisecond Pascal retinal photocoagulation treatment. Br J Ophthalmol. 2009;93(4):518-525. doi:10.1136/bjo.2008.148833
CrossRef - Macular Photocoagulation Study (MPS) – Full Text View – ClinicalTrials.gov. Published 2022. Accessed December 12, 2022. https://clinicaltrials.gov/ct2/show/NCT00000158
- Argon laser photocoagulation for neovascular maculopathy. Five-year results from randomized clinical trials. Macular Photocoagulation Study Group. Arch Ophthalmol. 1991;109(8):1109-1114.
CrossRef - Rohrschneider K, Gluck R, Becker M, et al. Scanning laser fundus perimetry before laser photocoagulation of well defined choroidal neovascularisation. Br J Ophthalmol. 1997;81(7):568-573.
CrossRef - Jiang Y, Pan J, Yuan M, et al. Segmentation of Laser Marks of Diabetic Retinopathy in the Fundus Photographs Using Lightweight U-Net. J Diabetes Res. 2021;2021:8766517. doi:10.1155/2021/8766517
CrossRef - Cen LP, Ji J, Lin JW, et al. Automatic detection of 39 fundus diseases and conditions in retinal photographs using deep neural networks. Nat Commun. 2021;12(1):4828. doi:10.1038/s41467-021-25138-w
CrossRef - Jin K, Huang X, Zhou J, et al. FIVES: A Fundus Image Dataset for Artificial Intelligence based Vessel Segmentation. Sci Data. 2022;9(1):475. doi:10.1038/s41597-022-01564-3
CrossRef - Faktorovich EG. Artificial Intelligence (AI) in LASIK and Other Eye Surgery Elevates Vision Results To The Next Level. Published online 2022.
- Laser Marks Dataset. Published 2022. Accessed December 13, 2022. https://home.deec.uc.pt/~lcruz/lmd/
- Figure 2 | Scientific Reports. Published online 2022. Accessed December 14, 2022. https://www.nature.com/articles/s41598-019-49431-3/figures/2
Accepted on: 14-06-2023
Second Review by: Dr. Paramita Guh
Final Approval by: Dr Haseeb Ahmad Khan


![]()
![]()
