
A Cross Sectional Study of Lipid Profile in Ultrasonography-Diagnosed Fatty Liver
 and Subaj Bhattarai
 Department of Radiology and Imaging, National Academy of Medical Sciences, Bir Hospital, Kathmandu, Nepal
Corresponding Author E-mail: drsarojsharma@hotmail.com
DOI : http://dx.doi.org/10.13005/bbra/3120
Download this article as:
![]()
Objective: The aim of this study is to conduct a descriptive cross sectional study to observe the relationship of lipid profile with fatty liver, as diagnosed by ultrasonography. Methodology: Study population consisted of 105 persons (50 females & 55 males) who were having non-alcoholic fatty liver disease, as diagnosed by ultrasonography. Serum lipid profile reports of the study population was tabulated and compared with grade I, II & III of ultrasonography-diagnosed fatty liver. Result: Grade I (mild) non-alcoholic fatty liver disease was seen in 84.7 %, grade II (moderate) in 13.3 % and grade III (severe) in 1.9% cases. Mean age of the study population was 48.3 years ranging from 25 years (minimum) to 79 years (maximum). Dyslipidemia was found in more than two thirds of our study population. Total cholesterol, triglyceride and low-density lipoprotein were increased in 67.6%, 65.7% and 67.6% respectively. High-density lipoprotein was decreased in 60.9% cases. Mean value of total cholesterol, triglyceride, low-density lipoprotein and high-density lipoprotein were 233.5 gm/dl, 215.5 gm/dl, 148.7 gm/dl and 32.5 gm/dl respectively. When lipid profiles were compared with fatty liver, significant positive correlation was seen between non-alcoholic fatty liver disease with increased serum cholesterol, increased triglyceride, increased low-density lipoprotein & decreased serum high-density lipoprotein. P value was <0.001 in all the cases. Different grades of non-alcoholic fatty liver disease and individual lipid components showed no significant correlation. Conclusion: This study showed more than two thirds of ultrasonography-diagnosed non-alcoholic fatty liver had abnormal lipid profile. So, safe and non-invasive ultrasonography is very useful for screening and early detection of dyslipidemia in patients.
KEYWORDS:Dyslipidemia, Fatty liver disease; Lipid profile
Introduction
Non-alcoholic fatty liver disease (NAFLD) is a clinical condition where increased fat accumulation is seen in liver parenchyma. Diagnosis of NAFLD can be done by imaging or histopathology after the common causes (alcoholism, disease related, drug induced etc.) are excluded. On histological basis, NAFLD can be categorized into Non-alcoholic fatty liver (NAFL) and Non-alcoholic steatohepatitis (NASH), the difference being evidence of hepatocellular injury (morphologically seen as ballooning of hepatocytes) seen in NASH. So, NAFL shows hepatic steatosis without ballooning of hepatocytes, whereas, NASH shows hepatic steatosis with inflammation (hepatocellular injury evidenced by ballooning of hepatocytes) with or without fibrosis1. NASH patients have up to 20% chance of progression into cirrhosis2. Risk factors associated with fatty liver are obesity (central type), Diabetes Mellitus (Type II) and dyslipidemia, which were said to be common in western population but are increasing in eastern population in recent times. This is statistically reflected by increasing prevalence of NAFLD in 20-40% of population in western industrialized countries3 and 5-30% in developing countries4.
Dyslipidemia along with diabetes, hypertension and obesity is called metabolic syndrome and this syndrome has been seen more commonly in NASH patients in comparison to patients of fatty liver only5. Though NAFLD was considered to be relatively mild clinical entity, recent studies have shown that significant proportion of NAFLD patients can show progression into hepatic fibrosis, hepatic cirrhosis, hepatic failure and finally hepatocellular carcinoma. Thus, fatty liver plays a role to increase hepatic and overall morbidity and mortality.6,7
Most of the individuals with NAFLD are asymptomatic and no definite sign can be appreciated on clinical examination except mild hepatomegaly in few cases. Liver biopsy is the gold standard technique to diagnose NAFLD but it is an invasive and painful technique which may lead to excessive bleeding (threatening life), though chance is rare.8, 9 Possibility of sampling errors are evident. It also gives huge clinical and financial burden to the society. Moreover, special expertise or training is also required.
We have conducted this study to observe the relationship of lipid profile with NAFLD diagnosed on ultrasonography. It helps to determine the association of abnormal lipid profile with NAFLD patients. The findings will help for early detection and timely management of patients with dyslipidemia.
Methodology
Our study was of descriptive cross sectional type and was done at National Academy of Medical Sciences, Bir Hospital from March 1, 2022 to August 31, 2022. Total 105 participants who fulfilled inclusion criteria were randomly selected after taking informed consent. Inclusion criteria were non-alcoholic patients with age of 20 years or more and diagnosed as having fatty liver on ultrasonography in absence of known liver disease. Alcoholic patients were considered as having intake more than 20 gm. alcohol per week and those were excluded from sampling. Ultrasonography of liver was done by same Consultant Radiologist in Toshiba Aplio 400 USG machine using 3-5 MHz curvilinear probe to decrease inter-observer and inter-instrumental variation. Fatty liver was diagnosed on ultrasonography when there is increased echogenicity of liver parenchyma and graded as mild (Grade I), moderate (Grade II) or severe (Grade III). Mild fatty liver is defined as increased echogenicity of liver parenchyma clearly more than that of adjacent renal cortex but echogenic walls of hepatic vessels and diaphragm are normally visualized. Moderate fatty liver is defined as increased parenchymal echogenicity with obscured visualization of echogenic walls of hepatic vessels. Severe fatty liver is defined as increased parenchymal echogenicity with obscured wall of hepatic vessels and diaphragmatic outline.
Laboratory reports of different lipid parameters of all the patients with USG-diagnosed fatty liver were analyzed, which included total cholesterol, triglyceride, low-density lipoprotein (LDL) and high-density lipoprotein (HDL). Then the relationships between USG-diagnosed fatty liver & different lipid parameters were studied.
Entry and tabulation of collected data was done in SPSS 28. Data was analyzed to calculate frequency, mean, median and standard deviation. ANOVA (Analysis of variation) test was done for different grades of fatty liver and each lipid component. Calculation of P-value was done and value less than 0.05 was labelled as statistically significant.
Result
Total 105 participants of USG-diagnosed NAFLD were included in our study. Out of total participants, 55 were males (52.4%) and 50 females (47.6%) (Table 1). Average age of participants was 48.3 years ranging from 25 years (minimum) to 79 years (maximum). Maximum number of participants belong to age group 41-50 years (32.3%) followed by age group 51-60 years (23.8% (Figure 1). Distribution of NAFLD grades among study population was 89 mild (84.7%), 14 moderate (13.3%) and 2 severe (1.9%) (Figure 2). Distribution of NAFLD between male and female gender was statistically not significant (P>0.05).
Table 1: USG Fatty Liver * Gender Crosstabulation
| Gender | Total | |||
| Male | Female | |||
| USG Fatty LIver | Mild | 49 | 40 | 89 |
| Moderate | 6 | 8 | 14 | |
| Severe | 0 | 2 | 2 | |
| Total | 55 | 50 | 105 | |
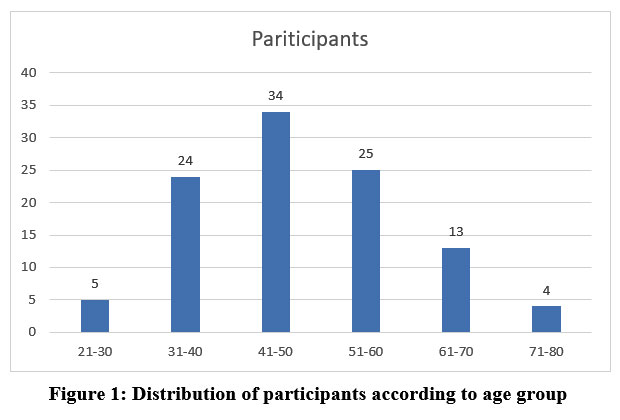 |
Figure 1: Distribution of participants according to age group. |
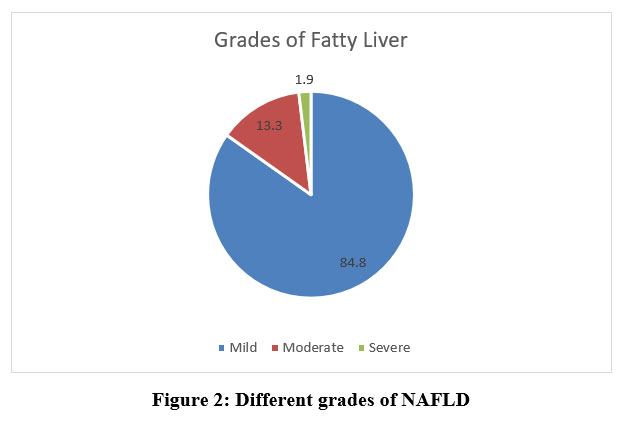 |
Figure 2: Different grades of NAFLD |
Dyslipidemia was found in more than two thirds of our study population. Total cholesterol, triglyceride and LDL were increased in 67.6%, 65.7% and 67.6% respectively. HDL was decreased in 60.9% cases. Mean value of total cholesterol, triglyceride, LDL and HDL were 233.5 gm/dl, 215.5 gm/dl, 148.7 gm/dl and 32.5 gm/dl respectively. When lipid profiles were compared with fatty liver, significant positive correlation was seen between NAFLD with increased serum cholesterol, increased triglyceride, increased LDL & decreased serum HDL. P value was <0.001 in all the cases. Different grades of NAFLD and individual lipid components show no significant correlation.
Discussion
Our study was of descriptive cross sectional type and it included USG-diagnosed cases of NAFLD. Relationship of NAFLD with lipid parameters was studied. Majority of our study population were in 5th and 6th decade of life and mean age was 48.3 years. Similar study conducted by Mahaling Du et al. showed mean age of 49.1 years. Age distribution of the study population was also similar to that of our study10.
Most of our NAFLD cases were graded mild (84.8%) with 13.3 % moderate and only 1.9% severe. Other similar studies have also shown similar pattern of distribution of NAFLD grading with mild variety as the most common and severe variety as very rare. Study conducted by Sen et al. (Sample size = 385) showed severe fatty liver in 1.8 % participantsi, whereas another study conducted by Bhusal et al. taking 100 samples of NAFLD showed 83% mild and 17% moderate cases with no severe grade seen11.
Abnormal lipid profile was seen in majority of cases. In our study, increased serum total cholesterol, increased triglyceride, increased LDL were observed in 67.6%, 65.7% and 67.6% of NAFLD cases respectively. Similarly, decreased serum HDL was seen in 60.9% of the study population. Mean value of total cholesterol, triglyceride, LDL and HDL were 233.5 gm/dl, 215.5 gm/dl, 148.7 gm/dl and 32.5 gm/dl respectively. These findings were comparable to other studies conducted by Sen et al. and Bhusal et al.
When we compared lipid profiles with fatty liver, significant positive correlation was seen between NAFLD with increased serum cholesterol, increased triglyceride, increased LDL & decreased serum HDL. P value was <0.001 in all the cases. However, different grades of NAFLD and individual lipid components show no significant correlation. One of the most probable reason for this is our sample size being small with subsequent very small proportion of severe grade NAFLD cases.
In summary, NAFLD has emerged as a common clinical entity in our clinical practice in recent times. It has stimulated many researchers to study and publish various research articles on this topic. Our study showed significant positive correlation between fatty liver and abnormal lipid profile but different grades of NAFLD did not show any significant correlation with increased lipid components. Hence, larger studies in terms of sample size, involvement of different communities and incorporation of other variables should be conducted in future for the better understanding of this topic.
Conclusion
Our study showed the majority of NAFLD cases had abnormal lipid profile. There was significant positive correlation between NAFLD with increased serum cholesterol, increased triglyceride, increased LDL and decreased HDL. However, no significant correlation was seen between different grades of NAFLD and increasing lipid abnormalities.
Dyslipidemia has been seen to be associated with NAFLD. Since dyslipidemia is also one of the risk factors of cardiovascular and cerebrovascular abnormalities, clinicians must manage dyslipidemia in cases of NAFLD diagnosed on ultrasonography.
Limitation
We took samples of USG-diagnosed NAFLD cases. Sensitivity and specificity of USG to diagnose and grade NAFLD is observer-dependent. Although we used single observer and same USG machine, chance of false positive NAFLD sample is still there, which might affect the overall result. Another limitation was our study took sample from patients who came to hospital, so the results may not truly reflect the health condition of general population.
Conflict of Interest
There are no conflict of interest.
Funding Source
There is no funding sources
References
- Puri P, Sanyal AJ. Nonalcoholic fatty liver disease: Definitions, risk factors, and workup. Clin Liver Dis (Hoboken). 2012 Sep 25;1(4):99-103.
CrossRef - Sen A, Kumar J, Misra RP, Uddin M, Shukla PC. Lipid profile of patients having non-alcoholic fatty liver disease as per ultrasound findings in north Indian population: A retrospective observational study.J Med Allied Sci. 2013; 3 (2): 59-62.
- Chitturi S, Farrell GC, Hashimoto E. Non-alcoholic fatty liver disease in the Asia-Pacific region: definitions and overview of proposed guidelines. J Gastroenterol Hepatol. 2007; 22:778.
CrossRef - Williams CD, Stengel J, Asike MI. Prevalence of nonalcoholic fatty liver disease and nonalcoholic steatohepatitis among a largely middle-aged population utilizing ultrasound and liver biopsy: a prospective study. Gastroenterology. 2011; 140:124.
CrossRef - Marchesini G, Bugianesi E, Forlani G. Nonalcoholic fatty liver, steatohepatitis, and the metabolic syndrome. Hepatology 2003; 37:917.
CrossRef - Baffy G, Brunt EM, Caldwell SH. Hepatocellular carcinoma in non-alcoholic fatty liver disease: an emerging menace. J Hepatol. 2012; 56:1384–91.
CrossRef - De Minicis S, Marzioni M, Saccomanno S, Rychlicki C, Agostinelli L, Trozzi L. Cellular and molecular mechanisms of hepatic fibrogenesis leading to liver cancer. Transl Gastrointest Cancer. 2012; 1:88–94.
- Chalasani N, Younossi Z, Lavine JE, Diehl AM, Brunt EM, Cusi K. The diagnosis and management of nonalcoholic fatty liver disease: practice Guideline by the American Association for the Study of Liver Diseases, American College of Gastroenterology, and the American Gastroenterological Association. Hepatology. 2012; 55:2005–2023.
CrossRef - Shahin M, Rasoul S, Mehdi N, Masoumeh PH, Sadaf GS, Reza M. Sampling error in histopathology findings of nonalcoholic fatty liver disease: a post mortem liver histology study. Arch Iran Med.2012; 15:418–421.
CrossRef - Mahaling DU, Basavaraj MM, Bika AJ Comparison of lipid profile in different grades of non-alcoholic fatty liver disease diagnosed on ultrasound.Asian Pacific J Trop Biomed. 2013; 3(11): 907–912.
CrossRef - Bhusal KR, Simkhada R, Nepal P. Lipid profile in different grades of Ultrasonic Nonalcoholic Fatty Liver Disease. JCMS Nepal. 2017;13(2):258-61.
CrossRef
Accepted on: 22-03-2023
Second Review by: Dr. Sabyasachi Banerjee
Final Approval by: Dr. Eugene A. Silow


![]()
![]()
