
Selection of Optimum Method for Nanoparticles in Lung Cancer Therapeutics
 , Swati Changdeo Jagdale2* and Aniruddha Rajaram Chabukswar2
 1MAEER’s Maharashtra Institute of Pharmacy, MIT College Campus, Kothrud, Pune, MH, India-411038.
2School of Pharmacy, Dr. Vishwanath Karad MIT World Peace University, MIT College Campus, Kothrud, Pune, MH, India - 411038.
Corresponding Author E-mail: jagdaleswati@rediffmail.com
DOI : http://dx.doi.org/10.13005/bbra/2987
Download this article as:
![]()
The purpose of the study was to compare and select optimum method for nanoparticles formulation in lung cancer therapeutics. For this experiment etoposide, anti-neoplastic agent was used as study molecule. The nanoparticles were prepared by methods like quassi emulsification solvent diffusion, high speed homogenization, probe sonication, magnetic stirring and compared. The batches for each method were prepared in different ratios of drug to polymers. All the formulated batches were evaluated for %EE, %DL, Particle size, polydispersity index and zeta potential. The method with better results was selected for further factorial model study. The batch with better results from 32 factorial model was investigated further for FTIR, DSC, XRD and drug release study. After comparing results of all the methods, method probe sonication with batch code C8 was found better. After applying factorial model, method with batch code F6 shown better results and showed no interactions between drug and polymer. % Drug release study showed almost two folds increased release. The probe sonication method was optimum method among all the methods. These formulated nanoparticles further can be incorporated in drug delivery for more efficient formulation in treatment of lung cancer.
KEYWORDS:
Etoposide; High Speed homogenization; Lung cancer; Nanoparticles; Probe sonication; Quassi emulsification solvent diffusion
Introduction
Cancer is a foremost root cause of death. Cancer is a disease in which abnormal cells grow, spread in uncontrolled manner to other normal cells and body parts. If the spread is not controlled, it can result into death. 1-3 They have a substantial potential in cancer therapeutics. Diagnosis and treatment of cancer is a challenge. Research is being done to beat cancer and to manage side effects of treatment. Worldwide, lung cancer kills about 1.5 million people every year. WHO report shows tobacco use is the most important risk factor in developing lung cancer and adds 71% of global lung cancer death. Overall, lung cancer is the cause of 18% of all cancer deaths and approximately 13% of all new cases of cancer are lung cancers. The incidence rate of lung cancer is more in males than female.
Etoposide (ETP) is a molecule from anti-neoplastic representative, used in Non-Small Cell Lung Cancer (NSCLC) therapeutics. It acts as an apoptosis inducer by inhibiting topoisomerase II. ETP is sparingly soluble in water. 4-5 The chemical modification previously has been made to improve the solubility of the etoposide by various methods like solid dispersion, solubilization, suspension etc. The nano-forms of etoposide have been also formulated like nanoparticles with polymers like PLGA, nano-crystals, nano-liposomes etc. 5-7
Nanotechnology is employed in designing, development, manufacturing, evaluations and applications of structures, medical devices and systems by managing shape and size at a nanometer scale. Nanomedicine is submicron size (<1µm) modules, used for detection, analysis, cure, observation, and management of biological system. 6-7
Based on nanotechnology, nanocarriers include nanoparticles, nanotubes, nanofibers, nanosuspension, dendrimers, quantunm dots, and micelles etc. The properties of nanoparticles and drug release characteristics rely on methods of nanoparticles formulation. Nanoparticles can be prepared by formulating matrix or reservoir type structure. They enhance specificity of drug action by altering the pharmacokinetic properties of the drug. Thus, nanoparticles are favorable carriers and play crucial for targeted anticancer drug delivery. They improve therapeutic effectiveness of the drug. 8-10 They diminish the systemic adverse and toxic reactions due to drugs as they target specifically to tumor cells.
To increase the solubility of drug nanoparticles of the same can be formulated. The nanoparticles exhibit high surface area, so, may enhance absorption, availability and hence dose can be reduced to minimize the side effects of chemotherapy. 11-12 Also, nanoparticles of ETP can be further utilized in targeted drug delivery formulation.
Presently a lot of work is in progress for nanosuspension formulation using different techniques such as media milling, homogenization, nano jet technology, emulsion-solvent evaporation technique, hydrosol method, supercritical fluid method, combined precipitation and homogenization method, etc. However, the literature survey shows that very less or no data is available for nanosuspension for a metered-dose inhaler. The methodology has not been developed for any drugs in the category of anticancer drugs for lung cancer treatment. 12-13
The present selected drugs etoposide have not yet been investigated as proposed at national and international levels. Commercially these drugs are available in injection form only. It shows high variability in oral bioavailability and a very short half-life time. So, the present study deals with the development of nanosuspension using the above drug for site-directed therapy to treat lung cancer. Formulation of nanosuspension for metered-dose inhaler dosage form will lead to a reduction in particle size, availability of greater surface area which will increase the dissolution rate and penetration of drug deeply in the lungs. This will improve drug bioavailability. Nanosuspension in inhaled reaches quickly at the lung giving controlled local as well as systemic effect at the target site. 11-14 This site targeted drug delivery is needle-free; will offer patient compliance and reduce the dose frequency for drugs with an increase in therapeutic activity. Lung-targeted drug delivery will give targeted action to the patients suffering from lung cancer.
Methods
Materials
ETP was gift specimen by Neon laboratories limited. Other excipients and solvents were of analytical grade and purchased from new Neeta chemicals.
Preliminary study of drug
Preliminary study of ETP was carried out. Drug studied for physical and chemical properties. Drug studied for color, odor and melting point. The solubility profile drug was determined in water, methanol. Melting point of ETP was calculated by capillary technique. 5-6
Formulation and Development of Nanosuspension
Preliminary trial for various methods
In organic phase was prepared ETP was dissolved in methanol. For aqueous phase a stabilizing agent – poloxamer 188 and polymer – Eudragit RL100 was dissolved in distilled water with high speed stirrer and then sonication. 7-8 The various methods and batches were prepared using those methods is described below. All the batches were formulated in triplicate.
Quassi emulsification solvent diffusion
The organic phase was prepared by dissolving drug Etoposide 10 mg in 3 ml methanol. Aqueous phase was prepared by dissolving a stabilizing agent – poloxamer 188 and polymer – Eudragit RL100 in 20 ml by using high speed stirring followed by sonication. The organic solution was added drop wise into aqueous phase at 10000 rpm by using high speed homogenizer for 30 minutes. The suspension was kept on magnetic stirring for 4-6 hours to evaporate organic solvent. The suspension was sonicated for 30 minutes. After that the suspension was centrifuged at 4500 rpm for 60 minutes. 9-14
High Speed homogenization
The organic phase was prepared by dissolving drug Etoposide 10 mg in 3 ml methanol. Aqueous phase was prepared by dissolving a stabilizing agent – poloxamer 188 and PVP K-30 in 20 ml by using high speed stirring followed by sonication. The organic solution was added drop wise into aqueous phase at 15000 rpm by using high speed homogenizer for 30 minutes. 9-14 The suspension was kept on magnetic stirring for 4-6 hours to evaporate organic solvent. The suspension was sonicated for 30 minutes. After that the suspension was centrifuged at 4500 rpm for 60 minutes.
Probe sonication
The organic phase was prepared by dissolving drug Etoposide 10 mg in 3 ml methanol. Aqueous phase was prepared by dissolving a stabilizing agent – poloxamer 188 and PVP K-30 in 20 ml with continuous stirring. The presuspension was formulated by using high speed homogenizer. The organic solution was added drop wise into aqueous phase at 5000 rpm by using high speed homogenizer for 10 minutes. 9-14 The presuspension was treated with probe sonicator with amplitude of 80% for 20 minutes. This suspension was kept on magnetic stirring for 4-6 hours to evaporate organic solvent. The suspension was sonicated for 30 minutes. After that the suspension was centrifuged at 4500 rpm for 60 minutes.
Magnetic Stirring
The organic phase was prepared by dissolving drug Etoposide 10 mg in 3 ml methanol. Aqueous phase was prepared by dissolving a stabilizing agent – poloxamer 188 and PVP K-30 in 20 ml with continuous stirring. The organic solution was added drop wise into aqueous phase with continuous magnetic stirring at 800 rpm for initial 15 min followed by at 600 rpm by using high speed homogenizer for 30 minutes. Solution were kept room temperature thereafter and utilized for further evaluation. 9-14
Separation of nanoparticles
All batches of nanosuspension were kept on magnetic stirring for 4-6 hours. The nanoparticles were separated by centrifugation process at 5000 rpm for 60 min. The supernatant solutions contains unentrapped drug was decanted from the pellet. The pellets were further dried by freeze drying.
Optimization of method and batch
For further optimization of batches, formulations with some variations in the drug: polymer: stabilizer rations were prepared. These batches were evaluated and method showing better results was selected and factorial model was applied for the same.
Factorial model
The experimental runs were designed by Design Expert software with version 13.0.2.0 by StatEase for formulation optimization15-16. The factorial model 32 was applied for the method probe sonication. The coded experimental levels based on 32 factorial models are given in table 1.
The 9 batches were formulated in triplicates as per table and were investigated for % entrapment efficiency (%EE), % drug loading (%DL), zeta potential and scanning electron microscopy (SEM). The batches were coded from F1 to F8 and PVP K-30 concentration and probe amplitude were varied.
Evaluation of nanosuspension
% EE and %DL
The free drug in the nanosuspension was sedimented by centrifugation and the supernatant solution was utilized to calculate free drug content. The supernatant solution was dissolved in methanol and analyzed using UV at 285 nm.
Theoretical % drug loading and practical drug loading were calculated separately.
Formula
Entrapment efficiency

Drug loading

Particle size, polydispersity index (PI) and zeta potential
The average particle size, particle size distribution, polydispersity index, and zeta potential were calculated by Malvern Zeta sizer (Nano Z-S; Malvern Instruments).
Particle size
The particle size was determined on scanning electron microscope. The slide was prepared with nanosuspension, dried and observed under microscope. The image was captured and particle size was determined.
Fourier Transform Infrared (FTIR) spectroscopy
The pellets of sample and KBr were prepared and then the scanned on IR spectrophotometer (Varian 4640) in the IR range from 400 to 4000cm-1. The spectrum was recorded, analyzed and functional groups were determined.
Differential scanning calorimetry (DSC)
DSC (Hitachi 7020) was utilized to record DSC thermograms. Sample was heated at a heating rate 10ºC/min in aluminium pan upto 2000C. With DSC thermogram, a thermal data analysis was carried out.
In-vitro drug release (Dialysis study)
Dialysis bag method was utilized with Dialysis membrane 50 and Phosphate buffer 7.4 to study the drug release. Sample was filled in bag and was placed in a beaker filled with dissolution medium. The stirring speed and temperature was maintained at 50 rpm and 37±0.5ºC, respectively. From the medium, aliquots were drawn out and sink condition was maintained. Then samples were investigated on UV at 285 nm.
Results
Characterization of Etoposide
The results of preformulation study are mentioned in Table 1.
Table 1: Drug preformulation study.
| Parameter | Experimental value | Reference value(COA) / Literature | |
| Description | Solid, crystalline powder, White | Solid, crystalline powder, White | |
| Solubility | Water | 0.0614 mg/ml | 0.081 mg/ml |
| Methanol | 0.68 mg/ml | 0.76 mg/ml | |
| Melting point | 241 – 245 0C | 236-251 0C | |
UV spectroscopic study
From the UV scan of standard ETP drug, the maximum absorbance was observed at wavelength at 285 nm.
Formulation and Evaluation of Nanosuspension
% EE and %DL
All the batches were examined for entrapment efficiency and drug loading. The results are as follows in Table 2 in preliminary methods:
Table 2: Preliminary results of methods.
| Quassi emulsification solvent diffusion method | High speed Homogenization method | Probe sonication method
|
|||||||||
| Batch Code | % EE | % DL | Appearance | Batch Code | % EE | % DL | Appearance | Batch Code | % EE | % DL | Appearance |
| A 1 | 35.16 | 17.6 | Clear | B 1 | 34 | 17 | Clear | C 1 | 37.68 | 18.3 | Clear |
| A 2 | 36.5 | 18.4 | Clear | B 2 | 33.2 | 15.6 | Clear | C 2 | 39.7 | 19.9 | Clear |
| A 3 | 45.72 | 22.9 | Clear | B 3 | 38.72 | 19.4 | Clear | C 3 | 45.86 | 23 | Clear |
| A 4 | 36.06 | 6.03 | Transparent | B 4 | 44 | 7.33 | Clear | C 4 | 38.8 | 6.4 | Clear |
| A 5 | 39.56 | 6.6 | Transparent | B 5 | 37.04 | 6.2 | Clear | C 5 | 50.4 | 8.4 | Clear |
| A 6 | 43.4 | 7.23 | Transparent | B 6 | 37.4 | 6.23 | Clear | C 6 | 44.4 | 7.4 | Clear |
| A 7 | 57.74 | 5.25 | Transparent | B 7 | 58.6 | 5.32 | Clear | C 7 | 48.2 | 4.38 | Transparent |
| A 8 | 73.08 | 6.65 | Transparent | B 8 | 70 | 6.36 | Clear | C 8 | 70.12 | 6.38 | Transparent |
| A 9 | 59.08 | 5.38 | Transparent | B 9 | 62.6 | 5.69 | Clear | C 9 | 64.6 | 5.87 | Transparent |
| A 10 | 58.58 | 3.66 | Turbid | B 10 | 57.04 | 3.58 | Turbid | C 10 | 57 | 3.56 | Turbid |
| A 11 | 67.54 | 4.22 | Turbid | B 11 | 65.4 | 4.08 | Turbid | C 11 | 48.8 | 3.05 | Turbid |
| A 12 | 60 | 3.75 | Turbid | B 12 | 60.6 | 3.78 | Turbid | C 12 | 62.2 | 3.88 | Turbid |
| A 13 | 50.06 | 2.39 | Very turbid | B 13 | 43.8 | 2.08 | Very turbid | C 13 | 55.8 | 2.6 | Very turbid |
| A 14 | 59.64 | 2.84 | Very turbid | B 14 | 46 | 2.19 | Very turbid | C 14 | 59.98 | 2.85 | Very turbid |
| A 15 | 53.48 | 2.55 | Very turbid | B 15 | 52.8 | 2.51 | Very turbid | C 15 | 72.8 | 3.46 | Very turbid |
Magnetic Stirring
The magnetic stirring method was tried for the ratio 1:1:1, 1:1:0.5, 1:1:0.2. The nanosuspension was very turbid and clumsy. So, the method was rejected. From all the above study and data, the probe sonication method proved to be effective. Hence, the further evaluation was carried out for probe sonication method.
Trials for Probe sonication method
The factorial model 32 was applied for the method 3 – probe sonication for optimization. The 9 batches were formulated and evaluated for % entrapment efficiency, %DL, poly dispersity index, zeta potential and scanning electron microscopy (SEM), summarized in Table 3.
Table 3: Result of factorial batches
| Formulation code | % Entrapment efficiency | % Drug Loading | Particle size (nm) | PDI | Zeta potential (mV) | Appearance |
| F1 | 74.5 | 6.3 | 388 | 0.398 | – 26.1 | Clear |
| F2 | 72.78 | 6.5 | 1082 | 0.059 | – 17.9 | Clear |
| F3 | 79.2 | 6.9 | 278 | 0.781 | – 21.8 | Clear |
| F4 | 76.2 | 6.5 | 434 | 0.348 | – 15.3 | Clear |
| F5 | 81.2 | 7.3 | 367 | 0.089 | – 12.6 | Clear |
| F6 | 81.6 | 7.5 | 94 | 0.219 | – 18.8 | Clear |
| F7 | 76.8 | 6.4 | 1023 | 0.495 | – 35.1 | Clear |
| F8 | 78.6 | 6.8 | 1216 | 0.685 | – 29.5 | Clear |
| F9 | 80.2 | 7.1 | 984 | 0.0988 | – 23.4 | Clear |
Scanning electron microscopy
Figure 1 represents the SEM analysis for factorial batches F1 to F9.
 |
Figure 1: SEM analysis for factorial batches F1 to F9. |
Statistical analysis
The results were examined using normal plot and contour plot to calculate the significant effects and mentioned in Table 4.
Table 4: Responses
| Response | Name | Units | Observations | Minimum | Maximum | Mean | Std. Dev. | Ratio |
| R1 | % EE | % | 9.00 | 72.78 | 81.6 | 77.90 | 3.04 | 1.12 |
| R2 | DL | % | 9.00 | 6.3 | 7.5 | 6.81 | 0.4226 | 1.19 |
The data was examined and filtered to several models. The result claimed that quadratic model showed more regression (R2), less P value, and better descriptive statistics. So, linear model was accepted to set up the empirical model.
% EE
The result of statistics was found as standard deviation was 1.06, mean was 77.90, C.V% was 1.36, R2 was 0.9546, Adjusted R² was 0.8790, Adeq Precision was 9.4050.
Final equation with actual factors
%EE = -87.12181 +21.33476 PVP K-30 +4.00353 Amplitude of probe+0.108333 PVP K-30 * Amplitude of probe -11.72222 PVP K-30² -0.026600 Amplitude of probe²
The model graphs, like 3D response surface, contour plots, were generated. These graphs visualized the relationship between particle size and variables. These graphs also assessed the individual and interactive effects on the response. Figure 2 is 3D surface and perturbation plot from DOE for % EE.
 |
Figure 2: 3D surface and perturbation plot from DOE for % EE. |
% DL
The result of statistics was found as standard deviation was 0.1272, mean was 6.81, C.V% was 1.87, R2 was 0.9660, Adjusted R² was 0.9094, Adeq Precision was 10.2003.
Final equation with actual factors
DL = -19.05666 +5.96426 PVP K-30 +0.5792
80 Amplitude of probe -0.008333 PVP K-30 * Amplitude of probe -2.08333 PVP K-30² -0.003625 Amplitude of probe²
Figure 3 is 3D surface and perturbation plot from DOE for % DL while figure 4 is solution graph from DOE.
 |
Figure 3: 3D surface and perturbation plot from DOE for % DL. |
 |
Figure 4: Solution graph from DOE. |
Table 5 summarized Point Prediction two-sided, confidence = 95% , population = 99% and Table 6 mentioned Confirmation with Two-sided and Confidence = 95% while Table 7 summarized values of factors in factorial model.
Table 5: Point Prediction.
| Solution 3 of 100 Response | Predicted Mean | Predicted Median | Observed | Std Dev | SE Mean | 95% CI low for Mean | 95% CI high for Mean | 95% TI low for 99% Pop | 95% TI high for 99% Pop |
| % EE | 78.3358 | 78.3358 | 1.05745 | 0.835991 | 75.6753 | 80.9963 | 68.4148 | 88.2567 | |
| % DL | 6.97374 | 6.97374 | 0.127228 | 0.100582 | 6.65365 | 7.29384 | 5.7801 | 8.16739 |
Table 6: Confirmation
| Solution 3 of 100 Response | Predicted Mean | Predicted Median | Observed | Std Dev | n | SE Pred | 95% PI low |
| % EE | 78.3358 | 78.3358 | 1.05745 | 1 | 1.34799 | 74.0458 | |
| % DL | 6.97374 | 6.97374 | 0.127228 | 1 | 0.162184 | 6.4576 |
Table 7: Values of factors in factorial model
| Intercept | A | B | AB | A² | B² | |
| % EE | 81.2 | 1.96709 | -1.44134 | 0.325 | -1.055 | -2.66 |
| p-values | 0.0134 | 0.0308 | 0.5822 | 0.1874 | 0.0233 | |
| % DL | 7.3 | 0.339277 | -0.090533 | -0.025 | -0.1875 | -0.3625 |
| p-values | 0.0048 | 0.1376 | 0.7206 | 0.0867 | 0.0166 |
As per ANOVA analysis, this quadratic model was greatly significant, as the probability value was found < 0.0001. The value of regression coefficient (R2 =0.9546 and 0.9660) indicated all variations were not expounded by adopted regression model. This assured the reliability of model to interpolate. The coefficient of variation (CV=1.36 and 1.87%) assured the high degree of precision. The adequate precision was found 9.4050 and 10.2003. Thus, indicated the best fitness of developed model.
As per DOE model suggestion, F6 batch was selected as optimized. The batch was formulated and evaluated as per. The results of optimized F6 batch are as follows:
IR Spectrophotometer
The FTIR spectra revealed various peaks; near 3460cm-1 which represents O-H stretching frequency of secondary alcoholic hydroxyl groups. The peaks were found 1108 cm-1 and 1030.02 cm-1 represented Ar- OCH3 stretching vibrations. Some peaks were found slightly displaced due to some minor chemical interaction in ETP and polymer. Such chemical interactions had no significant effect on the drug release profile. Figure 5 represents FTIR graph of optimized ETP-NP batch F6.
 |
Figure 5: FTIR graph of A) Etoposide B)Poloxamer 188 C) PVP K30 and D) optimized ETP-NP batch F6 |
Differential scanning colorimetry (DSC)
Figure 6 represents DSC thermogram of optimized ETP-NP batch F6.
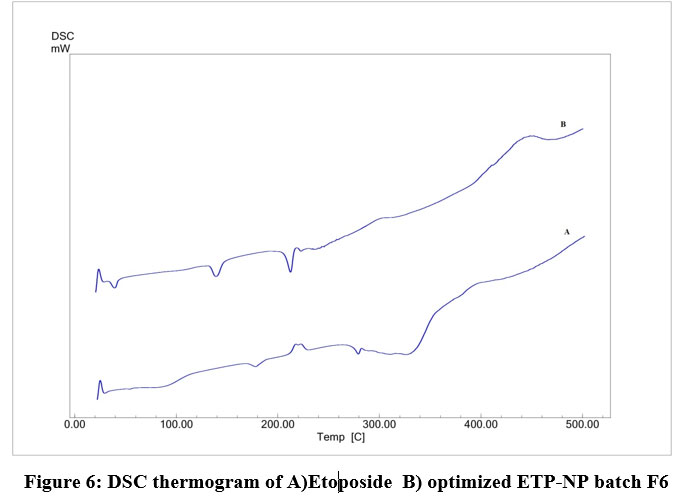 |
Figure 6: DSC thermogram of A)Etoposide B) optimized ETP-NP batch F6. |
In-vitro drug release
The figure 7 is comparative study of % drug release from plain ETP solution and batch F6 of ETP-NP.
 |
Figure 7: Comparative graph showing percent drug release. |
Discussion
After evaluation of nanosuspension batches, the probe sonication method found to good. To optimize further factorial model applied. The batches formulated, evaluated and batch F6 found optimized after statistical analysis. F6 batch was further evaluated. FTIR spectra showed there were peaks of O-H stretching, Ar- OCH3 stretching, showed no chemical interactions. DSC thermogram showed an endothermic peak at 20-300, 60-700 which showed the dehydration of ETP-NP. There is no peak appeared other than the principal peak. This indicated that no interaction between the drug and other carrier and excipients. The ETP deliver from optimized ETP-NP batch was found more, almost two folds increased when compared with the plain ETP solution.
Conclusion
In the present experiment, comparisons of methods formulation of nanosuspension were investigated namely quassi emulsification solvent diffusion, high speed homogenization, probe sonication, magnetic stirring. Then the factorial batches were prepared for the probe sonication method as the results found for the batch were better. The evaluation of factorial batches was carried out with % EE, %DL, size distribution, polydispersity index (PI) and zeta potential, FTIR, DSC, drug release study. After comparing all the four methods, the probe sonication method showed good results. After variations in parameters of the same batch, the batch F6 found as optimum with good particle size distribution and drug release. This work will help the researchers as this formulated optimized nanosuspension batch can be employed for further drug delivery formulations also.
Acknowledgments
The authors are highly obliged to Council of Scientific and Industrial Research (CSIR), Extramural Research Division, New Delhi for providing the research fund to carry the project. Also, authors are grateful to Neon Laboratories Ltd for timely help of gift sample of ETP.
Conflict of Interest
there is no conflict of interest.
Funding Source
Council of Scientific and Industrial Research (CSIR), Extramural Research Division, New Delhi, India
References
- Ho art , Ubrich N., Simonin C., Babak V., Vigneron C., Ho man M. Low molecular weight heparin-loaded polymeric nanoparticles: formulation, characterization and release characteristics. Drug DevInd Pharm. 2002; 28: 1091-1099.
CrossRef - Hombreiro-Perez M, Siepmann J, Zinutti C, Lamprecht A, Ubrich N, Ho_ma M. Non degradable microparticles containing a hydrophilic and/or a lipophilic drug: preparation, characterization and drug release J Control Release. 2003; 88: 413428.
CrossRef - Sheikh HA, Socha M, Laprecht A, Ghazouani FE, Sapin A, Ho_man M. Effect of the microencapsulation of nanoparticles on the reduction of burst release. Int J Pharm. 2007; 344: 53-61.
CrossRef - Xing J, Zhan, D, and Tan T. Studies on the oridonin-loaded poly (D,L-lactic acid) nanoparticles in vitro and in vivo. Int J Biol Macromol. 2007; 40: 153-158.
CrossRef - Fatemeh Zare K, Amir H, Azim A & Mehdi A. Preparation, characterization and invitro evaluation of PEGylated nanoliposomal containing etoposide on lung cancer. Artificial Cells, Nanomedicine, and Biotechnology. 2019; 47:1, 3222-3230.
CrossRef - Boltri L, Coceani N, De Curto D, Dobetti L, Esposito P. Enhancement and modification of etoposide release from crospovidone particles loaded with oil-surfactant blends. Pharm Dev Technol. 1997 Nov;2(4):373-81.
CrossRef - Raju, YPrasanna & Garbhapu, Asuntha & Prasanna, S.A.L & Rao, BSreenivasa & K, Ramana. (2007). Studies on enhancement of dissolution rate of etoposide. Indian Journal of Pharmaceutical Sciences. 10.4103/0250-474X.33155.
CrossRef - Rongrong Z, Qingxiu W, Yanjing Z, Zhaoqi W, Haixia Z, Bin W, Xianzheng W, Shilong pH sensitive nano layered double hydroxides reduce the hematotoxicity and enhance the anticancer efficacy of etoposide on non-small cell lung cancer. Acta Biomaterialia. 2016; 29, 320–332.
CrossRef - Smita P, Arehalli SM, Mukesh U, Murthy RSR. PLGA nanoparticles loaded with etoposide and quercetin dihydrate individually: in vitro cell line study to ensure advantage of combination therapy. Cancer Nano. 2012; 3:25–36.
CrossRef - Kanser H, Hedefleyen E, İçeren Yeni P, Nanopartiküllerin H ve Biyofarmasötik D. Preparation and Biopharmaceutical Evaluation of Novel Polymeric Nanoparticles Containing Etoposide for Targeting Cancer Cells. Turk J Pharm Sci. 2019; 16 (2):132-140.
CrossRef - Marigny K, Aubin F, Burgot G, Le Gall E, Gandemer V. Particular cutaneous side effects with etoposide-containing courses: is VP-16 or etoposide phosphate responsible? Cancer Chemotherapy Pharmacology. 2005; (55): 244-250.
CrossRef - Reddy LH, Murthy RS. Etoposide-loaded nanoparticles made from glyceride lipids: formulation, characterization, in vitro drug release, and stability evaluation. AAPS PharmSciTech. PMID: 16353973; PMCID: PMC2750527. 2005; 6 (2):E158-66.
CrossRef - Samy M, Abd El-Alim SH, Rabia AEG, Amin A, Ayoub MMH. Formulation, characterization and in vitro release study of 5-fluorouracil loaded chitosan nanoparticles. Int J Biol Macromol. PMID: 32320805. 2020; 156: 783-791.
CrossRef - Wang B, Yu XC, Xu SF, Xu M. Paclitaxel and etoposide co-loaded polymeric nanoparticles for the effective combination therapy against human osteosarcoma. J Nanobiotechnology. PMID: 25880868; PMCID: PMC4377179. 2015;13:22.
CrossRef - Jagdale SC, Pawar CR. Application of design of experiment for polyox and xanthan gum coated floating pulsatile delivery of sumatriptan succinate in migraine treatment. BioMed Res Int 2014; Article ID 547212. doi: http://dx.doi.org/10.1155/2014/547212
CrossRef - Jagdale SC, Patil S, Kuchekar BS. Application of design of experiment for floating drug delivery of tapentadol hydrochloride. Computational Math Met Med 2013 ; 2013 : Article ID 625729. doi: http://dx.doi.org/10.1155/2013/625729
CrossRef
Accepted on: 04-07-2022
Second Review by: Dr. Van-An Duong
Final Approval by: Dr. Hifzur R. Siddique


![]()
![]()
