
Polymorphismic Changes in Blood Groups of the Naga Tribes of Nagaland
 , RollenYanthan , , , , , , Nandakumar R*
 Department of Zoology, St.Joseph University Ikishe Model Village, Dimapur, Nagaland, India- 797115
Corresponding Author E-mail: drnkzoo@gmail.com
DOI : http://dx.doi.org/10.13005/bbra/2770
Download this article as:
![]()
Northern India is one of the oldest geophysical regions of human evolution and migration in the world. Genetic and anthropological studies have shown that the peopling the subcontinent is characterized by a complex history, contributed from different ancestral populations. Genetic level studies of polymorphisms always associated with health and diseases of population becoming the need of hours. The present study was aimed to explore the relationship of ABO blood groups association of populations and to assess the prevalence of blood groups in different categories of Northern India and to compare our results with other studies conducted in India. Blood samples from 155 unrelated individuals was collected from Naga tribal settlements Blood groups of individuals were evaluated with the presence of antigen using monoclonal antibody by a standard blood typing are protocol, Gene frequencies was calculated by Hardy-Weinberg method. The blood group O 67 (43.23%) was the commonest group prevalent in donors followed by group B 45 (29.03%), A 33(21.29%) and AB 10 (6.45%). The Rh negative was not observed in female donors, whereas in male it was found to be 1.3%.Data among tribal suggest their common origin as well as a drift from an original population due to the possible founder effect among tribal Naga Ten Tribal
KEYWORDS:ABO Blood Groups; Diphupar-B; Diversity; Nagaland; Rhesus Factor
Introduction
The ABO blood group system was the first human blood group system to be discovered by Landsteiner in 1900[1]. The ABO blood group system is the only system in which antibodies are consistently and predictably present in the serum of normal individuals whose red cells lack the antigens . Apart from differences amongst species, differences between the individuals of the same species have also been demonstrated. During the world wars, it was discovered for the first time that the frequency of ABO and Rhesus blood groups was different in persons native to different parts of the world [2-3]. ABO and Rh gene phenotypes vary widely across races and geographical boundaries despite the fact that the antigens involved are stable throughout life. The resultant polymorphism remains important in population genetic studies, estimating the availability of compatible blood, evaluating the probability of hemolytic disease in the new born, resolving disputes in paternity/maternity and for forensic purposes[4]. The frequency of ABO and Rh phenotypes in different populations hasve been extensively studied. Rh system emerged as second most important blood group system due to hemolytic disease of newborn and its importance in RhD negative individuals in subsequent transfusions once they develop Rh antibodies. The D antigen, after A and B, is the most important red cell antigen in transfusion practice[5] . Unlike the situation with A and B, persons whose red cell lacks the D antigen do not regularly have anti D in their serum. Blood bank usually has a problem of ever-changing stock position and it being very difficult to predict the prevalence of a particular blood group at a particular time. The present study was done to assess the prevalence of blood groups in different categories of Northern India and to compare our results with other studies conducted in India and elsewhere in the world and its multipurpose future utilities for the health planners[ 6-8].
Materials and Methodology
The study of ABO and Rhesus Blood Group was carried out on 155 blood donors (male and female) during a period of two months from 1st september to 31st October 2018 in Diphupar-B area Dimapur, Nagaland. The blood donors were selected after taking a detailed history and a complete examination regarding their eligibility criteria for blood donation. Donor’s name, age, sex, occupation, caste, complete postal address and contact number was recorded. Blood samples were obtained by standard procedures of venupuncture and subjected to determination of ABO and Rhesus blood group using “antisera” by combined slide and test tube method. Each sample of donors was tested for ABO and Rhesus status.
Laboratory analysis
ABO and Rh blood group tests are carried out by a standard protocol using AB D Antisera typing Kit.(Fig. 1.)
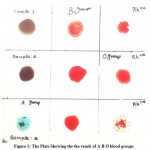 |
Figure 1: The Plate Showing the the result of A B O blood groups |
Statistical analysis
The gene and allele frequencies of blood group, are calculated by Hardy-Weinberg model using S2 ABO estimator software[7]. Allele frequencies are calculated under the assumption of Hardy–Weinberg equilibrium and expressed as percentages. The chi – square test is used to compare observed allelic and genotypic frequency distributions of the blood group and Rh antigens to that of under the Hardy–Weinberg. [9]. ABO blood was aligned according to their respective frequencies in populations using PAST software : PCA and Phylogenetic trees were constructed, using Neighbor-Joining (NJ) method
Table 1: Hardy-Weinberg model for ABO blood group
| Phenotype
(blood group) |
Genotype | Phenotype
frequency |
Genotypic
frequency |
Expected
frequency |
| A
B O AB |
AA+AO
BB+BO AB OO |
𝑛A
𝑛B 𝑛AB 𝑛O |
𝑛AA + 𝑛AO
𝑛BB + 𝑛BO 𝑛AB 𝑛OO |
p2 + 2pr
q2 + 2qr 2pq r2 |
Results
The ABO and Rhesus blood Group in Diphupar-B showsed various typical results. The frequency of ABO and Rh blood groups in a total of 155 (male and female)donor population was compared. Amongst Rh positive female donors blood group O was found to be most prevalent in group 34(45.95%), followed by group B 23(31.08%), A 14(18.92%) and AB 3(4.05%). Amongst Rh positive male donors blood group O was the most prevalent group 33(41.77%), followed by group B 21(26.58%), group A 18(22.78%) and group AB 7(8.86%). The Rh negative does not exist in any female donors. The Rh negative appears only in male donors in blood group A-ve(1) and B-ve (1)with 1.3%..
Table 2: Overall allele frequencies for the ABO and Rh antigens in the Ten studied populations
| Group | Gene frequency | Hardy-
Weinberg log likelihood |
Genotypic
frequency |
𝜒2 | 𝑃value | Rh+(D) | Rh-(d) | ||
| p[A] | q[B] | r[O] | |||||||
| Total | 0.16 | 0.2 | 0.64 | -179.3 | O>B>A | 0.11 | 0.73 | 0.99 | 0.01 |
| Chekhesang | 0.13 | 0.30 | 0.57 | -57.48 | O>B>A | 0.95 | 0.32 | 1.00 | 0.00 |
| Sumi | 0.27 | 0.03 | 0.70 | -15.20 | O>A>B | 0.39 | 0.52 | 1.00 | 0.00 |
| Angami | 0.10 | 0.10 | 0.8 | -15.09 | O>A =B | 0.39 | 0.53 | 1.00 | 0.00 |
| Ao | 0.20 | 0.27 | 0.51 | -40.03 | O>B>A | 1.45 | 0.22 | 0.97 | 0.03 |
| Mao | 0.2 | 0.16 | 0.64 | -16.40 | O>A>B | 1.34 | 0.25 | 1.00 | 0.00 |
| Lotha | 0.13 | 0.07 | 0.8 | -07.30 | O>A>B | 0.17 | 0.68 | 1.00 | 0.00 |
| Konyak | 0.23 | 0.44 | 0.32 | -09.17 | B>O>A | 0.47 | 0.50 | 1.00 | 0.00 |
| Zeliang | 0.15 | 0.15 | 0.70 | -08.07 | O>A =B | 1.59 | 0.20 | 1.00 | 0.00 |
| Sangtam | 0.28 | 0.28 | 0.44 | -05.75 | O>A =B | 0.42 | 0.51 | 0.63 | 0.33 |
| Phom | 0.42 | 0.18 | 0.40 | -07.62 | A>O>B | 0.02 | 0.90 | 1.00 | 0.00 |
The study populations used in blood groupings occurred in the order O> B >A > AB .The allele frequency of blood group O was the highest ABO allele p (A), q (B), r (O) as 0.16, 0.2 , 0.64, respectively. This occurred in the order O> B >A. The allele frequency of blood group O is the highest 𝜒2. The goodness of fit test was resulted in value was = 0.11 and p value was 0.73. The genotype frequencies are reached (D) = 99.0% and (d) = 1%, genotype frequencies are (D) = 0.99 and (d) = 0.01. There is the high proportion of Rh (D) +ve individuals than the Rh – ve in the study populations.
Table 3: Detailed list of all donors and their corresponding bio-data
| Sl No. | Name | Age | Sex | Blood Group | Tribe |
| 1 | Medou | 22 | F | O+ | Chakhesang |
| 2 | Awistoli | 22 | F | O+ | Sumi |
| 3 | Asenuo | 22 | F | O+ | Angami |
| 4 | Supenro | 19 | F | B+ | Lotha |
| 5 | Nyemang | 21 | F | O+ | Konyak |
| 6 | kilingna | 20 | F | O+ | Zeliang |
| 7 | Amy | 19 | F | A+ | Sumi |
| 8 | Woben | 21 | F | O+ | Lotha |
| 9 | Savinu | 21 | F | A+ | Angami |
| 10 | Wesly | 21 | F | O+ | Chakhesang |
| 11 | Kenlingunuuo | 19 | F | O+ | Sumi |
| 12 | Pelevituo-u | 24 | F | O+ | Angami |
| 13 | Mhasilenuo | 45 | F | O+ | Angami |
| 14 | paziini | 22 | F | B+ | Mao |
| 15 | A.moses | 22 | M | B+ | Mao |
| 16 | Amenla | 23 | F | A+ | Mao |
| 17 | Bethibra | 33 | F | B+ | Mao |
| 18 | Sentiro | 22 | F | A+ | Mao |
| 19 | Leshini | 30 | F | A+ | Mao |
| 20 | Kokhrolu | 24 | M | O+ | Mao |
| 21 | Eliveyi | 24 | M | O+ | Mao |
| 22 | Rokositi | 23 | M | O+ | Mao |
| 23 | Benlo | 24 | M | A+ | Mao |
| 24 | Savio | 45 | M | A+ | Angami |
| 25 | Itevika | 22 | M | O+ | Sumi |
| 26 | Manato | 21 | M | O+ | Sumi |
| 27 | S.sanmei | 23 | M | B+ | Angami |
| 28 | Khrilazo | 22 | M | O+ | Sumi |
| 29 | Savito | 22 | M | O+ | Sumi |
| 30 | Nyewe-u | 21 | F | O+ | Chakhesang |
| 31 | Julie | 19 | F | B+ | Chakhesang |
| 32 | Krecheni | 22 | F | O+ | Mao |
| 33 | Aniphro | 22 | F | A+ | Mao |
| 34 | Marini | 21 | F | O+ | Mao |
| 35 | Tsukhum | 22 | M | B+ | Mao |
| 36 | Fuchumlo | 22 | F | O+ | Lotha |
| 37 | Lutsu | 22 | F | O+ | Pochury |
| 38 | Asen | 22 | F | A+ | Ao |
| 39 | Atsu | 21 | F | O+ | Yimchunger |
| 40 | Hukai | 24 | M | O+ | Sumi |
| 41 | Asang | 49 | F | B+ | Ao |
| 42 | Kehosedel | 54 | M | O+ | Angami |
| 43 | Roko | 22 | M | B+ | Angami |
| 44 | Nieketouzo | 22 | M | O+ | Angami |
| 45 | Kenli | 23 | F | O+ | Angami |
| 46 | Alokeu | 24 | F | O+ | Lotha |
| 47 | Lanu | 25 | F | O+ | Sumi |
| 48 | Mhalevino | 22 | F | A+ | Sumi |
| 49 | Rencham0 | 22 | F | O+ | Ao |
| 50 | Vilasilie | 22 | M | B+ | Angami |
| 51 | Vileto | 24 | M | A+ | Angami |
| 52 | Nchumbeni | 21 | F | O+ | Angami |
| 53 | Adino | 25 | F | O+ | Muslim |
| 54 | Jabeda | 25 | F | A+ | Muslim |
| 55 | Yantsuntung | 26 | M | A+ | Lotha |
| 56 | Sai | 23 | M | O+ | Zeliang |
| 57 | Merlin | 2 | F | B+ | Pochury |
| 58 | Sentilemla | 24 | F | A+ | Ao |
| 59 | Akato | 25 | M | O+ | Suni |
| 60 | Kewe | 26 | M | O+ | Sumi |
| 61 | Mercy | 4 | F | O+ | Sumi |
| 62 | Manen | 22 | F | O+ | Sumi |
| 63 | Nally | 23 | M | A+ | Phom |
| 64 | Seyiesu | 24 | F | B+ | Zeliang |
| 65 | Waltrina | 25 | M | AB+ | Angami |
| 66 | Alona | 26 | F | A+ | Garo |
| 67 | Kivisu | 21 | M | O+ | Angami |
| 68 | Binlozu | 30 | F | B+ | Rengma |
| 69 | Keyiening | 32 | F | O+ | Zeliang |
| 70 | Vikeithozo | 23 | M | O+ | Angami |
| 71 | Vinoka | 22 | M | B+ | Sumi |
| 72 | Temjen | 22 | M | A+ | Ao |
| 73 | Wapang | 22 | M | AB+ | Ao |
| 74 | Yapani | 23 | F | B+ | Loyha |
| 75 | Nungsen | 23 | M | O+ | Ao |
| 76 | Sianglu | 23 | F | A+ | Zeliang |
| 77 | Esther | 23 | F | B+ | Konyak |
| 78 | Levilu | 22 | F | AB+ | Chakhesang |
| 79 | Lipok | 21 | M | AB+ | Ao |
| 80 | Lijingba | 30 | M | A- | Sangtam |
| 81 | Bishoka | 24 | F | O+ | Dimasa |
| 82 | Alemla | 23 | F | O+ | Ao |
| 83 | Aloto | 24 | M | A+ | Sumi |
| 84 | Vihuka | 23 | M | A+ | Sumi |
| 85 | Anoka | 21 | M | A+ | Sumi |
| 86 | Bokato | 25 | M | A+ | Sumi |
| 87 | Mercy | 23 | F | B+ | Konyak |
| 88 | Akok | 21 | M | A+ | Ao |
| 89 | Anengla | 22 | F | B+ | Ao |
| 90 | Sunglu | 22 | F | B+ | Ao |
| 91 | Mabeni | 24 | F | O+ | Lotha |
| 92 | Menibeni | 21 | F | A+ | Lotha |
| 93 | Alisong | 23 | M | O+ | Ao |
| 94 | Aka | 22 | M | B- | Ao |
| 95 | Easter | 24 | F | O+ | Sangtam |
| 96 | Kese | 23 | M | O+ | Angami |
| 97 | Even | 23 | M | B+ | Konyak |
| 98 | Juniya | 24 | F | B+ | Dimasa |
| 99 | Lily | 24 | F | O+ | Konyak |
| 100 | Hemsu | 23 | F | B+ | Khiamniungun |
| 101 | Asen | 22 | F | AB+ | Ao |
| 102 | Vili | 21 | M | A+ | Sumi |
| 103 | Velu | 21 | F | O+ | Chakhesang |
| 104 | Imti | 21 | M | A+ | Ao |
| 105 | Wati | 23 | M | B+ | Ao |
| 106 | Lanu | 23 | M | AB+ | Ao |
| 107 | Amsong | 23 | M | O+ | Ao |
| 108 | Tatong | 25 | M | B+ | Ao |
| 109 | Temjen | 22 | M | O+ | Ao |
| 110 | Akaba | 19 | M | O+ | Ao |
| 111 | Atubu | 22 | M | B+ | Ao |
| 112 | Sama | 21 | M | AB+ | Ao |
| 113 | Tia | 18 | M | O+ | Ao |
| 114 | Moa | 21 | M | B+ | Ao |
| 115 | Sunep | 22 | M | B+ | Ao |
| 116 | Tako | 23 | M | A+ | Ao |
| 117 | Sashi | 27 | M | O+ | Ao |
| 118 | Toshi | 45 | M | O+ | Ao |
| 119 | Yinu | 43 | M | B+ | Ao |
| 120 | Melekho | 22 | M | O+ | Chakhesang |
| 121 | Vekho | 22 | M | B+ | Chakhesang |
| 122 | Veto | 22 | M | O+ | Chakhesang |
| 123 | Vethi | 22 | M | A+ | Chakhesang |
| 124 | Achi | 22 | M | A+ | Chakhesang |
| 125 | Akho | 21 | M | A+ | Chakhesang |
| 126 | Ato | 21 | M | B+ | Chakhesang |
| 127 | Khoto | 24 | M | B+ | Chakhesang |
| 128 | Khrupu | 25 | M | O+ | Chakhesang |
| 129 | Khruhu | 25 | M | B+ | Chakhesang |
| 130 | Shehu | 23 | M | B+ | Chakhesang |
| 131 | Michivo | 24 | M | A+ | Chakhesang |
| 132 | Vechipo | 21 | M | B+ | Chakhesang |
| 133 | Kuvezo | 24 | M | AB+ | Chakhesang |
| 134 | Vebuzo | 42 | M | AB+ | Chakhesang |
| 135 | Vemucho | 33 | M | B+ | Chakhesang |
| 136 | Khoshe | 31 | M | O+ | Chakhesang |
| 137 | Zhosheku | 31 | M | O+ | Chakhesang |
| 138 | Vepopu | 31 | M | O+ | Chakhesang |
| 139 | Popo | 34 | M | O+ | Chakhesang |
| 140 | Alepu | 22 | M | B+ | Chakhesang |
| 141 | Aku | 22 | M | O+ | Chakhesang |
| 142 | Khrope | 22 | M | B+ | Chakhesang |
| 143 | Atalu | 34 | F | B+ | Chakhesang |
| 144 | Asulu | 32 | F | O+ | Chakhesang |
| 145 | Avelu | 23 | F | B+ | Chakhesang |
| 146 | Shelu | 21 | F | B+ | Chakhesang |
| 147 | Khrulu | 22 | F | O+ | Chakhesang |
| 148 | Khotalu | 22 | F | B+ | Chakhesang |
| 149 | Abi | 23 | F | O+ | Chakhesang |
| 150 | Atho | 32 | F | B+ | Chakhesang |
| 151 | Vebunielu | 34 | F | AB+ | Chakhesang |
| 152 | Shetolu | 24 | F | A+ | Chakhesang |
| 153 | Shekhrulu | 43 | F | A+ | Chakhesang |
| 154 | Tsinolu | 23 | F | B+ | Chakhesang |
| 155 | Vetholu | 21 | F | B+ | Chakhesang |
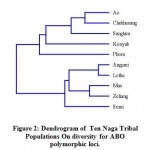 |
Figure 2: Dendrogram of Ten Naga Tribal populations on diversity for ABO polymorphic loci |
The Neighbour Joining Analyses
Population relationships can be easily represented by Neighbor Joining (NJ) trees. To study the genomic affinities of the tribal populations of Nagalnd, NJ trees was constructed by using various reported investigations in the tribes of India and globally by means of same set of loci/alleles. In the first NJ tree analysis, given in Fig.2. ABO blood polymorphic loci alleles are used to construct the tree to find the genomic affinities among the tribal populations of Nagaland under study Interestingly, this tree showed that Mao are clustered with Sumi who are geographically distant from Mao instead of Zeliang, who are thought as same to Sumi,Angami and Lotha. Another surprising genetic relation was established between Ao and Chekesang , though both are geographically very far-off. Overall, this tree showed that the Naga tribes under consideration are interrelated and equally distant from each other in terms of ABO blood allele frequencies.
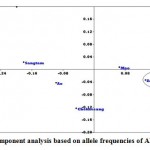 |
Figure 3: Principal component analysis based on allele frequencies of ABO polymorphic loci Principal Component Analysis |
Principal component analyses (PCA) was performed to identify possible clustering among the populations. In the PCA (Figure.3.) using ABO blood, the populations Zeliang, Lotha and Angami are observed to be falling under a single cluster among the populations.
Human shares the same blood group systems, differing only in the frequencies of specific types. The incidence of ABO, Rh and MN groups varies in different parts of the world and in different races [10]. Geographical and ethnic groups and socioeconomic groups, [11- 12]. Many studies have revealed possible associations of various diseases with the ABO blood group, but the reasons for such associations are remain controversial[13-14]. With Blood group O has a greater incidence of association with hypertension[15] and melanoma[12]. As far as abortion is concerned, it is found to be higher in between A type husband and O type wife and high in couples with combination of A type husband and B type wife. The frequencies of Rh positive and Rh-negative individuals are 96.5% and 3.5% respectively[16]. ABO blood groups are important in determining migration of races and in hereditary diseases. [17]. Some diseases are more common to develop in certain blood groups; hence the relationship of different blood groups with diseases is important [18].
The genomic affinities among eleven study populations are represented in Fig2 & 3, using allele frequency data of four loci by a standard NJ tree and Principal component analysis. It has been that all student groups are genetically related to each other, to asses genomic affinities of the ten study populations, the data from the results of presents study groups are assured together and represented in an others NJ tree and Principal component analysis (Fig.2 &
Conclusion
In conclusion, based on ABO blood group poylmpohsms the Naga tribes have genetic roots with others Indian population. Studieds association of ABO blood group polymorphism and disease prevalence in populations of India need to be established using molecular markers, such as nDNA, mtDNA etc. Which right clear the picture in the human biography of the Indian subcontinent
References
- Chandra T, Gupta A (2012). Prevalence of ABO and Rhesus Blood Groups in Northern India. J Blood Disorders Transf 3:132. doi:10.4172/2155- 9864.1000132
- Bahaj AA (2003). ABO and rhesus blood groups distribution in Hadhramout population. Hadh Studies and Res 4: 2-7.
- Tomilin VV, Gurtovaia SV (1999) The incidence of finding ABO system antigens in the population of the Russian Federation. Sud Med Ekspert 42: 16-18.
- Bashwari LA, Al-Mulhim AA, Ahmad MS, Ahmed MA (2001) Frequency of ABO blood groups in the Eastern region of Saudi Arabia. Saudi Med J 22: 1008- 1012.
- Das PK, Nair SC, Harris VK, Rose D, Mammen JJ, et al. (2001) Distribution of ABO and Rh-D blood groups among blood donors in a tertiary care centre in South India. Trop Doct 31: 47-48.
- Periyavan S, Sangeetha SK, Marimuthu P, Manjunath BK, Seema DM (2010) Distribution of ABO and Rhesus-D blood groups in and around Bangalore. Asian J Transfus Sci 4: 41.
- Khan MN, Khaliq I, Bakhsh A, Akhtar MS, Amin-ud-Din M (2009) Distribution of ABO and Rh D blood groups in the population of Poonch District, Azad Jammu and Kashmir. East Mediterr Health J 15: 717-721.
- Omotade OO, Adeyemo AA, Kayode CM, Falade SL, Ikpeme S (1999) Gene frequencies of ABO and Rh (D) blood group alleles in a healthy infant population in Ibadan, Nigeria. West Afr J Med 18: 294-297.
- Pedro J.N. Silva (2002)” Allele frequency estimation in the human ABO blood group system”http://alfl.cii.fc.ul.pt/¬pedro/Soft/ABOestimator/.
- Khattak I.D., T.M. Khan, P. Khan, S.M. Ali Shah, T. Khattak, & A. Ali. Frequency of ABO and Rhesus blood groups in District Swat, Pakistan. Journal of Ayub Medical College Abbotabad 2008; 20(4): 127-129.
- Beardmore A . J and .Karimi-Booshehri F, “ABO genes are differentially distributed in socio-economic groups in England,”Nature, 1983; 303(5917): 522–524.
- Karakousis,.C.P. Evlogimenos .E, and O. Sun .O, “Blood groups andmalignant melanoma,” Journal of Surgical Oncology, 1986; 33(1): 24–26
- Daniels G 2002 Human Blood Groups. 2nd Edition.Oxford: Blackwell Science
- Reid ME, Bird GW. Associations between human red cell blood group antigens and disease. Transfusion Medicine Reviews, 1990; 4: 47–55.
- Maninder Kaur “Association between ABO Blood Group and Hypertension among Postmenopausal Females of North India” Anthropologist, 2014; 17(2): 677-680.
- Pradeep Kumar, Vivek Kumar Singh and Vandana Rai “Study of ABO and Rh(D) Blood Groups in Kshatriya (Rajput) of Jaunpur District, Uttar Pradesh” Anthropologist, 2009; 11(4): 303-304.
- Alam M. ABO and Rhesus blood groups in potential blood donors at Skardu (Northern Areas). Pak J Pathol. 2005; 16: 94–97.
- Majeed T, Hayee A. Prevalence of ABO blood group and sub groups in Lahore, Punjab (Pakistan). Biomedica. 2002; 18: 11–15.
Accepted on: 23-Sep-19
Second Review by: Yaiphaba Sanjenbam Meitei


![]()
![]()
