
Proteomic Analysis of GA3-Induced Berry Elongation in Grape (Vitis Vinifera L.) Cultivar Thompson Seedless
 , Anuradha Upadhyay* and Satisha Jogaiah
 ICAR-National Research Centre for Grapes, Solapur Road, Pune, Maharashtra 412307, India.
Corresponding Author E-mail: anuradha.upadhyay@icar.gov.in
DOI : http://dx.doi.org/10.13005/bbra/2724
Download this article as:
![]()
GA3 is a commonly used plant growth hormone for berry elongation in grapes. However, the basic molecular mechanism behind GA3 mediated berry-sizing is unclear. In current study, bunches of Thompson Seedless (Vitis vinifera L.) were sprayed with 25 ppm GA3 at 3-4 mm berry stage and berry samples were harvested at 6 h, 24 h, and 48 h after application. Among the detected 1935 proteins, 129 proteins were successfully identified with significant abundance at least one application time point. These proteins were assigned to carbohydrate metabolism, primary amino acid metabolism, photosynthesis related proteins, citric acid cycle, phenylpropanoid, and defense related pathways. Consequently, current study offers the identification of GA3 responsive proteins at berry stage and assesses the time course of proteome modulation during berry elongation by using proteomic approach.
KEYWORDS:Berry Elongation; Grape; Gibberellic Acid; Proteome Analysis
Introduction
Grapes are one of the most important fruit species in the world. India is among the first ten countries in the world with the production of 2590000 MT of fresh grape in 2016 (FAOSTAT 2018). Thompson Seedless is the most widely cultivated white table grape variety in India which is utilized for both local and international export purposes. However, its berry size is small which reduces its market potential. Therefore this variety needs chemical and mechanical treatments to produce bold and large berry with premium quality grapes for export. Manual thinning is time consuming and laborious and increases the cost of production. The plant hormones such as gibberellic acid (GA3) which have effects on berry growth are used for berry enlargement.1 Several applications of gibberellins (GA3) are given at flowering and different stages of cluster development to produce loose clusters with bold sized berries.
Berry growth is stimulated due to increase in rate of cell division as well as cell elongation.1 Plant hormones have strong effects on berry growth and development2 among them, GAs take part in a critical function in berry sizing and enlargement.3 In the last few years, the effect of exogenous GA3 application on grape berry growth and cell enlargement has been studied by several workers, however, the basic mode of action of GA3 to produce maximum berry size is not very clear. In seedless varieties, GA3 application is reported to cause the increased cell size by accumulating greater amounts of water and sugar without affecting berries pressure potential,4 by triggering the cell enlargement and decreased cell density, reduced thickness of the berry skin which resulted in berry enlargement.5 Proteomic study suggested that redox homeostasis plays an important role in GA3 mediated seedless berry enlargement.6 Transcriptome analyses have also revealed the effect of GA3 treatment on berry development stages.7,8 RNAseq analysis revealed the differential expressed gene profile related to vital berry developmental process such as cellular metabolism, biosynthesis of different metabolites, stress response, transport, etc.9 In this report, we performed whole proteome analysis of GA3 treated berries sampled at different time points to understand the GA3 mediated changes at proteome level leading to berry enlargement.
Materials and Method
Plant Material and Treatment Details
Thompson Seedless grapevines grafted on Dogridge rootstock were selected for the study. Grape bunches with 3-4 mm berry size were treated with 25 ppm solution of GA3 by manually dipping the bunches in GA3 solution. Control bunches were treated with water. Samples from both treated and control bunches were collected at 6, 24 and 48 hours after treatment (HAT). The collected samples were snap frozen in liquid nitrogen and stored at -80°C until use. Three biological replicates, each consisting of a single bunch, were used for analysis at each time point.
Observations on Berry Parameters
Seven randomly selected bunches each from control and treated vines were used for measuring berry parameters at harvest. Berry diameter and berry length were measured by metric scale, whereas 100 berry weight was measured using precision electronic balance. The data was analysed using statistical software SAS9.3 (SAS Inc., USA).
Protein extraction and sample preparation for Mass Spectrometry
The total proteins were extracted as described by Jogaiah, et al.10 Protein content was determined using Bradford method11 with bovine serum albumin as standard.
In solution digestion of proteins was performed as follows. The 50 µL of (1µg/µl) solubilized proteins were heated at 80°C for 10 min. Solubilized proteins were reduced by addition of 5 µl of 100mM DTT (Dithiothritol) and incubated at 60°C for 15 mins. After cooling, reduced samples were alkylated by addition of 2 µL of 200mM iodoacetamide and incubated at RT in the dark for 30 min. For digestion, to each sample 2 µL of 0.1µg/µL trypsin was added and incubated for overnight at 37°C and trypsin was inactivated by adding 1µLformic acid. Each sample was desalted on C18 Ziptips followed by lyophilisation. The samples were reconstituted with 3% (v/v) acetonitrile containing 0.1% (v/v) formic acid.
LC-MS Analysis and Protein Quantification
The digested peptide samples were analyzed by LC-MSE workflow on a NanoAcquity ultra performance liquid chromatography (UPLC) system combined with a SYNAPT-G1 high definition mass spectrometer (Waters, USA). Nano-(LC-MSE) peptide separation was performed as described by.12 The trypsin digested protein samples were spiked with internal standard – yeast enolase (P00924) digest and desalted online using C18 trapping column with 0.1% B mobile phase. After trapping, chromatographic separation of the peptides was performed at a flow rate of 0.25µL/min of solvent B gradient from 3% to 35% in solvent A over120 min on bridged-ethyl hybrid C18 analytical reversed phase column. The mobile phases contained of phase A (0.1% (v/v) formic acid in water) and phase B (0.1% in acetonitrile).Before data acquisition, the lock mass correction and mass spectrometer calibration was carried out with the MS/MS spectra of Glu-fibrinopeptide B (m/z 785.8426).
For label-free quantitation and statistical analysis, the raw data-independent acquisition (DIA) LC-MS E data were exported to Progenesis QI for Proteomics software (Nonlinear Dynamics, UK). It aligns all detected features among all runs, and determined their abundance, followed by data normalization. Protein identifications were done by searching against the Uniprot KB reference database for Vitis vinifera L. The default settings of Progenesis QI were used for protein detection and identification. A confidence level of ≥95% and false discovery rate (FDR) of 5% was used to identify the differentially abundant proteins in pairwise analysis by Progenesis QI software.
Data Analysis of Differential Abundant Proteins (DAPs)
To get a deeper understanding of the molecular functions and biological processes involved in berry elongation after GA3 treatment, Gene Ontology (GO) analysis of DAPs were performed using Blast 2GO13 and GO enrichment analysis was carried out using PANTHER.14 Software Map Man15 was used for pathway analysis.
Result and Discussion
Effect of GA3 Application on Berry Parameters
The berry parameters viz. berry diameter, berry length and berry weight were significantly affected by GA3 application. The berry diameter of control and treated samples was 13.14 and 15.84 mm respectively (Figure 1). Similarly, berry length was 13.92 and 18.24 mm respectively for control and treated vines. 100 Berry weight for control vines was 128.18 g as compared to 211.16 g in treated vines. GA3 is extensively used to increase the berry size in seedless grapes. These results are in accordance with earlier reports on Crimson Seedless 1, Emperatriz 4, Niagra Rosada 2 and several other grape varieties.
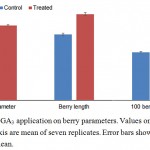 |
Figure 1: Effect of GA3 application on berry parameters. Values on Primary and secondary Y axis are mean of seven replicates. Error bars show standard error of mean.
|
Protein Identification
By high-throughput label-free quantitative proteomics analysis, a total of 1935 proteins were successfully identified across all the samples. Of these, 129 proteins had significant differential abundance (p ≤ 0.05, ≥1.5-fold change) in GA3 treated berries at three time points of GA3. Among the differentially abundant proteins (DAPs), 69, 75 and 66 proteins were respectively affected at 6 HAT (hours after treatment), 24 HAT and 48 HAT (Figure 2). Among the 69 DAPs at 6 h, 30 were significantly over-accumulated and 39 were suppressed, whereas at 24 h the abundance of only 5 out of 75 DAPs was increased and remaining 70 were suppressed. 33 proteins were each over-accumulated and suppressed at 48 HAT.
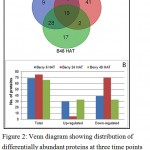 |
Figure 2: Venn diagram showing distribution of differentially abundant proteins at three time points (A) and bar chart depicting up and down accumulated proteins at three time points (B).
|
Functional Categorization and Cluster Analysis of DAPs
Gene ontology analysis placed DAPs in three functional categories viz. biological process, functional and cell component. In biological process category, a high number of proteins participated in metabolic process (51), cellular process (39), response to stimulus (14), cellular component organization or biogenesis (9), localization (9), biological regulation (7), reproduction (1) and, developmental process (1) (Figure 3A). In molecular function category, 53 proteins were involved in catalytic activity (24), structural molecule activity (10), transporter activity (6), translation regulator activity) (3), receptor activity (3), antioxidant activity (2) and signal transducer activity (1) (Figure 3B). Cell part (46), organelle (33), macromolecular complex (23), membrane (13) and cell junction (4) were the majority categories related to cellular components (Figure 3C). DAPs were also classified as into different protein classes viz. nucleic acid binding (18), oxidoreductase (12), transferase (11), hydrolase (9), transporter (6). A minor, but important proteins involved in other protein classes such as cytoskeleton protein (5), lyase (5), and transcription factor (2), were also detected (Figure 4).
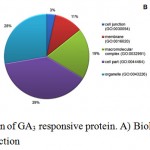 |
Figure 3: Functional categorization of GA3 responsive protein. A) Biological process B) Cellular process C) Molecular function.
|
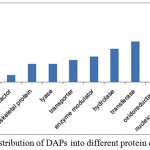 |
Figure 4: Distribution of differentially abundant proteins into different protein classes.
|
Pathway Analysis of DAPs
We identified a complex response from various interconnected biochemical pathways including carbohydrate metabolism, primary amino acid metabolism, photosynthesis related proteins, citric acid cycle, phenylpropanoid pathway, and defense related proteins during berry sizing effect in response to GA3. The distribution of DAPs among different pathways and important sub-pathways is given in table 1.
Table 1: Distribution of DAPs among different pathways.
| Sr. No | Major Pathways | No. of proteins | Sub pathways | No. of proteins |
| 1 | Metabolism | 63 | Protein metabolism and modification | 19 |
| 2 | Response to stimulus | 7 | Energy metabolism | 10 |
| 3 | Cellular process | 6 | Carbohydrate metabolism | 8 |
| 4 | Signalling | 4 | Amino acid metabolism | 7 |
| 5 | Transport | 4 | Phenylpropanoid metabolism | 6 |
| 6 | Regulation overview | 3 | Cellular component organization and biogenesis | 5 |
| 7 | Diverse functions | 1 | ||
| 8 | Unknown | 41 |
The major processes modified during berry elongation was protein metabolism including chaperone-mediated protein folding, proteolysis and transport and several proteins involved in these processes were differentially expressed after GA3 application and showed varied expression at three time points. Several proteins involved in energy metabolism such as enzymes 2, 3-bisphosphoglycerate-independent mutase, phosphomannomutase, NADH dehydrogenase (ubiquinone) 1 alpha subcomplex 9 were over-accumulated at 6 HAT and 48 HAT but were declined at 24 HAT (Figure 5). Levels of some enzymes such as Phosphopyruvate hydratase, NADP-dependent glyceraldehyde-3-phosphate dehydrogenase, beta-galactosidase, mannose-1-phosphate guanyltransferase, fumarate hydratase, ubiquinol-cytochrome c reductase, and ribulose bisphosphate carboxylase/oxygenase activase, declined at all the stages after GA3 application. Several proteins from the amino acid metabolism such as aminotransferase, adenosyl homocysteinase 1, NADH glutamate dehydrogenase, and S-adenosylmethionine synthetase 1 were downregulated at all stages while acetylglutamate kinase was upregulated. Further, proteins induced by abiotic stress such as delta-tonoplast intrinsic protein (TMP) were up-regulated at all the stages and aquaporin TMP-C was up-regulated at 6 HAT while reduced in remaining stages (Figure 5). Analysis further revealed that the majority of proteins involved in phenylpropanoid metabolism including two chalcone synthase, chalcone-flavanone isomerase, and phenylalanine ammonia-lyase showed down-regulation at all three time points after GA3 application. Some proteins involved in regulation of gene expression such as cell division cycle 20-like protein 1, argonaute protein, and RNA-binding protein Musashi were identified. Serine/threonine-protein kinase is a receptor protein kinase active component in signaling pathway which was downregulated at all stages. Some of the proteins from reactive oxygen species (ROS) generation such as catalase, peroxidase 12, and two glutaredoxin were also identified. Catalase and glutaredoxin were down-regulated at 24HAT and peroxidase showed significant over-accumulation at 6 HAT. Additionally, heat shock protein (HSP) such as two HSP70 and HSP90 showed significant upregulation at 48 HAT and other HSP70 revealed downregulation at all stages (Figure 5). Proteins related to cell wall modification such as pectinesterase showed significant downregulation at 24 HAT while exopolygalacturonase showed significant downregulation at all the stages after GA3 application. Microtubule associated protein (MAP65-1a) associated with cytoskeleton biogenesis was significant downregulated particularly, at 24 HAT.
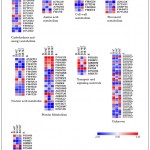 |
Figure 5: Heat map of 129 differentially abundant proteins according to their pathway distribution.
|
Several approaches such as MALDI-TOF/TOF-MS analysis in Centennial Seedless,6 next-generation sequencing in Summer Black16 and Thompson Seedless 8 have been used to understand the berry sizing effect of GA3 in grape. In current study, we explored the effects of GA3 on the whole proteome of berry in Thompson Seedless using label-free proteomics analysis for the first time. In current study, GA3 application resulted in increased level of peroxidase enzyme at 6 HAT and suppressed the level of catalase and glutaredoxin at 24 HAT.GA3 mediated berry enlargement in grape has been proposed to be controlled by expression of antioxidant enzyme such as catalase, peroxidase, etc.16. They also observed significant up-regulation of peroxidase in berry development stage of I and II in seedless grape berry treated with 30 ppm GA3. Similarly, in rice, treatment of germinated seeds with 5 μM GA3 resulted an increased activity of catalase.17 Several studies have reported that the enhanced production of reactive oxygen species (ROS) in the cell walls can assist wall-loosening and cell elongation.16,17 Antioxidant enzymes play vital role in monitoring level of ROS in plant. So, it is not unanticipated that the expression of antioxidant enzymes was modulated in response to GA3 application. Pectinesterase is vital cell wall associated enzyme which actively takes part in plant developmental process such as cellular adhesion and stem elongation.18 This enzyme catalyzes the degradation of pectin, which is an essential component of the plant cell wall. Expression of pectinesterase is directly proportional to the cell elongation in plant. Derbyshire, et al.19 concluded that the active cell elongation is associated with a higher average level of pectin esterification during hypocotyl elongation after application of 1 μM GA4 to seed in Arabidopsis thaliana. Heat shock proteins also called as chaperon are crucial for protein folding, and expressed by cell in response to adverse environmental and stress conditions such as cold, heat, exposure of chemical and plant growth hormones drought, and salinity.20 Heat shock protein maintains cellular homeostasis during various stresses through re-modulating protein conformation.21 In our study, two HSP70 and HSP90 were upregulated at 48 HAT and another HSP70 was down-regulated at all stages. This is in accordance with Wang, et al.17 who reported increased expression of chaperone proteins in response to application GA3. They also suggested that the GA3 improved the potential capacity of protein stability and stress response.
Conclusion
Our study presents a comprehensive analysis of grape berry sizing effect in response to application of exogenous GA3. Application of GA3 significantly improved the berry length and diameter. The expression of several proteins involved in cell wall modification was altered after GA3 application indicating their active role in GA3 mediated berry sizing effect. A large number of proteins were over accumulated during early stage of GA3 application followed by downregulation at late stage. Large subsets of proteins mainly participating in multiple branches of primary metabolism were down-regulated at 24 HAT. Such differential response at different time points suggests that GA3 application has both immediate and gradual effects on berry thus triggering a cascade of cell metabolism changes to bring about the desired effect on berry shape and size.
Acknowledgements
This work was partially carried out under a project funded by Department of Biotechnology, Government of India, New Delhi with the grant no. BT/PR4856/PBD/16/967/2012. Authors also thank Dr N.Y. Kadoo for providing instrumentation facilities for proteomic analysis.
Conflict of interest
There is no conflict of interest.
Funding Source
Department of Biotechnology, Government of India, New Delhi.
References
- Dokoozlian N. K., Peacock W. L. Gibberellic acid applied at bloom reduces fruit set and improves size of ‘Crimson Seedless’ table grapes. Hort. Science. 2001;36:706-709.
CrossRef - Guerios I. T., Chiarotti F., Cuquel F. L., Biasi L. A. Growth regulators improve bunch and berry characteristics in ‘Niagara Rosada’ grape. Acta Horticulturae. 2016;1115:243-248.
CrossRef - Weaver R. J., McCune S. B. Further studies with gibberellin on Vitis vinifera grapes. Botanical Gazette. 1960;121:155-162.
CrossRef - Casanova L., Casanova R., Moret A., Agustí M. The application of gibberellic acid increases berry size of “Emperatriz” seedless grape. Spanish Journal of Agricultural Research. 2009;7:919-927.
CrossRef - Ben-Arie R., Sarig P., Cohen-Ahdut Y., Zutkhi Y., Sonego L., Kapulonov T., Lisker N. CPPU and GA3 effects on pre- and post-harvest quality of seedless and seeded grapes. Acta Horticulturae. 1998;463:349-358.
CrossRef - Wang Z., Zhao F., Zhao X., Ge H., Chai L., Chen S., Perl A., Ma H. Proteomic analysis of berry‐sizing effect of GA3 on seedless Vitis vinifera L. Proteomics. 2012;12:86-94.
CrossRef - Serrano A., Espinoza C., Armijo G., Inostroza-Blancheteau C., Poblete E., Meyer-Regueiro C., Arce A., Parada F., Santibanez C., Arce-Johnson P. Omics approaches for understanding grapevine berry development: regulatory networks associated with endogenous processes and environmental responses. Frontiers in Plant Sciences. 2017;8:1486.
CrossRef - Upadhyay A., Maske S., Jogaiah S., Kadoo N. Y., Gupta V. S. GA3 application in grapes (Vitis vinifera L.) modulates different sets of genes at cluster emergence, full bloom and berry stage as revealed by RNA sequence-based transcriptome analysis. Functional & Integrative Genomics. 2018;18:439-455.
CrossRef - Cheng C., Xu X., Singer S. D., Li J., Zhang H., Gao M., Wang L., Song J., Wang X. Effect of GA3 treatment on seed development and seed-related gene expression in grape. PloS One. 2013;8:80044.
CrossRef - Jogaiah S., Upadhyay A., Maske S. R., Shinde M. P. A protocol for protein extraction from recalcitrant tissues of grapevine (Vitis vinifera L.) for proteome analysis. Indian Journal of Biotechnology. 2015;14:532-539.
- Bradford M. M. A rapid and sensitive method for the quantitation of microgram quantities of protein utilizing the principle of protein-dye binding. Analytical Biochemistry. 1976;72:248-254.
CrossRef - Kumar Y., Zhang L., Panigrahi P., Dholakia B. B., Dewangan V., Chavan S. G., Kunjir S. M., Wu X., Li N., Rajmohanan P. R., Kadoo N. Y., Giri A. P., Tang H., Gupta V. S. Fusarium oxysporum mediates systems metabolic reprogramming of chickpea roots as revealed by a combination of proteomics and metabolomics. Plant Biotechnology Journal. 2016;14:1589-1603.
CrossRef - Conesa A., Gotz S. Blast 2GO: A comprehensive suite for functional analysis in plant genomics. International Journal of Plant Genomics. 2008;2008:619832.
- Mi H., Huang X., Muruganujan A., Tang H., Mills C., Kang D., Thomas P. D. PANTHER version 11: expanded annotation data from Gene Ontology and Reactome pathways, and data analysis tool enhancements. Nucleic Acids Research. 2017;45:183-189.
CrossRef - Thimm O., Blasing O., Gibon Y., Nagel A., Meyer S., Kruger P., Selbig J., Muller L. A., Rhee S. Y., Stitt M. MAPMAN: a user-driven tool to display genomics data sets onto diagrams of metabolic pathways and other biological processes. The Plant Journal. 2004;37:914-939.
CrossRef - Wang X., Zhao M., Wu W., Korir N. K., Qian Y., Wang Z. Comparative transcriptome analysis of berry-sizing effects of gibberellin (GA3) on seedless Vitis vinifera L. Genes & Genomics. 2017;39:493-507.
CrossRef - Wang X., Han F., Yang M., Yang P., Shen S. Exploring the response of rice (Oryza sativa) leaf to gibberellins: a proteomic strategy. Rice. 2013;6:17.
CrossRef - Micheli F. Pectin methylesterases: cell wall enzymes with important roles in plant physiology. Trends in Plant Science. 2001;6:414-419.
CrossRef - Derbyshire P., McCann M. C., Roberts K. Restricted cell elongation in Arabidopsis hypocotyls is associated with a reduced average pectin esterification level. BMC Plant Biology. 2007;7:31.
CrossRef - Park C. J., Seo Y. S. Heat Shock Proteins: A Review of the Molecular Chaperones for Plant Immunity. The Plant Pathology Journal. 2015;31:323-333.
CrossRef - Wang W., Vinocur B., Shoseyov O., Altman A. Role of plant heat-shock proteins and molecular chaperones in the abiotic stress response. Trends in Plant Science. 2004;9:244-252.
CrossRef
Accepted on: 3-Jan-2019


![]()
![]()
