
Determination of Aflatoxin Contamination in Various Spices
1Department of Microbiology, Vivekananda College of Arts and Sciences for Women, Tiruchengode India.
2Department of Microbiology , Bharathidasan University, Tiruchirapalli India.
Corresponding Author E-mail: moormicro@gmail.com
Download this article as:
![]()
A total of 16 various types of 48 spices were collected from 3 different districts, such as Namakkal, Erode and Karur. All spices were subjected to isolation of abundance of Aspergillus flavus. The highest abundance was observed in Anise (41.61) and lowest in Black Cumin (1.33%). Among the three district, high occurrence was observed in Karur (13.6%) followed by Namakkal (11.47%) and Erode (7.90%). All samples were subject to physiochemical analysis such as moisture and pH analysis. The Acorus samples had highest moisture content 12.99% and second most clove (12.21%). In all the samples, the pH ranged from 3.5-6.8 pH. Among the 16 samples highest pH observed in dry ginger (6.14). Second part of the present study was isolation of aflatoxigenic fungi (A. flavus), among 16 samples chebulic myrobalan and clove not detected any aflatoxins B1and B2. From remaining 14 samples, the toxin ranges were 13.60 to 167.2ppb. The highest aflatoxins were detected in black pepper III (167.20ppb). Furtherly antifungal activity of essential oils against aflatoxigenic fungi (A. flavus) was done. Out of 4 essential oils, clove oil was significantly inhibited the growth of A. flavus than the other three oils. This study facilitated useful information about the risk of aflatoxin hazard and hopes to raise the consciousness among consumers, researchers, farmers and traders about the importance to risk of aflatoxin, aflatoxigenic A. flavus and their control.
KEYWORDS:Aspergillus flavus; Spices; Aflatoxin; Essential oil; Antifungal activity
Introduction
Spices, aromatic vegetable product used as a flavoring or condiment, normally refer to the derivatives from certain herbs like seeds, leaves, bark and roots etc. They are used mainly for enhancing taste of the food. The name of spice is derived from the word species, which was applied to groups of exotic foodstuffs in the middle ages. Spices are products derived from different parts of various plants and are usually contaminated with fungi. However the small amount of species is seen in foods, they are considered as important microbial carriers which are responsible for microbial contamination due to the grown, harvested and processed conditions. Since the presence of fungi in spices, i.e., foods containing spices has been associated with formation of noxious odors and other adverse effects including the increased risk for mycotoxin formation under favorable conditions. The predominant contaminants of species are fungi, which are observed as commensal on plants of survived drying and storage. Soil and air is the main inoculum source for causing contamination in crude spices in field. Other practices such, as harvesting, handling and packing cause additional contamination. The spices are collected in tropical areas by simple methods and are commonly exposed to many contaminants before, being dry enough to prevent microbial growth (Mandeel., 2005). Fungi are a normal component of food microflora and may be responsible for spoilage and production of mycotoxins (Aziz et al. 1998 and Chourasia1995).
Mycotoxins are toxic metabolites produced by some species of mould genera such as Aspergillus, Penicillium and Fusarium (Akiyama et al. 2001). Aflatoxin which is a potent carcinogen produced mainly by secondary metabolism of A. flavus. Aflatoxin producing Aspergillus spp. may proliferate on spice samples if favorable environments for growth are provided resulting in production of aflatoxins. Changing the ingredient composition of spices such as curry powder could provide a solution to overcome the storage problem of spices (Grybauskas et al. 1988). Natural compounds from plants have been traditionally to preserve foods in countries like Japan, India and Russia. The extracts some plants show the ability to suppress the growth of toxigenic fungi and hence, toxin production in synthetic media. Plant-produced compounds are becoming of interest as a source of safer and more effective substances than synthetically produced antimicrobial agents. Many essential oils have also been reported as effective inhibitors of fungal growth and aflatoxin production Oils obtained from higher plant parts have been shown to contain antitoxigenic properties. Several studies are available for aflatoxin levels in different food types, limited studies are done on aflatoxins in spices. Therefore, this study was aimed to determine aflatoxin levels in different types of spices which are consumed to a great extend at indian kitchen especially South India.
Materials and Methods
Sixteen types of spices sample were collected from three locations namely Karur, Namakkal and Erode from December 2009 to January 2010. All Samples were collected in sterile polythene and brought to Laboratory for mycoflora analysis. Determination of Moisture Estimation (Alam et al. 2001). A moisture dish of appropriate size was weighed accurately. 10gms of the sample was added and reweighed. The container was placed in a hot air oven at 120ºC for approximately 2 hours. The dish was removed from the oven, covered, cooled in desiccators and weighed.
(P-A)
P = weight in gram of sample
A = weight in gram dried sample
Estimation of pH (Mandeel, 2005)
In preparation for the assay, each spices and herbal drug sample was mixed while in the bag and the required amount weighed for measurement of pH, 1:10 ratio distilled water suspension was prepared and stirred for 24 hours in 200 ml beaker. Each sample was analyzed in triplicate. The pH of the suspension was measured using a digital pH meter.
Enumeration of Fungal Colonies (Mandeel, 2005)
Nine ml of distilled water was taken in the test tubes and sterilized at 121ºC for 15minutes. After cooling one gram of finely powdered samples was added to the first tubes with 9ml distilled water which is 10-1 dilution and mixed well. From this one ml of the sample is serially transferred into another test tube containing 9ml of distilled water which is 10-2 dilution. Sabouraud’s Dextrose Agar (SDA MICRO-EXPRESS) was prepared and sterilized by autoclaving at 121ºC for 15 minutes and allowed to cool to 50ºC and poured into sterile Petridishes. For culturing 0.1ml was pipetted onto the surface of petri plates containing the Sabouraud’s Dextrose Agar and spreaded with the help of L-rod. The Petri plates were incubated at 25ºCfor 5 to 7 days. All colonies were counted and multiplied by the dilution factor (100) to calculate Colony Forming Unit (CFU) for per gram of spices and herbal drugs. After incubation period isolated colonies were subjected into macroscopic and microscopic observation. Microscopic observation carried with Lactophenol Cotton Blue (LCB) method. The fungi were confirmed with standard laboratory manual.
Identification of toxigenic and non – toxigenic Aspergillus flavus
An inoculum with a loopful of the spores of each A. flavus isolate was placed at the center of the dish containing the media with 0.3% of pharmaceutical- grade of β- cyclodextrin and incubated at 30ºC for 10 days after incubation, the presence or absence of fluorescence in the agar surrounding the colonies assayed and determined under UV radiation (365nm) and expressed as positive or negative.
Thin layer chromatography for detection of aflatoxin (AOAC, 1984)
Separation of Extract
Forty ml of distilled water was added to 10g of the ground spices sample and mixed for 2 minutes in the Mixie. 60ml of acetone was added and again mixed it for 2 minutes. The contents were filtered. The 30 ml of the filterate and approximately 0.6g of cupric carbonate was added in beaker (A). In another beaker (B), 34ml of 0.2M NaOH and 6ml of FeCl3 (0.41M) were added and the contents were swirled. The content of beaker (B) was added to beaker (A) and was mixed it slowly by swirling movements. The contents were filtered through Whattman No. 1 filter paper.
Forty ml of the filtrate was taken in a 250ml separating funnel and 40ml of (0.03%) H2SO4 and 10ml of chloroform were added and mixed it slowly. The chloroform layer was collected in a 100ml beaker, added again 10ml of chloroform and mixed thoroughly and allowed it to settle and the chloroform was collected in the same 100 ml beaker.
Forty ml of 0.02 M KOH and 1% KCL mixture were taken in a second separating funnel. To this, added the collected 20 ml chloroform extract and mixed it slowly and collected the through anhydrous sodium sulphate bed drop by drop to remove any traces of moisture. The chloroform extract was kept in an oven at 50˚ C till it has been dried. The dry aflatoxin film is rediluted with 0.2 ml chloroform and spotted on the TLC plate 40µl.
Development of TLC plates
For examination of extracts, aluminium-packed Silica gel 60F254 (Merck, type 1.05554.0007) was used as supplied for 20 x 20 cm2 plates according to AOAC (1984). Plates were spotted along 1.5 cm from the bottom with 40 µl aliquots of extract and different volume (2, 5, 8 and 10µl) of aflatoxin B1 and B2 standard (4µg/ml) on different TLC plates. The plate was developed in acetone: chloroform: water (88:12:1) solvent in equilibrated, TLC chromotanks at room temperature until the solvent front had reached a line marked 2 cm from the top of the plate. After development, plates were removed and air – dried in a fume – cabinet and then examined in a UV long wavelength (364nm) light in a UV cabinet.
Antifungal assay of essential oils against aflatoxigenic Aspergillus flavus
Agar diffusion test or well diffusion assay was performed by the method of Thanaboripat et al. (2004) with slight modification. According to randomization procedure 12 isolates of A. flavus were selected for susceptibility test. The aflatoxigenic A. flavus spore was swabbed on Sabouraud’s dextrose agar (SDA) plates using a sterile cotton swab. Agar wells were prepared with the help of sterilized cork borer with 6mm diameter. Five wells were bored in the each plate. Add 0.01% of Bavistin (antifungal) was used as the control to compare with inhibitory effect of plant essential oils. Using a micropipette, 50µl of different essential oil (Clove oil, Almond oil, Cumin oil and Peppermint oil) was added to the wells in the plate. The plates were incubated in an upright position for 3 days at room temperature and the zones of inhibition were determined.
Result
Totally 48 samples (16 types) were analyzed for isolation of Aspergillus flavus. In this present investigation, the highest abundance was observed in Anise (41.61) and lowest in Black Cumin (1.33%). Among the three district high occurrence was observed in Karur (13.6%) followed by Namakkal (11.47%) and Erode (7.90%). The result was showed in Figure.1 and 2.
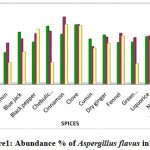 |
Figure 1: Abundance % of Aspergillus flavus in spices.
|
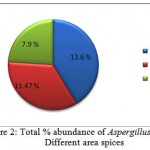 |
Figure 2: Total % abundance of Aspergillus flavus in different area spices.
|
In all spices samples and herbal drugs the moisture content ranged from 6.31-12.99%. Acorus samples had highest moisture content 12.99% and second most had clove (12.21%) followed by cinnamon (12.16%). Among the 16 spices samples lowest moisture observed in nutmeg (6.31%) and the result was tabulated in Table-1. The hydrogen ion concentration (pH) of samples falls in the magnitude of acidic condition. In all the samples the pH ranged from 3.5- 6.8 pH. The result was recorded in Table-2. Among 16 samples the highest pH observed in dry ginger (6.14), followed by black pepper (5.96) and anise (5.95). The lowest pH observed in chebulic myrobalan (3.84).
Table 1: Occurrence of moisture content of the different spices samples.
| S.No | Names of the samples | % of Moisture content | ||
| Karur | Namakkal | Erode | ||
| 1. | Acorus | 13.691 | 14.60 | 10.68 |
| 2. | Anise | 5.84 | 5.67 | 11.81 |
| 3. | Bishop’s weed | 8.73 | 13.01 | 4.36 |
| 4. | Black cumin | 6.49 | 8.47 | 4.45 |
| 5. | Blue jack | 10.72 | 9.34 | 6.63 |
| 6. | Black pepper | 8.66 | 10.42 | 11.37 |
| 7. | Chebulic myrobalan | 11.95 | 10.94 | 4.43 |
| 8. | Cinnamon | 10.30 | 13.86 | 12.33 |
| 9. | Clove | 12.27 | 12.30 | 12.07 |
| 10. | Cumin | 9.31 | 7.73 | 7.41 |
| 11. | Dry ginger | 10.15 | 9.71 | 8.41 |
| 12. | Fennel | 8.59 | 10.51 | 9.93 |
| 13. | Green cardamom | 8.70 | 9.58 | 4.22 |
| 14. | Liquorice | 9.79 | 9.93 | 9.27 |
| 15. | Nutmeg | 7.41 | 5.87 | 5.62 |
| 16 | White pepper | 10.25 | 8.32 | 9.71 |
Table 2: pH analysis for spices samples.
| S.No | Names of the samples | % of
Moisture content |
||
| Karur sample pH ± SD | Namakkal sample pH ± SD | Erode sample pH ± SD | ||
| 1. | Acorus | 4.33 ± 0.10017 | 5.00 ± 0.0642 | 5.26 ± 0.0757 |
| 2. | Anise | 5.68 ± 0.2463 | 6.05 ± 0.5568 | 6.14 ± 0.0592 |
| 3. | Bishop’s weed | 5.60 ± 0.02517 | 5.60 ± 0.04163 | 6.11 ± 0.03055 |
| 4. | Black cumin | 5.44 ± 0.0200 | 5.45 ± 0.03055 | 5.93 ± 0.03786 |
| 5. | Blue jack | 3.95 ± 0.03512 | 4.13 ± 0.02517 | 4.66 ± 0.03055 |
| 6. | Black pepper | 5.57 ± 0.04726 | 5.85 ± 0.03055 | 6.48 ± 0.04163 |
| 7. | Chebulic myrobalan | 2.50 ± 0.02517 | 3.80 ± 0.03055 | 4.24 ± 0.03512 |
| 8. | Cinnamon | 4.46 ± 0.0483 | 4.75 ± 0.045093 | 4.91 ± 0.02517 |
| 9. | Clove | 4.12 ± 0.20232 | 4.50 ± 0.02646 | 4.94 ± 0.03055 |
| 10. | Cumin | 5.32 ± 0.09074 | 5.50 ± 0.03055 | 5.91± 0.02517 |
| 11. | Dry ginger | 6.84 ± 0.03512 | 5.34 ± 0.03000 | 6.25 ± 0.03512 |
| 12. | Fennel | 5.43 ± 0.0300 | 5.70 ± 0.02517 | 5.23 ± 0.02000 |
| 13. | Green cardamom | 5.28 ± 0.03000 | 5.50 ± 0.02000 | 5.90 ± 0.02082 |
| 14. | Liquorice | 5.36 ± 0.02517 | 5.58 ± 0.02082 | 6.10 ± 0.03055 |
| 15. | Nutmeg | 5.00 ± 0.03512 | 5.55 ± 0.02517 | 5.93 ± 0.02082 |
| 16. | White pepper | 5.35 ± 0.03055 | 5.70 ± 0.02517 | 5.91 ± 0.03000 |
TLC analysis of spice extracts revealed the presence of aflatoxins (8-35µg/kg) in 16 samples of anise, black pepper, caraway, black cumin, fennel and peppermint. In the present study, among 16 samples chebulic myrobalan and clove not detected any aflatoxins B1 and B2. From remaining 14 samples, the toxin ranges were 13.60 to 167.2ppb. The highest aflatoxins were detected in black pepper III (167.20ppb) followed by black cumin III (85.57ppb), dry ginger III (60.28ppb), fennel II (64.17ppb), acorus II (48.61ppb), cinnamon I (42.78ppb) and cinnamon III (29.20ppb). In the remaining samples aflatoxins content was less than 25ppb (Table- 3).
Table 3: Detection of Aflatoxin in Different spices.
| S.No |
Name of the samples
|
Aflatoxin B1 Detection (ppb)
(Level of Aflatoxin ppb ± SD) |
||
| Sample I | Sample II | Sample III | ||
| Acorus | 23.33 ± 5.83 | ND | 23.33 ± 8.91 | |
| Anise | ND | 17.27 ± 5.83 | ND | |
| Bishop’s weed | ND | ND | ND | |
| Black cumin | 13.60 ± 3.37 | ND | 85.57± 24.28 | |
| Blue jack | ND | ND | ND | |
| Black pepper | ND | ND | 167.2 ± 5.83 | |
| Chebulic myrobalan | 42.78 ± 9.01 | ND | ND | |
| Cinnamon | ND | ND | 29.2 ± 12.14 | |
| Clove | ND | 23.33 ± 5.83 | ND | |
| Cumin | ND | ND | ND | |
| Dry ginger | ND | 64.17 ± 8.91 | 60.28 ± 8.91 | |
| Fennel | ND | ND | ND | |
| Green cardamom | ND | 21.38 ± 3.36 | 21.38 ± 5.82 | |
| Liquorice | ND | 19.44 ± 5.83 | ND | |
| Nutmeg | ND | ND | 23.33 ± 3.37 | |
| White pepper | 23.33 ± 3.36 | ND | 13.60± 38.31 | |
Antifungal activity of essential oil against aflatoxigenic fungi
The effectiveness of essential oils against toxigenic A. flavus were assessed and recorded in table-4. A total of 12 toxigenic A. flavus were assessed against 4 essential oils. Among 4 essential oils, clove oil is highly effective against maximum number of toxigenic A. flavus isolates and zone of inhibitions ranged from 16mm – 22mm. Almond oil, peppermint oil, cumin oil were also effective only with 2 or 3 toxigenic A. flavus isolates.
Table 4: Antifungal activity of four different essential oils against toxigenenic Aspergillus flavus.
| S.No | Toxigenic isolates | Zone of inhibition (mm) | ||||
| Bavistin
(Control) |
Clove oil | Almond oil | Peppermint oil | Cumin oil | ||
| Aspergillus flavus- 1 | 12 | 18 | 0 | 20 | 0 | |
| Aspergillus flavus- 2 | 18 | 20 | 12 | 14 | 10 | |
| Aspergillus flavus –3 | 0 | 20 | 0 | 0 | 14 | |
| Aspergillus flavus –4 | 14 | 16 | 0 | 0 | 12 | |
| Aspergillus flavus –5 | 18 | 16 | 0 | 0 | 0 | |
| Aspergillus flavus –7 | 22 | 18 | 0 | 0 | 0 | |
| Aspergillus flavus –8 | 28 | 0 | 0 | 0 | 0 | |
| Aspergillus flavus -9 | 18 | 16 | 0 | 0 | 0 | |
| Aspergillus flavus- 10 | 20 | 16 | 0 | 0 | 0 | |
| Aspergillus flavus –11 | 20 | 16 | 0 | 0 | 0 | |
| Aspergillus flavus- 12 | 24 | 18 | 0 | 0 | 0 | |
| Aspergillus flavus- 14 | 14 | 22 | 0 | 0 | 0 | |
Discussion
Spices and herbs are valued for their distinctive flavours, colours and aromas. They are the most versatile and widely used ingredient in food preparation and processing throughout the world. As with many other agricultural products, spices and herbs may be exposed to a wide range of microbial contamination during pre and post-harvest. Such contamination may occur during processing storage, distribution, sale and or use (Mckee, 1995). Fungi are the predominant contaminants of spices (Kneifel and Berger, 1994). But most such microbial populations are probably regarded as commensal resident on the plant that survived drying and storage. Soil and air is the main inoculum source for causing contamination in crude spices in field. Other practices like harvesting, handling and packing cause additional contamination. Moreover, spices are collected in tropical areas by simple methods and are commonly exposed to many contaminants before, being dry enough to prevent microbial growth. They are also stored in condition favouring contamination by insects, rodents and other vermin. Decontamination with ethylene oxide, irradiation, or other acceptable methods reduces considerably microorganisms in spices (Sharma et al, 1984).
Elshafie et al, (2002) reported that the average percentages moisture content of cumin, cinnamon, black pepper, clove, cardamom, ginger and coriander were 6.9, 10.5, 10.1, 23.0, 10.3, 10.2 and 6.1 respectively. In the present study, the average percentages of moisture content of acorus, anise, bishop’s weed, black cumin, dry ginger, fennel, green cardamom, liquorice, nutmeg and white pepper were 12.99%, 7.5%, 8.7%, 6.47%, 10.15%, 8.89%, 9.1%, 12.16%, 12.21%, 8.15%, 9.47%, 9.67%, 7.5%, 6.3% and 9.43% respectively. All the spices had average moisture content less than the maximum limit except acorus 12.99%. A large number of the spices studied which indicates the potential ability of these fungi for growth if the moisture content and the environmental condition are conductive for their growth if the moisture content and the spices could have taken place in the field, during processing, transportation and bad storage conditions. The lowest pH level of the spices was detected the lowest in Chebulic myrobalan (3.84) and the highest in dry ginger (6.14). All the samples of spices studied in the investigation showed low pH level. These findings are similar to those reported by Mandeel 2005, who reported that the pH of spices samples fall in the pH of acidic.
Aspergillus flavus were found in all of the collected samples. These results similarly associated to Aziz et al. (1998). The contamination with fungal species resulted from neutral extraneous contamination by dust following storage in humid conditions (Domsch et al. 1981).
TLC analysis of spices extracts revealed the presence of aflatoxins (8-35 µg/kg) in 16 samples of anise, black pepper, caraway, black cumin, fennel, peppermint, coriander and marjoram in Egypt (EI- Kady et al. 1995). Among 16 samples chebulic myrobalan and clove not detected any aflatoxins B1 and B2. From remaining 14 samples, the toxin ranges were 13.60 to 167.2ppb. The highest aflatoxins were detected in black pepper III (167.20ppb) followed by black cumin III (85.57ppb), dry ginger III (60.28ppb), fennel II (64.17ppb), acorus II (48.61ppb), cinnamon I (42.78ppb) and cinnamon III (29.20ppb). In the remaining samples aflatoxins content was less than 25ppb. A few research reports were expressed the same result of present study.
Four different essential oils were assayed against toxigenic Aspergillus flavus isolates and clove oil was highly effective against 10 A. flavus isolates. Several studies have focused on the potential use of essential oil applicatons in biological control of aflatoxin producing fungi and insect pests (Bankole and Joda, 2004). Certain essential oils can be applied as mold inihibitor in order to prevent the growth of aflatoxigenic fungi in stored foods. The inhibitory activity of clove is due to the presence of several constituents, mainly eugenol, eugenyl acetate, beta-caryophyllene, 2-heptanone. The main constituents of essential oil are phenyl-propanoides such as carvacrol, thymol, eugenol and cinnamaldehyde. These phytochemicals are responsible for antifungal activity. In the present studies essential oils were used for the susceptibility of aflatoxigenic fungi. Among the 4 types essential oils clove oil was highly active against aflatoxigenic fungi. During this survey A. flavus was isolated from all spices samples were tested. A higher frequency of occurrence of A. flavus was observed in most of the spices samples. It is advisable to store and consume spices within a relatively short period to avoid build up of aflatoxins.
Reference
- Akiyama, H., Goda, Y., Tanaka, T. and Toyoda, M. “Determination of aflatoxins B1, B2, G1 and G2 in spices using a multifunctional column clean-up”. J. Chromatogr., A. 932: 153-157 (2001).
- Alam K.J., Hossain M.M., Basi A.S.M., Chowdhry E. H., Hossain A.K.M.A. and Isalm M.A.”Etiopathological investigation of Systemic Disease in slaughtered Black Bengal goats”. Bangladesh Veterinary Journal. 35: 53-38 (2001).
- AOAC (Association of Official Analytical Chemists)”Official methods of analysis of the Association of Official Analytical Chemists 14th edition”. Arlington. VA 22209 USA: AOAC (1984).
- Aziz N. H., Youssef Y. A., El – Foulu M., Moussa L. “Contamination of some common medicinal plant samples and spices by fungi and their mycotoxins”. Bot. Bull. Acad. Sin., 39: 279 – 285(1998).
- Bankole S.A. and Joda A.O. “Effect of lemon grass (Cymbopogon citratus Stapf) powder and essential oil on mould deterioration and aflatoxin contamination of melon seeds (Colocynthis citrullus L.)”. African Journal of Biotechnology. 3 (1): 52-59(2004)..
- Domsch K.H., Game W. and Anderson T. H.”Compendium of soil fungi”. Vol 1 and 2, Academic Press, London (1981).
- El-Kady I.A., El-Maraghy S.M., and Mostafa M.E. “Natural Occurrence of Mycotoxins in Different Spices in Egypt”. Folia Microbiologica, 40, 3: 297-300(1995).
- Elshafie A.E., AI-Lawatia, T. and AI-Bahry S. “Fungi associated with black tea and Tea quality in the Sultanate of Oman”. Mycopatholgia, 145: 89-93(1999).
- Grybauskas A.P., Thomison P.R. and Cassel E.K. “Aflatoxins”. Cooperative Extension Service, University of Maryland, USA(1988).
- Kneifel W. and Berger E. “Microbial criteria of random samples of spices and herbs retailed on the Austrian market”. J. Food Protect., 57: 893-901(1994).
- Mandeel Q. A. “Fungal contamination of some imported spices”. Mycopathologia, 159: 291-298(2005).
- Mckee L.H. “Microbial contamination of spices and herbs: A Review”. Lebensm. Wiss.Technol., 28: 1-11(1995).
- Thanaboripat D., Monkontanawut N., Suvathi Y. and Ruangrattanametee V. “ Inhibition of aflatoxin production and growth of Aspergillus flavus by citronella oil”. KMITL Science Journal, 49 (1): 1-8(2004).
Accepted on: 03 October 2011


![]()
![]()
