
Analytical Method Development and Validation for Safinamide Mesylate using RP-HPLC with Quality by Design Approach
 , Rahul Khaire2*, Mohit Wagh1, Dheeraj Chechare3, and Yogesh Thombare3
 1Department of Pharmaceutical Chemistry, Pravara Rural College of Pharmacy, Loni, India
2Department of Pharmaceutical Chemistry, PRES’s College of Pharmacy (For Women), Nashik, India
3Department of Pharmaceutical Chemistry, PRES’s College of Pharmacy (D. Pharm), Nashik, India
Corresponding Author E-mail:rahuldkhaire@gmail.com
Download this article as:
ABSTRACT:To develop and validate a robust, stability-indicating RP-HPLC method for safinamide mesylate quantification employing systematic Quality by Design approach for pharmaceutical quality control and regulatory applications in Parkinson's disease therapy.Box-Behnken design with 17 experimental runs optimized three critical parameters: mobile phase composition (45-55% methanol), flow rate (0.8-1.2 mL/min), and column temperature (33-37°C). Chromatographic separation was achieved on Inertsil ODS-3V C18 column with UV detection at 226 nm. Response surface methodology established design space boundaries, followed by comprehensive validation per ICH Q2(R1) guidelines including specificity, linearity, accuracy, precision, robustness, LOD/LOQ, solution stability, and filter compatibility.Optimal conditions (47.5% methanol, 0.8 mL/min, 35°C) yielded retention time 3.56 minutes with excellent system suitability (% RSD 0.04%, theoretical plates 4366, asymmetry 1.11). Quadratic models demonstrated strong predictive capability (R² >0.88, relative errors <2%). The method exhibited exceptional linearity (r² = 0.9999, 2-30 μg/mL), high sensitivity (LOD 0.079 μg/mL, LOQ 0.240 μg/mL), excellent accuracy (99.81% recovery), superior precision (repeatability 0.86% RSD, intermediate 1.05% RSD), and robust performance under deliberate parameter variations. Solutions remained stable for 24 hours with both PVDF and Nylon filters compatible.
KEYWORDS:Box-Behnken design; ICH Q2(R1); Method validation; Parkinson's disease; Quality by Design; RP-HPLC; Safinamide mesylate
Introduction
Parkinson’s disease affects about 10 million people across the globe with its prevalence getting very high as one gets older with an average of 1-2 % of people aged above 60 years being affected by it.1 The economic cost to the world is above 52billion each year which includes direct medical care costs and indirect costs through the cost of low productivity and support of caregivers.2 Several challenges associated with current therapeutic approaches includeintricate polypharmacy schedules, inter-patient variability in the response to drugs and unreliable bioavailability characteristics.3 Conventional analytical processes to track Parkinson drugs are oftentimes weak and do not consider important quality aspects in a systematic manner.4 Increasing pressure is put on the pharmaceutical industry to come up with dependable, repeatable methods of analytical procedures to maintain the quality of the drugs throughout the product lifecycle.5 The traditional method development methods are more of a trial-and-error methodology and they are time and resource consuming and offer minimal insight into the parameter of methods of great importance. Recent regulatory standards note the requirement of science based, risk assessed analytical processes thatprove the overall knowledge of the performance characteristics of methods and their scope of operation.6
Safinamide mesylate is a new type of monoamine oxidase-B (MAO-B) inhibitor that has two pharmacologic activities which are a combination of MAO-B inhibition with voltage-gated sodium channel blockage and calcium channel regulating activities.7 This chemical compound has a molecular weight of 398.5 g/mol and the typical absorption maximum at 226 nm, which makes the compound visible in a liquid chromatography set. Clinical trials show that safinamide offers great benefits in motor fluctuations when combined with levodopa in adjunctive therapy to lengthening of on-time without bothersome dyskinesia by about 1-2 hours daily. The lipophilic property of the compound also allows easy access to the central nervous system tissues via blood-brain barrier with therapeutic concentrations.8 Pharmacokinetics indicate the total absorption through the oral route, linearity in dose-proportional exposure and predominant hepatic metabolism by amide hydrolysis and glucuronidation. Published data determine the positive safety profile of safinamide with the least amount of dopaminergic side effects in comparison to conventional MAO-B inhibitors.9
Materials and Methods
Materials
Safinamide mesylate reference standard (purity 99.8%) was procured from Sciquaint Innovations Pvt. Ltd., Pune, India. Methanol (HPLC grade, ≥99.9%) and orthophosphoric acid (85% w/v, analytical grade) were obtained from Research Lab Fine Chem Industries, Pune, India. HPLC-grade water was prepared using a Milli-Q water purification system.
Methods
Determination of Absorption Maxima (λmax) of Safinamide
A double-beam UV-visible spectrophotometer (Labindia Analytical Instruments Pvt. Ltd. Mumbai, India Model UV-3092) was used to ascertain the absorption maxima of safinamide. A stock solution was made by dissolving 13.18mg safinamide mesylate (synonymous to 10 mg safinamide base) in 20mL of water with the use of a sonic machine at 25 ± 2°C. The concentration was further diluted to 20 µg/mL by adding 0.8 mL of aliquot to 20 mL of water. The solution was scanned between 200-400nm against water as blank using 10mm quartz cuvettes at a scan rate of 200 nm/min. All the measurements were conducted three times (n=3) at room temperature.10
Chromatographic Conditions
The chromatographic process was conducted using a high-performance liquid chromatography (Agilent Technologies, Model 1260 Infinity II, USA) that had quaternary pump, autosampler, column thermostat and UV-visible detector. As a stationary phase, an Inertsil ODS-3V C18 column (150 mm × 4.6 mm i.d., 5 um particle size, GL Sciences Inc., Japan) was employed. The mobile phase was composed of 0.1 percent orthophosphoric acid in water (50:50, v/v) and it was isocratically added at a flow rate of 1.0 mL/min. During the analysis, the column oven temperature was held at 35°C. A 226 nm UV detector was used to perform detection. The volume of injection was fixed at 20 μL and a run time of 10 minutes. Before analysis, 0.45 mu membrane filters and 15 minutes of sonication to remove any bubbles was done on the mobile phase. At least 30 minutes of incubation of the column in the mobile phase was allowed to stabilize the column before the initial injection in order to obtain the baseline stability and reproducible retention times.11-13
Quality by Design Approach
A Box-Behnken design as shown in Table 1 and Table 2 was employed for systematic optimization of the chromatographic method using Design-Expert® software (Version 7.0.0, Stat-Ease Inc., Minneapolis, MN, USA). The design consisted of 17 experimental runs with three independent variables: mobile phase composition (X: 45-55% methanol), flow rate (X: 0.8-1.2 mL/min), and column oven temperature (X: 33-37°C), each evaluated at two levels (low and high). The dependent variables were retention time, peak asymmetry factor, and theoretical plates. Each run was performed in triplicate (n=3). The experimental data were analyzed using analysis of variance (ANOVA) and response surface methodology to establish relationships between variables, identify significant factors, and determine the optimal design space where method performance consistently met predefined acceptance criteria.14-16
Table 1: Experimental variables and their levels in Box-Behnken design for method optimization
| Sr. No | Independent Variables | Levels | |
| Low (-1) | High (+1) | ||
| 1 | Methanol (%) | 45 | 55 |
| 2 | Flow rate (mL/min) | 0.8 | 1.2 |
| 3 | Column oven temperature (°C) | 33 | 37 |
| Dependent Variable | |||
| Retention time | Range (2-6) | ||
| Peak asymmetric factor | Minimize | ||
| Theoretical plates | Maximize | ||
Table 2: Experimental runs and design matrix for Box-Behnken optimization
| Run | FactorA: Methanol (%) | Factor B: Flow rate (mL/min) | Factor C: Column oventemperature (°C) |
| 1 | 50 | 1.2 | 32 |
| 2 | 55 | 1 | 32 |
| 3 | 55 | 0.8 | 35 |
| 4 | 50 | 0.8 | 32 |
| 5 | 45 | 0.8 | 35 |
| 6 | 45 | 1.2 | 35 |
| 7 | 50 | 1 | 35 |
| 8 | 55 | 1.2 | 35 |
| 9 | 50 | 0.8 | 38 |
| 10 | 50 | 1 | 35 |
| 11 | 45 | 1 | 32 |
| 12 | 45 | 1 | 38 |
| 13 | 50 | 1 | 35 |
| 14 | 50 | 1 | 35 |
| 15 | 50 | 1.2 | 38 |
| 16 | 55 | 1 | 38 |
| 17 | 50 | 1 | 35 |
Results
Scanning absorbance maxima determination
UV spectrophotometric analysis showed that the highest absorption was at 226 nm as shown in Figure 1 and the wavelength was chosen as the detection wavelength in the method of HPLC. This wavelength gave sufficient sensitivity to detect safinamide and reduced any possible interference by the mobile phase components and excipients of pharmaceuticals. The large molar absorptivity of the solution at 226 nm helped in the high level of sensitivity of the method as the detection and quantitative limits were low. The wavelength used was in line with the chromophoric structure of safinamide that has an aromatic benzamide moiety that provides UV absorption in this wavelength range.
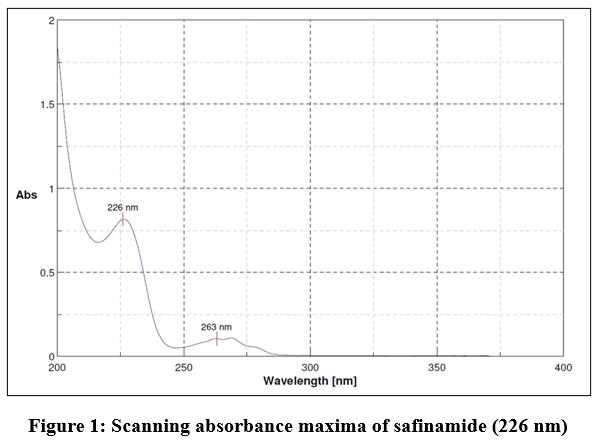 |
Figure 1: Scanning absorbance maxima of safinamide (226 nm)
|
System Suitability Test
The system suitability test showed a very good chromatographic result with the area of the peak percentage of RSD of only 0.04% which is very low relative to the acceptance criterion of 2.0% give in Table 3. The theoretical plate count was 4366; demonstrating excellent column efficiency. The eventual asymmetry of the peak (1.11) provided evidence of the superb peak symmetry whereas the stability of the retention time (3.56 minutes) of six repeated injections indicated the stability of the chromatographic environment.
Table 3: System suitability test results for Safinamide
| Injection No. | Peak Area | Retention Time (min) | Asymmetry | Theoretical Plates |
| 1 | 19,946,358 | 3.56 | 1.11 | 4384 |
| 2 | 19,953,946 | 3.56 | 1.11 | 4351 |
| 3 | 19,942,861 | 3.56 | 1.11 | 4369 |
| 4 | 19,936,281 | 3.56 | 1.12 | 4351 |
| 5 | 19,952,864 | 3.56 | 1.11 | 4376 |
| 6 | 19,946,462 | 3.56 | 1.11 | 4366 |
| Mean ± SD | 19,946,462 ± 7308 | 3.56 ± 0.00 | 1.11 ± 0.00 | 4366 ± 14 |
| % RSD | 0.04 | 0.00 | 0.00 | 0.32 |
The Box-Behnken design with 17 experimental conditions was able to efficiently investigate the design space giving a range of retention times of between 1.72 and 5.27 minutes, a range of asymmetry factors of between 1 09 and 1.22 and a range of theoretical plates of 3083 to 4903 as given in Table 4. Excellent reproducibility and little variation were observed with center point replicates (run 9, 10, 13, 14, 17), thereby proving the reliability of the experiments. The acceptable values of peak asymmetry were found to be below 2.0 in all the runs and the theoretical plate was more than 2000 and passed the ICH standards.
Table 4: Experimental results of Box-Behnken design showing chromatographic responses
| Run | Retention time (RT) | Asymmetry | TP |
| 1 | 2.39 | 1.09 | 3267 |
| 2 | 2.16 | 1.1 | 3455 |
| 3 | 2.63 | 1.12 | 4191 |
| 4 | 3.56 | 1.12 | 4352 |
| 5 | 4.9 | 1.18 | 4818 |
| 6 | 3.27 | 1.13 | 3673 |
| 7 | 2.78 | 1.14 | 3784 |
| 8 | 1.72 | 1.11 | 3083 |
| 9 | 3.34 | 1.18 | 4237 |
| 10 | 2.78 | 1.14 | 3775 |
| 11 | 5.27 | 1.19 | 4741 |
| 12 | 4.87 | 1.22 | 4903 |
| 13 | 2.78 | 1.14 | 3793 |
| 14 | 2.79 | 1.14 | 3766 |
| 15 | 2.14 | 1.1 | 3340 |
| 16 | 2.02 | 1.13 | 3693 |
| 17 | 2.79 | 1.14 | 3773 |
Optimization
Effect on Retention Time
The quadratic model for retention time was highly significant (F-value = 22.77, p = 0.0002) with excellent fit (R² = 0.9245, adjusted R² = 0.8331, predicted R² = 0.7388). ANOVA revealed that methanol percentage (Factor A) was the most significant factor (F = 145.10, p < 0.0001), followed by flow rate (Factor B, F = 36.57, p = 0.0005). Column oven temperature showed no significant effect (p = 0.2535). The quadratic term A² was significant (F = 14.58, p = 0.0066), indicating curvature effect as given in Table 5 and Table 6.
Retention Time = 2.79 – 1.06A – 0.53B + 0.11C – 0.18AB + 0.065AC – 0.0075BC + 0.35A² + 0.12B² – 0.17C²
Response surface plots demonstrated that retention time decreased significantly with increasing methanol percentage (45-55%), with the effect more pronounced at lower flow rates. The negative coefficients confirmed inverse relationships. Optimal retention time (2.5-3.5 minutes) was achieved at 47-50% methanol with flow rates of 0.9-1.1 mL/min.
Effect on Peak Asymmetry
The quadratic model for asymmetry was significant (F = 8.95, p = 0.0043) but showed moderate fit (R² = 0.5135, adjusted R² = 0.4135). Methanol percentage was the most significant factor (F = 37.56, p = 0.0005), followed by flow rate (F = 16.06, p = 0.0051) and temperature (F = 9.39, p = 0.0182). The quadratic term B² was significant (F = 8.45, p = 0.0228).
Peak Asymmetry = 1.14 – 0.028A + 0.018B + 0.014C – 0.010AB – 0.0000AC – 0.0125BC + 0.0105A² + 0.0140B² – 0.0032C²
Contour plots Figure 2 showed that asymmetry remained stable (1.09-1.22) across the experimental domain, well within acceptable limits (≤ 2.0). Optimal symmetry was achieved at higher methanol percentages (50-55%) with moderate flow rates (0.8-1.0 mL/min) and lower temperatures (33-35°C).
Effect on Theoretical Plates
The quadratic model was highly significant (F = 14.55, p = 0.0010) with good fit (R² = 0.8840, adjusted R² = 0.8117, predicted R² = 0.7005). Flow rate was the most significant factor (F = 65.79, p < 0.0001), followed by methanol percentage (F = 50.57, p = 0.0002). Temperature showed no significant effect (p = 0.5150). The quadratic term A² was significant (F = 9.76, p = 0.0168).
Theoretical Plates = 3923 – 402.50A – 459.25B + 12.25C + 9.25AB + 19.00AC + 47.00BC + 182.50A² + 76.63B² + 90.13C²
Response surface plots revealed that maximum theoretical plates (>4500) were achieved at lower methanol percentages (45-47%) with lower flow rates (0.8-0.9 mL/min). Both negative coefficients indicated that increasing methanol and flow rate decreased column efficiency.
Table 5: Model fit summary of retention time, peak asymmetry and theoretical plates
| Source | Sequential p-value | Lack of Fit p-value | Adjusted R² | Predicted R² | |
| Retention time | |||||
| Quadratic | 0.0186 | < 0.0001 | 0.9245 | 0.4717 | Suggested |
| Peak asymmetric factor | |||||
| Quadratic | 0.0506 | 0.8172 | -0.2796 | Suggested | |
| Theoretical plates | |||||
| Quadratic | 0.0442 | < 0.0001 | 0.8840 | 0.1894 | Suggested |
Table 6: ANOVA summary of retention time, peak asymmetry and theoretical plates
| Source | Sum of Squares | df | Mean Square | F-value | p-value | |
| Retention Time | ||||||
| Model | 16.89 | 9 | 1.88 | 22.77 | 0.0002 | significant |
| A-Methanol | 11.96 | 1 | 11.96 | 145.10 | < 0.0001 | |
| B-Flow rate | 3.01 | 1 | 3.01 | 36.57 | 0.0005 | |
| C-Column oven temperature | 0.1275 | 1 | 0.1275 | 1.55 | 0.2535 | |
| AB | 0.1296 | 1 | 0.1296 | 1.57 | 0.2501 | |
| AC | 0.0169 | 1 | 0.0169 | 0.2051 | 0.6643 | |
| BC | 0.0002 | 1 | 0.0002 | 0.0027 | 0.9598 | |
| A² | 1.20 | 1 | 1.20 | 14.58 | 0.0066 | |
| B² | 0.1492 | 1 | 0.1492 | 1.81 | 0.2204 | |
| C² | 0.2885 | 1 | 0.2885 | 3.50 | 0.1035 | |
| Peak Asymmetry | ||||||
| Model | 0.0181 | 9 | 0.0020 | 8.95 | 0.0043 | significant |
| A-Methanol | 0.0084 | 1 | 0.0084 | 37.56 | 0.0005 | |
| B-Flow rate | 0.0036 | 1 | 0.0036 | 16.06 | 0.0051 | |
| C-Column oven temperature | 0.0021 | 1 | 0.0021 | 9.39 | 0.0182 | |
| AB | 0.0004 | 1 | 0.0004 | 1.78 | 0.2242 | |
| AC | 3.469E-18 | 1 | 3.469E-18 | 1.542E-14 | 1.0000 | |
| BC | 0.0006 | 1 | 0.0006 | 2.78 | 0.1395 | |
| A² | 0.0011 | 1 | 0.0011 | 4.94 | 0.0616 | |
| B² | 0.0019 | 1 | 0.0019 | 8.45 | 0.0228 | |
| C² | 0.0001 | 1 | 0.0001 | 0.2632 | 0.6237 | |
| Theoretical Plates | ||||||
| Model | 4.462E+06 | 9 | 4.958E+05 | 14.55 | 0.0010 | significant |
| A-Methanol | 1.723E+06 | 1 | 1.723E+06 | 50.57 | 0.0002 | |
| B-Flow rate | 2.242E+06 | 1 | 2.242E+06 | 65.79 | < 0.0001 | |
| C-Column oven temperature | 16020.50 | 1 | 16020.50 | 0.4702 | 0.5150 | |
| AB | 342.25 | 1 | 342.25 | 0.0100 | 0.9230 | |
| AC | 1444.00 | 1 | 1444.00 | 0.0424 | 0.8428 | |
| BC | 8836.00 | 1 | 8836.00 | 0.2593 | 0.6262 | |
| A² | 3.325E+05 | 1 | 3.325E+05 | 9.76 | 0.0168 | |
| B² | 58602.53 | 1 | 58602.53 | 1.72 | 0.2311 | |
| C² | 81088.42 | 1 | 81088.42 | 2.38 | 0.1668 | |
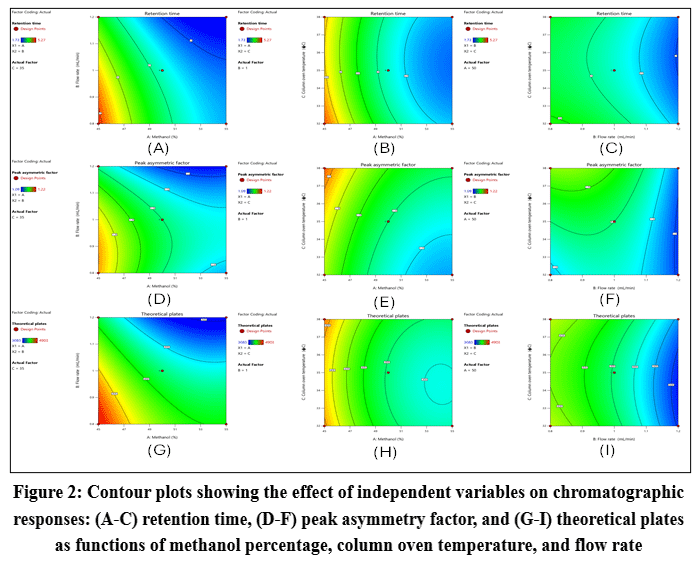 |
Figure 2: Contour plots showing the effect of independent variables on chromatographic responses: (A-C) retention time, (D-F) peak asymmetry factor, and (G-I) theoretical plates as functions of methanol percentage, column oven temperature, and flow rate
|
Validation of statistical models
The constructed quadratic models showed great predictability, and relative errors in the predicted and experimental values were 0.72% to 1.89% in all the three responses given in Table 7. Close correlation of predicted (3.494 min) and experimental (3.56 min) retention times and slight differences in asymmetry factor and theoretical plates proved the suitability of Box-Behnken design to optimise chromatography. All the relative errors were not more than 5% which means that the mathematical models are credible in predicting the performance of methods in the design space and can be used to guide future method modification without further experimental work.
Table 7: Validation of statistical model
| Batch | Response | Predicted value | Experimental value | % Relative error |
| Run 4 | Retention time | 3.494 | 3.56 | 1.89 |
| Peak asymmetric factor | 1.112 | 1.12 | 0.72 | |
| Theoretical plates | 4298 | 4352 | 1.26 |
Results of Method Validation
Specificity Study
The technique was highly specific and this had no other interfering peaks at the retention time of safinamide at blank or placebo solutions as per Table 8. Both standard (0.982) and test solutions (0.975) had peak purities of over 0.95, indicating that the spectrometry was homogeneous and there were no impurities co-eluting. Chromatograms revealed clear safinamide peaks without excipients of the tablet such as diluents, binders and disintegrants.
Table 8: Specificity study results
| Description | Observation |
| Blank | No interference at retention time of safinamide |
| Placebo | No interference at retention time of safinamide |
| Standard solution (20 μg/mL) | Peak purity: 0.982 |
| Test solution (20 μg/mL) | Peak purity: 0.975 |
Linearity study
The procedure showed a great linearity within the concentration of 2-30 μg/mL (10-150% of the working range) with a correlation coefficient (R2) of 0.9999, which is much better than the ICH acceptance limit of 0.999 depicted in Figure 3. The values of the % RSD were less than 0.3 % at each of the concentration levels which portrayed extraordinary precision of measurements. Linear regression equation y = 996180.6x – 5027.3 was good to be quantified with small intercept error.
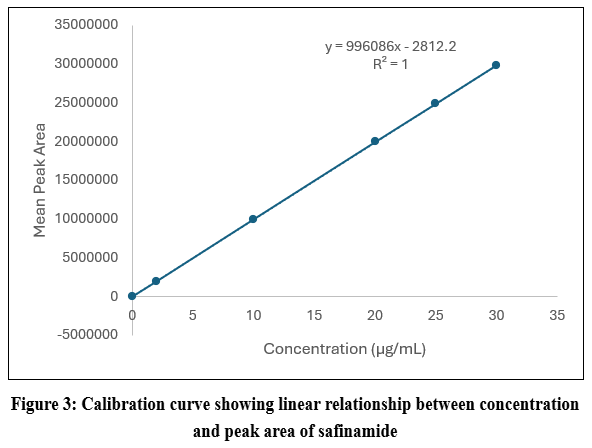 |
Figure 3: Calibration curve showing linear relationship between concentration and peak area of safinamide
|
Limit of Detection (LOD) and Limit of Quantitation (LOQ)
The calculated LOD (0.079 μg/mL) and LOQ (0.240 μg/mL) values demonstrated high sensitivity of the developed method as per Table 9. The LOQ, representing only 1.2% of working concentration, indicated capability for trace-level quantification in pharmaceutical samples. These low detection limits, determined from calibration curve statistics following ICH Q2(R1) guidelines, enable accurate determination of safinamide even in degraded samples or low-dose formulations. The experimental verification of LOQ with % RSD below 2.0% confirmed adequate precision at this concentration level, establishing method suitability for impurity profiling and stability studies.
Table 9: LOD and LOQ determination for safinamide
| Parameter | Formula | Value | Result |
| Residual standard deviation (σ) | From regression line | 23,931.73 | – |
| Slope (S) | From calibration curve | 996,180.614 | – |
| Limit of Detection (LOD) | 3.3σ/S | (3.3 × 23,931.73) / 996,180.614 | 0.079 μg/mL |
| Limit of Quantitation (LOQ) | 10σ/S | (10 × 23,931.73) / 996,180.614 | 0.240 μg/mL |
Accuracy (Recovery Studies)
The recovery studies demonstrated excellent accuracy with mean recoveries of 99.60%, 100.00%, and 99.82% at 50%, 100%, and 150% levels respectively, all within the acceptance range of 98-102% shown in Table 10. Overall mean recovery of 99.81% with % RSD of 0.91% confirmed method’s ability to accurately quantify safinamide across the analytical range without matrix interference.
Table 10:Accuracy (Recovery) Study of the Developed Method
| Level (%) | Area | Recovered Conc. (µg/mL) | Added Conc. (µg/mL) | % Recovery | Mean % Recovery |
| 50 | 9,956,341 | 9.98 | 10.01 | 99.70 | 99.60 |
| 10,096,140 | 10.12 | 10.07 | 100.50 | ||
| 9,896,215 | 9.92 | 10.06 | 98.61 | ||
| 100 | 19,953,622 | 20.01 | 20.01 | 100.00 | 100.00 |
| 19,720,134 | 19.77 | 19.98 | 98.95 | ||
| 20,112,631 | 20.17 | 19.96 | 101.05 | ||
| 150 | 29,551,091 | 29.63 | 30.01 | 98.73 | 99.82 |
| 29,865,149 | 29.95 | 30.00 | 99.83 | ||
| 30,165,151 | 30.25 | 29.98 | 100.90 |
Precision
The method demonstrated excellent precision with % RSD of 0.86% for repeatability and 1.05% for intermediate precision, both well below the acceptance limit of 2.0% given in Table 11. Combined precision of twelve determinations yielded % RSD of 0.97%, confirming exceptional reproducibility across different days and analysts. All individual assay values ranged from 95.78% to 98.62%, within acceptable limits of 90-110%.
Table 11: Precision study results for safinamide tablet assay
| Sample | Sample (mg) | Repeatability (Intra-day) | Intermediate Precision (Inter-day) | ||
| Peak Area | % Assay | Peak Area | % Assay | ||
| 1 | 125.3 | 19,526,415 | 97.85 | 19,524,181 | 97.68 |
| 2 | 125.6 | 19,251,632 | 96.24 | 19,425,814 | 97.50 |
| 3 | 126.1 | 19,256,314 | 95.89 | 19,235,017 | 95.78 |
| 4 | 125.9 | 19,256,381 | 96.04 | 19,238,174 | 96.48 |
| 5 | 124.5 | 19,354,182 | 97.61 | 19,536,189 | 97.82 |
| 6 | 125.2 | 19,256,814 | 96.58 | 19,757,873 | 98.62 |
| Mean ± SD | – | – | 96.70 ± 0.83 | – | 97.31 ± 1.02 |
| % RSD | – | – | 0.86 | – | 1.05 |
Robustness
The method remained unaffected by deliberate variations in chromatographic parameters, with all system suitability criteria maintained within acceptable limits shown in Table 12. Theoretical plates ranged from 3937 to 4453 (all >2000) and asymmetry values remained between 1.09-1.14 (all <2.0) across tested conditions.
Table 12: Robustness evaluation: system suitability parameters under varied chromatographic conditions
| Parameter Variation | Retention Time (min) | Peak Area | Asymmetry | Theoretical Plates |
| Wavelength +3 nm (229 nm) | 3.35 | 19,909,884 | 1.14 | 4167 |
| Wavelength -3 nm (223 nm) | 3.34 | 17,959,112 | 1.11 | 4195 |
| Flow rate +10% (0.88 mL/min) | 3.03 | 17,854,000 | 1.11 | 3944 |
| Flow rate -10% (0.72 mL/min) | 3.70 | 21,920,761 | 1.12 | 4453 |
| Temperature +2°C (34°C) | 3.38 | 19,922,616 | 1.12 | 4295 |
| Temperature -2°C (30°C) | 3.49 | 19,951,407 | 1.09 | 3937 |
Solution Stability
Both standard and test solutions demonstrated adequate stability at room temperature for 24 hours, with % differences of 0.39% and 0.55% respectively, well within the acceptance criterion of ≤2.0% as per Table 13. The minimal degradation observed over 24 hours confirms solution integrity during typical analytical sequences.
Table 13: Solution stability study results
| Time Point | Sample Solution | % Absolute Difference | Time Point | Standard Solution | % Absolute Difference |
| Initial | 19,432,563 | NA | Initial | 19,943,691 | NA |
| 12 Hours | 19,385,267 | 0.24 | 12 Hours | 19,905,263 | 0.19 |
| 24 Hours | 19,326,506 | 0.55 | 24 Hours | 19,865,294 | 0.39 |
Filter Compatibility
Both PVDF and Nylon filters demonstrated excellent compatibility with minimal differences of 0.05% and 0.18% respectively compared to unfiltered samples, well within the 2.0% acceptance limit given in Table 14. The negligible variations confirmed absence of drug adsorption onto filter membranes and no interference from filter materials.
Table 14: Filter compatibility study results
| Sample Type | Peak Area | % Absolute Difference from Unfiltered |
| Unfiltered | 19,436,851 | – |
| PVDF Filter (0.45 μm) | 19,426,581 | 0.05 |
| Nylon Filter (0.45 μm) | 19,402,534 | 0.18 |
Discussion
The present study successfully developed and validated a robust RP-HPLC methodof safinamide mesylate by the Quality by Design principles. Box-Behnken design effectively optimized the chromatographic conditions with little experimental input as compared to conventional methods, and the response surface methodology identified the composition of mobile phase and flow rate as important variables in performance. The UV analysis showed the best wavelength to be 226nm, which has good sensitivity as indicated by low LOD (0.079 μg/mL) and LOQ(0.240 μg/mL). The obtained system suitability showed outstanding performance with a maximum area percentage RSD of 0.04%, theoretical plates of 4366, and an asymmetry of 1.11 . Box-Behnken design gave the retention time of 1.72-5.27 minutes, asymmetry 1.09-1.22, and hypothetical plates of 3083-4903 in 17 runs . Experimental reliability was determined with center point reproducibility and excellent fit was obtained with quadratic models (R2 = 0.9245 retention time, 0.8840 theoretical plates).
The good predictive power of the model was shown by relative errors of 0.72-1.89% between predicted and experimental values, which shows that the model performs well in the design space. Extensive ICH Q2(R1) validation determined method suitability: specificity was found to be unaffected by excipients with peak purity of >0.95; linearity was found to have an R2 = 0.9999 over a range of 2-30 μg/mL); accuracy was found to yield a mean recovery of 99.81% with a RSD of 0.91%.The reliability of the methods was checked with robustness testing, which introduced known parameter changes in the method and kept the theoretical plates 3937-4453 and asymmetry 1.09-1.14 steady when the method is tested under different conditions There was a stability of the solution of less than 0.6% per 24 hours and filter compatibility analysis indicated little change of 0.05-0.18% with PVDF and Nylon filters.
QbD offered rich design space knowledge with reduced experiments compared to factorial designs which allows versatile operation over established ranges and allows transfer of the methodology. This method is the best choice because of its short retention time (3.56 minutes), simple isocratic mobile phase, high sensitivity, and strength, which would be suitable in routine quality control, stability investigations, and dissolution experiments in pharmaceutical laboratories.
Conclusion
An effective, sensitive and reliable RP-HPLC methodology to quantify safinamide mesylate was effectively designed and validated using systematic Quality by Design. Box-Behnken design was able to optimize chromatography efficiently obtaining a well-defined design space with thorough knowledge of the important method parameters. The established procedure had superior linearity (R2 = 0.9999), sensitivity (LOQ 0.240 μg/mL), accuracy (99.81 % recovery), and precision (percent RSD <1.1 %), and could withstand purposeful variations in parameters, all in compliance with ICH Q2(R1) requirements. This method is economically feasible and environmentally friendly due to the short analysis time (3.56 minutes), the simplicity of its phase composition, and the low amount of solvent used to conduct the quality control of pharmaceuticals regularly. This is a validated technique that is easily applicable in drug companies to determine assays, stability testing, dissolution testing as well as regulatory filings of safinamide preparations to guarantee uniform product quality and patient safety in management of Parkinson disease.
Acknowledgement
The authors are grateful for the analytical facilities and infrastructure support provided during this research work. We acknowledge the technical assistance and valuable guidance received throughout the study. Sincere thanks are extended to all individuals who contributed directly or indirectly to the successful completion of this work.
Conflicts of Interest
The authors declare no conflict of interest.
Funding Sources
The author(s) received no financial support for the research, authorship, and /or publication of this article.
Conflict of Interest
The authors do not have any conflict of interest.
Data Availability Statement
This statement does not apply to this article.
Ethics Statement
This research did not involve human participants, animal subjects, or any material that requires ethical approval.
Informed Consent Statement
This study did not involve human participants, and therefore, informed consent was not required.
Clinical Trial Registration
This research does not involve any clinical trials.
Permission to reproduce material from other sources
Not Applicable.
Author Contributions
- Mayur Bhosale: Conceptualization, methodology, investigation, data curation, writing—original draft preparation.
- Rahul Khaire: Supervision, validation, formal analysis, writing—review and editing, project administration.
- Mohit Wagh: Methodology, experimental work, data analysis.
- Dheeraj Chechare: Resources, software, data interpretation.
- Yogesh Thombare: Visualization, validation, review of manuscript.
References
- Luo Y, Qiao L, Li M, et al. Global, regional, national epidemiology and trends of Parkinson’s disease from 1990 to 2021: findings from the Global Burden of Disease Study 2021. Front Aging Neurosci. 2025;16:1498756.
CrossRef - Yang W, Hamilton JL, Kopil C, et al. Current and projected future economic burden of Parkinson’s disease in the U.S. NPJ Parkinsons Dis. 2020;6:15.
CrossRef - Bhagavathula AS, Tesfaye W, Vidyasagar K, Fialova D. Polypharmacy and hyperpolypharmacy in older individuals with Parkinson’s disease: a systematic review and meta-analysis. 2022;68:1081-1090.
CrossRef - Khaire RD, Bhangale CJ, Pagare RV, Chothave SJ, Gosavi SB, Jagtap BT. Stability indicating RP-HPLC method development and validation for gatifloxacin and prednisolone acetate. Rasayan J Chem. 2025;18(4).
CrossRef - Weiss J, Beydoun MA, Georgescu MF, et al. Polypharmacy and its association with dementia, Parkinson’s disease, and mortality risk in UK adults: a multistate modeling approach. 2025;47:4349-4367.
CrossRef - Tiwari R, Mahalpure GS, Dahiya M, Kalaiselvan V. Analytical quality by design (AQbD) for quality and risk assessment of pharmaceuticals to immunomarkers. J Pharm Biopharm Res. 2025;7:511-524.
CrossRef - Zagalo DM, Sousa J, Simões S. Quality by design (QbD) approach in marketing authorization procedures of non-biological complex drugs: a critical evaluation. Eur J Pharm Biopharm. 2022;178:1-24.
CrossRef - Khalid MB, Shahzad F, Siddiqui MR, et al. Comparative efficacy and safety of irreversible (rasagiline) and reversible (safinamide) monoamine oxidase inhibitors as add-on therapy for Parkinson’s disease. J Neurol. 2025;272:486.
CrossRef - Khaire RD, Pawar PY. A review on development of stability indicating analytical methods for drugs in bulk and pharmaceutical dosage form. Asian J Pharm Anal. 2022;12(4):261-263.
CrossRef - Aboulatta L, Haidar L, Abou-Setta A, et al. Efficacy and safety of MAO-B inhibitors safinamide and zonisamide in Parkinson’s disease: a systematic review and meta-analysis of randomized controlled trials. CNS Drugs. 2023;37:941-956.
CrossRef - Yeo YWP, Brianna B, Yap YJ, et al. Neuroprotective effects of safinamide against autophagy in 6-hydroxydopamine-induced SH-SY5Y cell model of Parkinson’s disease. J Appl Pharm Sci.
CrossRef
- Carling RS, Degg TJ, Allen KR, Bax NDS, Barth JH. Evaluation of whole blood serotonin and plasma and urine 5-hydroxyindole acetic acid in diagnosis of carcinoid disease. Ann Clin Biochem. 2002;39:577-582.
CrossRef - Khaire RD, Gaware VM, Dhamak KB, et al. Validated stability-indicating HPTLC method for quantification of nortriptyline. Rasayan J Chem. 2026;19(2):801-806.
CrossRef - Mohapatra D, Kumar DN, Shreya S, et al. Quality by design–based development and optimization of fourth-generation ternary solid dispersion of standardized Piper longum extract for melanoma therapy. Drug Deliv Transl Res. 2023;13:3094-3131.
CrossRef - Dongala T, Katari NK, Palakurthi AK, Jonnalagadda SB. Development and validation of a generic RP-HPLC PDA method for the simultaneous separation and quantification of active ingredients in cold and cough medicines. Biomed Chromatogr. 2019;33:e4641.
CrossRef - Jagdale AS, Pendbhaje NS, Nirmal RV, Bachhav PM, Sumbre DB. Development and validation of RP-HPLC method for estimation of brexpiprazole in its bulk and tablet dosage form using quality by design approach. Future J Pharm Sci. 2021;7:142.
CrossRef
Abbreviations
ANOVA: Analysis of Variance
BBD: Box-Behnken Design
DoE: Design of Experiments
HPLC: High-Performance Liquid Chromatography
ICH: International Council for Harmonisation
LOD: Limit of Detection
LOQ: Limit of Quantitation
MAO-B: Monoamine Oxidase-B
PVDF: Polyvinylidene Fluoride
QbD: Quality by Design
RP-HPLC: Reversed-Phase High-Performance Liquid Chromatography
RSD: Relative Standard Deviation
RSM: Response Surface Methodology
RT: Retention Time
SD: Standard Deviation
TP: Theoretical Plates
UV: Ultraviolet
% RSD: Percentage Relative Standard Deviation
Accepted on: 20-05-2026
Second Review by: Dr. Lujain Sahloul
Final Approval by: Dr. Mohammad Fareed


![]()
![]()
