
Optimization of Protein Extraction and Evaluation of Functional Properties of Tomato Waste and Seeds from Tomato Paste Plants
1Department of Food Science and Technology, Sabzevar Branch, Islamic Azad University, Sabzevar, Iran.
2Department of Food Science and Technology, Ferdowsi University of Mashad (FUM), P.O. Box: 91775-1163, Mashhad, Iran.
3Department of Food Chemistry, Research Institute of Food Science and Technology, PO Box 91735-147, Mashhad-Quchan Highway, Mashhad, Iran.
Corresponding Author E-mail: s.m.meshkani@iaus.ac.ir
DOI : http://dx.doi.org/10.13005/bbra/2410
Download this article as:
![]()
There is an increasing interest to bio-components obtained from fruit and vegetable wastes. Response surface methodology(RSM)was used optimization of condition for extraction of protein from tomato wasteand seeds.So the independent variables, alkaline and acidic pH(10-12 and 3.1-4.3), temperature(10-50°C), time(30-70min) and solvent to powder ratio(1:10-1:50w/v) were used.Also, the functional properties of fat and defatted proteins were evaluated. The results showed that the pH 12.00 for first and 3.73for the second precipitation phase, temperature 37.73°C, time 60min, solvent to powder ratio 1:40 were the best conditions of extraction.The responses in this condition, Protein Extraction Yield to Defatted Tomato Waste86.84%; Defatted Tomato Waste Protein35.29%; Protein Extraction Yield to Defatted Tomato Seeds 64.15% and Defatted Tomato Seeds Protein44.65% were measured.Also, the results showed that the lowest of bulk density were for Tomato Waste Protein and Tomato Seeds Protein.The Water Absorption Capacitywas increased to 55°C, while, theOil Absorption Capacity were increased to 75°C. TheEmulsification Activity Index and Emulsification Stability Index were increased along with pH, but the Emulsification Stability Index was highest at pH7. The Foaming Capacity andFoaming Stabilityhad significantly increased same to pH(p<0.05).
KEYWORDS:Response surface methodology; tomato; waste; seeds; protein concentrate
Introduction
The seed protein could be extracted to produce protein isolate/concentrate [16].Tomato seed proteinis rich of lysine in range of 80 to 100 g/kg N, therefore, could be improve the quality of cereal protein products. The tomato seed protein can be used to improvethe physicochemical characteristicssuch loaf volume, texture and anti-staling [12, 13].In world, the people use of tomato as a very beneficial vegetable in daily meals.In the USA, about 57 % of daily lycopene absorbs come from cooking and processingtomato products and only 12% from fresh tomatoes[17]. Also, in western countries, the food products based of tomatoinclude 85% of dietary lycopene[18]. Also, tomatoes are cheap and they have lowest levels of anti-nutritional factors in comparison with other vegetables[13]. For several years, the food scientists have done extensive studiesin the field of tomato waste reusing and extraction of effective their materials, such as antioxidants, carotenoids and proteins[19].Haddad Khodaparastet al.[20]investigated the production of the protein concentrate from tomato waste. They selected the most appropriate conditions for protein extraction from tomato waste in alkaline pH 8-12, temperature 20-70 °Cand acidic precipitation in pH 3.3-5.5. The results showed that the pH ofthe first phase 12 and for the second phase 3.9 in 25°C were the best condition to produce tomato waste protein. Shao et al.[4]evaluated functional properties of two proteins from tomato waste in two product condition (hot and cold break).The results showed that the lower protein extraction yield from 9.1 % to26.3 % for defatted hot break tomato seed compared to from 25.6 % to 32.6 % for defatted cold breaktomato seed under two conditions. Sogi et al.[21]evaluated of the functional properties of tomato seed meals and protein. Their results showed that the fat and water absorption for protein were highest. Also the bulk density for the salt-extraction was the highest.Emulsifying capacity values, as well as, water and oil absorption showed that meal had a good wettability and can blend well with oil and watersystems. Foaming properties of meal were very poor since foam structure was very weak, and foam capacity and stability at room temperature was also low.The pH values for meals and protein concentrates were neutral and acidic, respectively. The foaming capacity and stability of meals and protein were low. The emulsion capacity of meals and protein was good, while the emulsion stability was excellent except for alkali-extracted.In general, tomato seeds protein isolates produced emulsions with greater globule size as compared to soybean protein isolate (SPI); however, both the concentrates were equally effective in constancy of emulsions.
Response surface methodology (RSM) has been widely used to analyze or to optimize the independent factors which influenced the extraction yield or extract profiles of valuable components of natural materials[22]. The aim of this study was to determine the best extraction conditions of protein from tomato waste and seeds by optimizing extraction parameters. The extraction process was optimized by controlling pH, temperature, time and solvent to solid ratio to maximize protein yield. The second aim was to assess offunctional properties of fat and defatted tomato waste protein and tomato seeds protein.
Abbreviations list
| Response Surface Methodology | RSM | Tomato Seeds Protein | TSP |
| Box-Behnken design | BBD | Water Absorption Capacity | WAC |
| Central Composite design | CCD | Oil Absorption Capacity | OAC |
| Protein Extraction Yield to Defatted Tomato Waste | PEY to DTW | Emulsification Activity Index | EAI |
| Defatted Tomato Waste Protein | DTWP | Emulsification Stability Index | ESI |
| Protein Extraction Yield to Defatted Tomato Seeds | PEY to DTS | Foaming Capacity | FC |
| Defatted Tomato Seeds Protein | DTSP | Foaming Stability | FS |
| Tomato Waste Protein | TWP |
Material and Methods
Material
The chemical reagents and other material that used in study for example NaOH, HCl, Hexane and etc., were purchased from Merck (Merck, Darmstadt, Germany).
Methods
Protein preparation from tomato waste and seeds
Determination of Protein
A titration method (Kjeldahl method)was used for determination of protein concentrates[23]. In this method, the protein content (%) was calculated as Eq. 1 and 2:
Functional Properties
Bulk Density
The bulk density was determined by a scaled plastic centrifuge tube. The samples in six replicate were filled to 25 ml and the tubes were stroked to delete the spaces between the particles.The bulk density was calculated as Eq. 3[24]:

In the above equation W1 is weight of the tube without sample (g), W2 weight of the tube with sample (g), V is volume observed (ml).
Water and Oil Absorption Capacity
The WAC and OAC was determined by using of Shao et al.[4]method with a little modification. For WAC and OAC test, a sample (1 g) was taken in a test tube and mixed with 10 ml of distilled water for
WAC and corn oil for OAC. The tube held in 6 temperature and then theywere centrifuged at 4000×gfor 10 min. Finally, after removed of the supernatant, the tube with the sediment was weighted. The WAC and OAC were calculated as Eq.4[4, 24]

In the above equations W1 is weight of the tube plus the dry sample (g), W2 weight of the tube plus the sediment (g), Ws is weight of the dry sample (g).
Emulsification Properties
The EAIand ESI of protein samples were determined as described by[25, 26]with some modification. First, made of a 0.5% (w/v) protein solution prepared in distillation water and after stirring for 1min with a magnetic stirrer(Heidolph, Germany), the pH of the solution was adjusted to 4-10 with either 0.1 M HCl or NaOH.Then, 4.5 ml of this solution mixed with 1.5 ml of corn oil were homogenized at 4500×g for 1 min. 250 μL of this emulsion was picked out from the bottom at two times (at 0 and 10 min) and diluted with 50 mL of 0.1% sodium dodecyl sulfate solution (NaC12H25SO4) and then vortexed for 10 s. Absorbance of this samples were measured at 500 nm using a UV–visible Spectrophotometer (Biochrom, England). ESI (min) and EAI (m2/g) were calculated using the following Eq.5 and 6
In the above equations A0 is the absorbance of the diluted emulsion instantly after homogenization, A10 is the absorbance of the diluted emulsion 10 min after homogenization, N is the dilution factor (×150), c is the weight of sample per volume (g/mL), φ is the fat volume fraction of the emulsion and t is the time distance (10 min).
Foaming Properties
The FC and FS was determined according to the method described by [4] with minor modifications, 0.5 g of protein was dispersed in 50 ml of distilled water. The pH of the protein solution was regulated to 4,5, 6, 7, 8, 9 and 10 with either 0.1 M HCl or 0.1 M NaOH. The solutions were stirred for 3 min with blender at the maximum speed. The stirred protein solution was instantly transferred into a 100 ml cylinder, then volume was observed before (Vb) and after (Va) stirring. The FC was calculated by the following Eq. 7:

In the above equations Va is volume after stirred, Vb is volume before stirred.
Also, the FS was determined as time (min) required to decline 50 % volume of foam.
Statistical analysis
RSM was used to optimize the protein extraction from tomato waste and tomato seeds.A Box-Behnken design (BBD) was used in the optimization of process variables with five factors at five levels with 50 runs, including 8 central points (condition of the produce: Alkaline pH, x1; Acidic pH, x2; Temperature, x3; Time of extraction, x4; Ratio of solvent to powder, x5) (Table 1). The experimental design and statistical analysis were performed using Design-Expert software (version 8.0.7.1, Stat Ease Inc., Minneapolis, MN, USA). The design included 50 experiments, that adopted by adding 8 central points and this used for estimating the experimental error and a measure of lack-of-fit. [27].
The responses function (Υ) was partitioned into linear, quadratic and interaction. Experimental data were fitted to the second-order regressionEq. 8:

The model sufficiency were checked in terms of the values of R2 and adjusted R2. Analysis of variance (ANOVA) was employed to determine the significance of the models (p<0.05). Verification
of optimized conditions and predicted values were done in triplicate to confirm the validity of the models.
Table 1: Independent variables and their levels used for Box-Behnken design.
| Independent variables | Factors(X) | Levels | ||||
| -2 | -1 | 0 | +1 | +2 | ||
| Alkaline pH | X1 | 10 | 10.5 | 11 | 11.5 | 12 |
| Acidic pH | X2 | 3.1 | 3.4 | 3.7 | 4 | 4.3 |
| Temperature(°C) | X3 | 10 | 20 | 30 | 40 | 50 |
| Time of extraction(min) | X4 | 30 | 40 | 50 | 60 | 70 |
| Solvent to powder ratio(ml/g) | X5 | 1:10 | 1:20 | 1:30 | 1:40 | 1:50 |
Also, for functional properties of protein extracted from TW and TS (bulk density, EAI, ESI, WAC, OAC, FC and FS)data were subjected to analysis of variance (ANOVA) and Duncan’s by using of IBM SPSS Statistics V.22(SPSS Inc., USA),in three replication.
As stated above, the data were analyzed by RSM statistical design for the first phase, then the optimized condition of protein extraction selected for making protein concentrate of DTW and DTS. Then for second phase, the functional tests were used by determine the nature of technological of these proteins and compared with the protein extracts from TW, TS, DTW and DTS in central point condition.
Result and Discussion
Statistical analysis
In this study, BBD was used for RSM with five process variables (pH, temperature, time and solvent to powder ratio) at five levels on protein extraction of TWM and TSM. Designs using BBD are generally more efficient in terms of the number of required runs and so they are less expensive to run compared to CCD. The points of design fall within a safe operating restrict, within the substantivallow and high levels, as BBD does not consist any points at the vertices of the cubic region. This could be useful when the factor-level compositions are expensive or impossible to test because of the physical process restrictions [27].According to the information that presented above, the variation of each response (Y) was evaluated as a function of linear, quadratic and interaction effect of alkaline pH (X1), acidic pH (X2),temperature (X3), time of extraction (X4) and solvent to powder ratio (X5). The results of variance (ANOVA) and coefficients of the models for the responses, along with the corresponding coefficients of determination (R2), adj-R2 and coefficient of variation (CV) are given in Table 2. Multiple linear regression analysis of the experimental data produced second-order polynomial equations for PEY of DTW (%), DTWP(%),PEY of DTS (%) and DTSP (%)as postulated before. The statistical analysis demonstrated that the proposed model was enough, showing no significant lack-of-fit (p>0.05) with satisfactory values of R2 for all responses.
Two different tests, videlicet, sequential model sum of squares and model summary statistic were accomplished to check the sufficiency of the models generated from the obtained data and the results are given in Table 2. Model summary statistics output (Table 2) showed that, for protein extraction of TWM and TSM the values for the R2 and adjusted R2 were the highest compared the other models while the cubic model was disregarded as it is aliased. For quadratic versus 2FI, the ρ value obtained was less than 0.0001which shows strength of significance. The addition of the quadratic term to the mean, linear, and the 2FI terms would only strengthen the model. With the leaving aside of the cubic model, the BBD has sufficient data to interpret the results of the present system[28].The R2 values were 0.8764, 0.8942, 0.8618 and 0.8342 for PEY of DTW, DTWP, PEY of DTS and DTSP, respectively; this showed that a high percentage of response variations were described by the response surface models.
Adjusted R2 is a modification of R2 that adjusts for the number of expository terms in a model. Vice versa R2, the adjusted R2 increases only if the new term improves the model more than would be envisaged by chance. Thus, it is recommended using an adj-R2 to evaluate the model adequacy[29]. In this study, the values of adj-R2 coefficient were rather enough, advocating the significance of the model. The coefficient of variation (CV), which indicates the extent to which data were dispersed, were found to be 9.64%, 3.52%, 6.05% and 4.18% for PEY of DTW, DTWP, PEY of DTS and DTSP, respectively (Table 2). Thus, it can be concluded that the selected model adequately displayed the data for all the responses obtained.
Fig. 1 shows that the polynomial regression model was in agreement with the experimental results. In this figure, each of the observed values is compared to the predicted value calculated from the model.
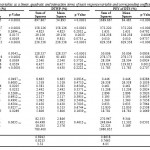 |
Table 2: The ANOVA for the experimental variables as a linear, quadratic and interaction terms of each response variable and corresponding coefficients for the predictive models.
|
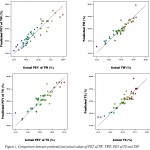 |
Figure 1: Comparison between predicted and actual values of PEY of TW, TWP, PEY of TS and TSP.
|
Determination and Optimization of Protein
According Table 3, the ranges of protein content of DTW, DTS, PEY of DTW and PEY of DTS were 17.34-35.34%, 26.15-43.70%, 37.1-88% and 34.1-63.7%, respectively.
The all over results of the tests done on protein extraction of DTW, DTS and PEY of DTW, PEY of DTS showed that this extraction process was similar to other seeds protein, especially the protein of other tomato variety, soy and chickpea protein[4, 20, 30, 31]. Then, formulation optimized protein extraction; for the maximum of yield and protein content by the Design Expert 7.0.0 software, were accomplished.
Fig. 2 and Fig. 3 showedthe effect of alkaline pH (10-12), temperature (10-50°C), time of extraction (30-70 min) and solvent to powder ratio (1:10-1:50 W/V) in the first phase and acidic pH (3.1-4.3) in the second phase on PEY of DTW %, DTWP %, PEY of DTSP % and DTSP %. In this figures, the interaction between of parameters is viewable on the responses.
By applying the desirability function method, according to formulation with desirability 0.992 to condition of protein extraction with properties mentioned, 12.00 of alkaline pH, 3.73 of acidic pH, 37.73°C of temperature, 60 min of time, 1:40 of ratio were determined; in conditions, PEY of DTW 86.84%; DTWP 35.29%; PEY of DTS 64.15% and DTSP 44.65% were measured.
Liadakis et al.[32] were used of RSM with a central composite design for extraction of tomato seed proteins. In this study optimum condition were temperature: 50°C, pH:11.5, time of mixing:20 min and water/solid ratio: 1:30 w/v. With above condition protein extract yield 66.1%, protein content of product 72.0% and total protein yield 43.6% were calculated. Ma et al.[33] were produced the peanut protein concentrate from defatted peanut flour by ethanol precipitation and separation with centrifuge, then for the extraction of protein they were used of RSM. The optimization condition of protein extract with ratio of liquid-to-solid of 1:11.79 w/v, ethanol of 85 mL/100 mL and temperature of 36.35°C for having highest of protein content were determined. Firatligil-Durmus and Evranuz[34] were used of RSM for extraction of protein from red pepper seed meal. The maximum of yield protein was obtained 96.7% when temperature, pH, mixing time and solvent/meal ratio were 31°C, 8.8, 20 min, 1:21 w/v, respectively. Wani et al.[35] were used RSM in extraction conditions for maximum protein recovery of watermelon seeds. The extraction of protein yield between 72.03 and 81.52 g/100 g. Also, the optimum of protein extraction was obtained when: 0.12 g/L NaOH, 15 min extraction time and 1:70 w/v solvent/powder ratio at 50°C.
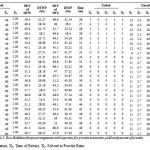 |
Table 3: Box-Behnken design arrangement and responses for protein extraction yield and percent of protein.
|
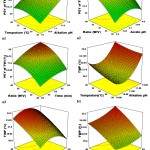 |
Figure 2: The 3d response surface graph for PEY of DTW (a1-3) and DTWP (b1-3) responses.
|
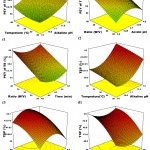 |
Figure 3: The 3d response surface graph for PEY of DTS (c1-3) and DTSP (d1-3) responses.
|
Functional Properties
Functional properties of protein concentrate not only dictate its usage but also the level of its concatenationinto different food products. It might either improve or destroy the quality of food product as well as the storage period. Various functional properties of the meals and concentrates provide sufficient knowledge to predict their optimal utilization.The result of chemical composition analysis of TWM, DTWM, TSM and DTSM are given in Table 4. In continue were evaluated of functional properties for them.
Table 4: Chemical composition of tomato waste and seeds meal.
| Samples (%) | TWM | DTWM | TSM | DTSM |
| Protein | 22.83±1.08 | 27.16±1.23 | 34.42±0.94 | 39.81±1.11 |
| Fat | 9.22±0.51 | —- | 27.65±0.82 | —- |
| Ash | 3.46±0.04 | 4.88±0.08 | 4.91±0.05 | 5.52±0.04 |
| Fiber | 26.12±0.97 | 29.52±0.86 | 31.77±1.05 | 34.68±0.82 |
Bulk Density
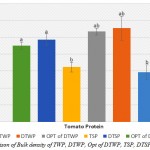 |
Figure 4: Comparison of Bulk density of TWP, DTWP, Opt of DTWP, TSP, DTSP and Opt of DTSP
|
Water and Oil Absorption Capacity
Table 5a: The Water Absorbance Capacity (ml H2O/g) of TWP, DTWP, Opt of DTWP, TSP, DTSP and Opt of DTSP under different temperature.(n=3)
| Temperature(°C) | 25 | 35 | 45 | 55 | 65 | 75 |
| TWP | 4.10±0.361a | 4.73±0.208b | 5.63±0.153c | 6.17±0.252c | 5.73±0.306c | 5.67±0.379c |
| DTWP | 5.10±0.100a | 5.47±0.252b | 6.07±0.252c | 6.50±0.173d | 6.20±0.100cd | 6.00±0.100c |
| Opt of DTWP | 5.33±0.058a | 5.53±0.153a | 6.23±0.153a | 6.20±0.100a | 6.30±0.100a | 5.90±0.100a |
| TSP | 3.10±0.100a | 3.67±0.153b | 4.57±0.153d | 4.93±0.153e | 4.37±0.153cd | 4.27±0.153c |
| DTSP | 3.50±0.100a | 4.80±0.100b | 5.27±0.153c | 5.77±0.115d | 5.40±0.100c | 5.20±0.100c |
| Opt of DTSP | 3.50±0.200a | 4.73±0.115b | 5.47±0.153cd | 5.70±0.265d | 5.47±0.252cd | 5.27±0.153c |
Mean ± S.D. values superscripted with dissimilar letters in rows are significantly different (p< 0.05)
Table 5b: The Oil Absorbance Capacity (ml oil/g) of TWP, DTWP, Opt of DTWP, TSP, DTSP and Opt of DTSP under different temperature.(n=3)
| Temperature(°C) | 25 | 35 | 45 | 55 | 65 | 75 |
| TWP | 1.42±0.015a | 1.47±0.010b | 1.50±0.015b | 1.54±0.015c | 1.48±0.010b | 1.60±0.015d |
| DTWP | 1.45±0.015a | 1.48±0.015ab | 1.56±0.010c | 1.58±0.025cd | 1.51±0.010b | 1.62±0.025d |
| Opt of DTWP | 1.46±0.025a | 1.50±0.015ab | 1.59±0.015c | 1.59±0.010c | 1.53±0.015b | 1.58±0.010c |
| TSP | 1.05±0.050a | 1.12±0.015b | 1.23±0.036c | 1.27±0.015c | 1.21±0.010c | 1.27±0.032c |
| DTSP | 1.26±0.010a | 1.31±0.017ab | 1.34±0.031b | 1.36±0.015b | 1.34±0.055b | 1.46±0.032c |
| Opt of DTSP | 1.28±0.006a | 1.33±0.021ab | 1.36±0.020bc | 1.40±0.015c | 1.36±0.051bc | 1.47±0.021d |
Mean ± S.D. values superscripted with dissimilar letters in rows are significantly different (p< 0.05)
Emulsification properties
Table 6a and b, showed thatthe emulsifying properties (EAI and ESI) of all concentrate (0.5%, w/v; pH 4 to 10) with corn oil were investigated and also, the effects of pH on EAI and ESI were analyzed for protein concentration in above condition. The EAI is an ability to the protein concentrate to emulsion formation. The EAI preparing an approximation of the interfacial area fixated per unit weight of protein based on the turbidity of an emulsion[25, 26]. The results showed that the EAI was increased with the growth of pH and had significant differences between pH 4 to 10. Also, the results showed that between the defatted and fat tomato protein in EAI were slight differences (p<0.05) (Table 6a). The results of Shao et al.[4] were showed that with increased of pH same to present study, EAI were increased. They expressed that the EAI values of SP were the highest (0.539-0.755 AV/mm), and for other test cases, DCTS (0.080-0.951 AV/mm), DHTS and HTS (0.061-0.705 and 0.053-0.527 AV/mm, respectively) were determined. Boye et al.[30] were observed that the EAI for the pulse protein concentrate of 4.6 m2/g for YP-UF (lowest) and 5.7 m2/g for the DC and KC-IEP (highest), however, no significant differences were observed of pulse varieties.
The ESI is the stability of emulsion in a time of stationary period. The results in present study were showed that the ES value increased the pH of 4 to 7 and pH 7 was highest for all of proteins, Opt of DTSP in pH 7 to 46.63 min and TWP to 26.96 min were highest and lowest, respectively (Table 5b). At pH of 3 to 5, which were around protein isoelectric region [32], the EAI and ESI values of samples were the lowest. This was because most of proteins are slightly soluble at their isoelectric pH, weakly hydrated, and absence electrostatic repellent forces[4]. At the outside of this region (4-5), both EAI and ESI increased significantly because of the increase in solubility of protein at high pH, however, enhances in ESI after pH 7 were not so significant. In general decrease and increase in EAI and ESI should be congruous with the pH-dependent of protein solubility and also, EAI depends upon the lipophilic-hydrophilic balance that was affected by changing of pH. Therefore, EAI and ESI were pH-dependent because the alkaline pH improved the emulsion capacity more than acidic pH [40].
Table 6a: The Emulsifier Activity Index of TWP, DTWP, Opt of DTWP, TSP, DTSP and Opt of DTSP under different pH.(n=3)
| pH | 4 | 5 | 6 | 7 | 8 | 9 | 10 |
| TWP | 4.28±0.046a | 5.88±0.070b | 7.14±0.092c | 9.14±0.116d | 12.97±0.148e | 22.82±0.116f | 26.67±0.092g |
| DTWP | 3.82±0.046a | 5.24±0.070b | 6.48±0.116c | 8.74±0.148d | 12.56±0.070e | 21.25±0.70f | 24.04±0.092g |
| Opt of DTWP | 3.78±0.046a | 5.13±0.070b | 6.17±0.122c | 8.55±0.116d | 11.99±0.116e | 22.17±0.053f | 25.39±0.070g |
| TSP | 3.68±0.046a | 4.31±0.070b | 5.96±0.116c | 8.71±0.092d | 15.38±0.092e | 28.94±0.070f | 32.67±0.070g |
| DTSP | 3.24±0.096a | 3.84±0.116b | 5.53±0.046c | 7.97±0.046d | 14.55±0.092e | 24.66±0.070f | 29.63±0.096g |
| Opt of DTSP | 3.10±0.096a | 3.50±0.092b | 5.39±0.046c | 7.74±0.166d | 14.42±0.122e | 24.43±0.116f | 30.98±0.096g |
Mean ± S.D. values superscripted with dissimilar letters in rows are significantly different (p< 0.05)
Table 6b: The Emulsifier Stability Index of TWP, DTWP, Opt of DTWP, TSP, DTSP and Opt of DTSP under different pH.(n=3)
| pH | 4 | 5 | 6 | 7 | 8 | 9 | 10 |
| TWP | 3.10±0.141a | 3.03±0.152a | 10.76±0.580b | 26.96±0.630e | 24.63±1.555d | 24.00±0.709d | 22.65±0.225c |
| DTWP | 3.99±0.085a | 4.64±0.147a | 13.19±0.538b | 32.78±3.283d | 21.10±0.724c | 18.77±0.034c | 20.47±0.460c |
| Opt of DTWP | 4.06±0.570a | 5.25±0.341a | 15.44±1.536b | 34.21±2.191e | 27.37±0.748d | 19.65±0.313c | 20.35±0.226c |
| TSP | 6.00±0.451a | 5.97±0.208a | 18.96±0.493c | 31.69±3.925e | 25.53±1.141d | 16.22±0.177b | 19.11±0.186c |
| DTSP | 5.63±0.542a | 7.48±0.784b | 23.33±0.831d | 40.88±1.204f | 26.46±0.650e | 21.99±0.418c | 21.80±0.379c |
| Opt of DTSP | 5.54±0.604a | 8.54±0.418a | 27.74±0.896c | 46.63±5.282e | 32.30±0.651d | 22.08±0.453b | 19.55±0.124b |
Mean ± S.D. values superscripted with dissimilar letters in rows are significantly different (p< 0.05)
Foaming (Whipping) properties
Table 7a: The Foaming Capacity of TWP, DTWP, Opt of DTWP, TSP, DTSP and Opt of DTSP under different pH. (n=3)
| pH | 4 | 5 | 6 | 7 | 8 | 9 | 10 |
| TWP | 7.69±1.923a | 10.90±1.110b | 14.74±1.110c | 17.95±1.110d | 25.00±1.923e | 30.77±1.923f | 42.31±1.923g |
| DTWP | 9.62±1.923a | 16.67±2.938b | 25.00±1.923c | 32.69±1.923d | 42.31±1.923e | 53.85±1.923f | 68.59±2.938g |
| Opt of DTWP | 13.46±1.923a | 22.44±1.110b | 28.85±1.923c | 39.74±1.110d | 48.08±1.923e | 62.82±4.441f | 73.08±1.923g |
| TSP | 16.67±1.110a | 20.51±1.110a | 30.13±1.110b | 37.82±2.938c | 48.72±2.938d | 58.33±2.9238e | 73.08±5.088f |
| DTSP | 19.23±1.923a | 23.72±2.221ab | 32.05±1.110b | 42.95±2.221c | 58.33±11.268d | 69.87±5.875e | 82.69±3.846f |
| Opt of DTSP | 22.44±1.110a | 35.26±2.938b | 44.23±1.923c | 57.05±2.938d | 67.31±1.923e | 79.49±2.938f | 87.82±1.110g |
Mean ± S.D. values superscripted with dissimilar letters in rows are significantly different (p< 0.05)
Table 7b: The Foaming Stability of TWP, DTWP, Opt of DTWP, TSP, DTSP and Opt of DTSP under different pH. (n=3)
| pH | 4 | 5 | 6 | 7 | 8 | 9 | 10 |
| TWP | 2.33±0.577a | 4.67±0.577b | 11.33±1.528c | 15.67±0.577d | 19.00±0.000e | 21.67±0.577f | 25.00±1.000g |
| DTWP | 3.33±0.577a | 6.33±0.577b | 13.00±1.000c | 21.33±1.528d | 25.33±1.155e | 29.33±1.528f | 33.33±1.528g |
| Opt of DTWP | 4.33±0.577a | 7.33±0.577b | 13.67±1.155c | 24.00±2.000d | 27.67±1.528e | 32.00±2.000f | 35.67±2.082g |
| TSP | 3.00±0.000a | 5.33±0.577b | 12.67±0.577c | 16.00±1.000d | 20.00±0.000e | 24.00±1.000f | 26.67±1.528g |
| DTSP | 4.67±0.577a | 7.33±0.577b | 15.33±0.577c | 25.00±1.000d | 30.00±1.000e | 34.33±1.528f | 37.67±1.528g |
| Opt of DTSP | 5.67±0.577a | 9.33±0.577b | 17.00±1.000c | 28.00±1.000d | 32.33±1.528e | 36.67±2.082f | 42.00±3.000g |
Mean ± S.D. values superscripted with dissimilar letters in rows are significantly different (p< 0.05)
Conclusion
Response surface methodology technique demonstrated to be a useful tool in organizing optimum conditions for extracting tomato waste and seed protein. Protein was extracted from fat and defatted tomato waste and seeds powder with 50 selected combinations of temperature, pH (alkaline and acidic phase), extraction time and solvent to powder ratio. The experimental value of protein content for DTW 37.34-55.34%, DTS 41.15-58.70% and protein extraction yield of DTW 37.12-88.04% and DTS 34.1-63.7% were determined. The second order model developed for PEY of DTW, DTWP, PEY of DTS and DTSP represented a non-significant value for lack of fit and semi high value for the coefficient of determination (R2). The variables with the largest effect were the alkaline pH, temperature and solvent to powder ratio. The optimum condition for extraction of DTW and DTS could be achieved in alkaline pH 12, acidic pH 3.73, temperature 37.73°C, time of extraction 60 min and solvent to powder ratio 1:40. These conditions resulted in PEY of DTW 86.84%; DTWP 35.29%; PEY of DTS 64.15% and DTSP 44.63%.
Also, the present study shows that the functional properties of tomato waste and seed protein concentrates were evaluated to assess their effective use in food systems.However, the functional properties (Bulk density, WAC and OAC, EAI and ESI, FC and FS) on TWP, DTWP, Opt of DTWP, TSP, DTSP and Opt of DTSP were determined. The TWP and TSP were lowest between the other samples in Bulk density. In WAC test, all of the samples were increased to 55°C and after a little decreased. For OAC test, all of the samples with increases to temperature were increased. The emulsifier properties (EAI and ESI) with increases in pH were increased but the ESI value was highest at pH 7 for all samples. Also, the foaming properties (FC and FS) had significantly increased with the growth of pH (p<0.05).
References
- Ray, R.C., El Sheikha, A.F., Panda, S.H., and Montet, D. Anti-oxidant properties and other functional attributes of tomato: An overview. International Journal of Food and Fermentation Technology. 2011. 1(2): p. 139-148.
- Kaur, D., Wani, A.A., Oberoi, D., and Sogi, D. Effect of extraction conditions on lycopene extractions from tomato processing waste skin using response surface methodology. Food chemistry. 2008. 108(2): p. 711-718.
CrossRef - Arabani, A.A., Hosseini, F., Abbaspour, F., and Anarjan, N. The effects of ultrasound pretreatment processes on oil extraction from tomato wastes. International Journal of Biosciences (IJB). 2015. 6(4): p. 8-15.
- Shao, D., Atungulu, G.G., Pan, Z., Yue, T., Zhang, A., and Fan, Z. Characteristics of isolation and functionality of protein from tomato pomace produced with different industrial processing methods. Food and Bioprocess Technology. 2014. 7(2): p. 532-541.
CrossRef - Stajčić, S., Ćetković, G., Čanadanović-Brunet, J., Djilas, S., Mandić, A., and Četojević-Simin, D. Tomato waste: Carotenoids content, antioxidant and cell growth activities. Food chemistry. 2015. 172: p. 225-232.
CrossRef - Fahimdanesh, M. and Bahrami, M.E. Evaluation of physicochemical properties of Iranian tomato seed oil. Journal of Nutrition & Food Sciences. 2013.
CrossRef - FAOSTAT. Crop Statistics. 2015 Accessed 30 Dec 2015.; Available from: Available at http://faostat3.fao.org/download/Q/QC/E.
- WPTC. (World Processing Tomato Council). 2016; Available from: www.wptc.to.
- Donkor, A., Osei-Fosu, P., Nyarko, S., Kingsford-Adaboh, R., Dubey, B., and Asante, I. Validation of QuEChERS method for the determination of 36 pesticide residues in fruits and vegetables from Ghana, using gas chromatography with electron capture and pulsed flame photometric detectors. Journalof Environmental Science and Health, Part B. 2015. 50(8): p. 560-570.
CrossRef - Strati, I.F. and Oreopoulou, V. Effect of extraction parameters on the carotenoid recovery from tomato waste. International Journal of Food Science & Technology. 2011. 46(1): p. 23-29.
CrossRef - Schieber, A., Stintzing, F., and Carle, R. By-products of plant food processing as a source of functional compounds—recent developments. Trends in food science & technology. 2001. 12(11): p. 401-413.
CrossRef - Sogi, D., Bhatia, R., Garg, S., and Bawa, A. Biological evaluation of tomato waste seed meals and protein concentrate. Food chemistry. 2005. 89(1): p. 53-56.
CrossRef - Sogi, D., Arora, M., Garg, S., and Bawa, A. Fractionation and electrophoresis of tomato waste seed proteins. Food chemistry. 2002. 76(4): p. 449-454.
CrossRef - Zuknik, M.H., Norulaini, N.N., and Omar, A.M. Supercritical carbon dioxide extraction of lycopene: A review. Journal of Food Engineering. 2012. 112(4): p. 253-262.
CrossRef - Kramer, A. and Kwee, W. Functional and nutritional properties of tomato protein concentrates. Journal of Food Science. 1977. 42(1): p. 207-211.
CrossRef - Sogi, D., Bawa, A., and Garg, S. Sedimentation system for seed separation from tomato processing waste. Journal of food science and technology. 2000. 37(5): p. 539-541.
- Chug-Ahuja, J.K., Holden, J.M., Forman, M.R., Mangels, A.R., Beecher, G.R., and Lanza, E. The development and application of a carotenoid database for fruits, vegetables, and selected multicomponent foods. Journal of the American Dietetic Association. 1993. 93(3): p. 318-323.
CrossRef - Fraser, P.D. and Bramley, P.M. The biosynthesis and nutritional uses of carotenoids. Progress in lipid research. 2004. 43(3): p. 228-265.
CrossRef - Moayedi, A., Hashemi, M., and Safari, M. Valorization of tomato waste proteins through production of antioxidant and antibacterial hydrolysates by proteolytic Bacillus subtilis: optimization of fermentation conditions. Journal of food science and technology. 2016. 53(1): p. 391-400.
CrossRef - Khodaparast, M.H.H., Nikzade, V., and Piraieshfar, B. Feasibility Assessment of Protein Concentrate From Tomato Processing Wastes and Determination of Its Functional Properties. Iranian Food Science and Technology Research Journal. 2011. 7(2): p. 108-114.
- Sogi, D., Garg, S., and Bawa, A. Functional Properties of Seed Meals and Protein Concentrates From Tomato‐processing Waste. Journal of Food Science. 2002. 67(8): p. 2997-3001.
CrossRef - Wang, C., Shi, L., Fan, L., Ding, Y., Zhao, S., Liu, Y., and Ma, C. Optimization of extraction and enrichment of phenolics frompomegranate (Punica granatum L.) leaves. Industrial Crops and Products. 2013. 42: p. 587-594.
CrossRef - Kenkel, J., Analytical chemistry for technicians. CRC Press. 2010.
- Ogunwolu, S.O., Henshaw, F.O., Mock, H.-P., Santros, A., and Awonorin, S.O. Functional properties of protein concentrates and isolates produced from cashew (Anacardium occidentale L.) nut. Food chemistry. 2009. 115(3): p. 852-858.
CrossRef - Karaca, A.C., Low, N., and Nickerson, M. Emulsifying properties of chickpea, faba bean, lentil and pea proteins produced by isoelectric precipitation and salt extraction. Food Research International. 2011. 44(9): p. 2742-2750.
CrossRef - Pearce, K.N. and Kinsella, J.E. Emulsifying properties of proteins: evaluation of a turbidimetric technique. Journal of Agricultural and Food Chemistry. 1978. 26(3): p. 716-723.
CrossRef - Montgomery, D.C., Design and analysis of experiments. John Wiley & Sons. 2008.
- Kumar, A., Prasad, B., and Mishra, I. Optimization of process parameters for acrylonitrile removal by a low-cost adsorbent using Box–Behnken design. Journal of Hazardous Materials. 2008. 150(1): p. 174-182.
CrossRef - Koocheki, A. and Kadkhodaee, R. Effect of Alyssum homolocarpum seed gum, Tween 80 and NaCl on droplets characteristics, flow properties and physical stability of ultrasonically prepared corn oil-in-water emulsions. Food Hydrocolloids. 2011. 25(5): p. 1149-1157.
CrossRef - Boye, J., Aksay, S., Roufik, S., Ribéreau, S., Mondor, M., Farnworth, E., and Rajamohamed, S. Comparison of the functional properties of pea, chickpea and lentil protein concentrates processed using ultrafiltration and isoelectric precipitation techniques. Food Research International. 2010. 43(2): p. 537-546.
CrossRef - Boye, J., Zare, F., and Pletch, A. Pulse proteins: processing, characterization, functionalproperties and applications in food and feed. Food Research International. 2010. 43(2): p. 414-431.
CrossRef - Liadakis, G.N., Tzia, C., Oreopoulou, V., and THOMOPOULOS, C.D. Protein isolation from tomato seed meal, extraction optimization. Journal of Food Science. 1995. 60(3): p. 477-482.
CrossRef - Ma, T., Wang, Q., and Wu, H. Optimization of extraction conditions for improving solubility of peanut protein concentrates by response surface methodology. LWT-Food Science and Technology. 2010. 43(9): p. 1450-1455.
CrossRef - Firatligil-Durmus, E. and Evranuz, O. Response surface methodology for protein extraction optimization of red pepper seed (Capsicum frutescens). LWT-Food Science and Technology. 2010. 43(2): p. 226-231.
CrossRef - Wani, A.A., Kaur, D., Ahmed, I., and Sogi, D. Extraction optimization of watermelon seed protein using response surface methodology. LWT-Food Science and Technology. 2008. 41(8): p. 1514-1520.
CrossRef - Liadakis, G.N., Tzia, C., Oreopoulou, V., and Thomopoulos, C.D. Isolation of tomato seed meal proteins withsalt solutions. Journal of Food Science. 1998. 63(3): p. 450-453.
CrossRef - Kinsella, J.E. and Melachouris, N. Functional properties of proteins in foods: a survey. Critical Reviews in Food Science & Nutrition. 1976. 7(3): p. 219-280.
CrossRef - Mao, X. and Hua, Y. Composition, structure and functional properties of protein concentrates and isolates produced from walnut (Juglans regia L.). International journal of molecular sciences. 2012. 13(2): p. 1561-1581.
CrossRef - Rahma, E., Moharram, Y., and Mostafa, M. Chemical characterization of tomato seed proteins (Var Pritchard). Egyptian Journal of Food Science. 1986. 14: p. 221-230.
- El Nasri, N.A. and El Tinay, A. Functional properties of fenugreek (Trigonella foenum graecum) protein concentrate. Food chemistry. 2007. 103(2): p. 582-589.
CrossRef - Kaur, M. and Singh, N. Characterization of protein isolates from different Indian chickpea (Cicer arietinum L.) cultivars. Food chemistry. 2007. 102(1): p. 366-374.
CrossRef - Fidantsi, A. and Doxastakis, G. Emulsifying and foaming properties of amaranth seed protein isolates. Colloids and Surfaces B: Biointerfaces. 2001. 21(1): p. 119-124.
CrossRef - Deep Singh, G., Wani, A.A., Kaur, D., and Sogi, D.S. Characterisation and functional properties of proteins of some Indian chickpea (Cicer arietinum) cultivars. Journal of the Science of Food and Agriculture. 2008. 88(5): p. 778-786.
CrossRef - Obatolu, V., Fasoyiro, S., and Ogunsunmi, L. Processing and functional properties of yam beans (Sphenostylis stenocarpa). Journal of food processing and preservation. 2007. 31(2):p. 240-249.
CrossRef
Accepted on: 04 April 2016


![]()
![]()
