
Intellectual disability- Challenge for society
Department of Genetics, Maharshi Dayanand University, Rohtak. Haryana, India.
Corresponding Author E-mail: ritugenetics@gmail.com
DOI : http://dx.doi.org/http://dx.doi.org/10.13005/bbra/1059
Download this article as:
Introduction
Intellectual disability is a common disorder, which imposes a large medical, psychological and social burden. It affects about 3% of the population, yet the pathogenesis is poorly understood (Birch et al., 1970 and Curry et al., 1997). Intellectual disability is described as below average general intellectual function with associated deficits in adaptive behaviour that occur before age of 18 (Van et al., 2005). It exists with the limitation in two or more areas like communication, self-care, home living, social skills, community living, self-direction, health, functional academics, leisure and work (AAMR, 1992). A family may suspect intellectual disability if motor skills, language skills and self help skills do not seem to be developing in a child or are developing at a slower rate than child’s peers. People who are intellectual disabled function at an intellectual level that is below average, have difficulties with learning and daily living skills. ICD-10 characterizes intellectual disability as condition resulting from failure of mind to develop completely. The degree of impairment of intellectual disability has a wide range, it is generally divided into mild (IQ 50-70), moderate (IQ 35-50) and severe (IQ 20-35). Those cases in which the IQ is below 20 are occasionally defined as profound (Battaglia et al., 1999 and Chiurazzi, 2000). These categories of intellectual disability are based on scores obtained through use of age standardized tests of cognitive ability (WHO, 1993). Intellectual disability is significantly sub average intellectual functioning present from birth or early infancy, causing limitations in the ability to conduct normal activities of daily living. A person with intellectual disability has significantly below average intellectual functioning. It limits the ability to cope with two or more activities of normal daily life. Intellectual disability is a symptom with multiple etiologies including chromosomal abnormalities, genetic defects and intrauterine, prenatal, neonatal and postnatal causes.
Intellectual disability is a life long disability that presents in infancy or the early childhood years but it cannot be diagnosed until the child is older than 5 years, when standardized measures of intelligence become reliable and valid. The American association on intellectual disability defines intellectual disability by measures of 3 domains, Intelligence IQ, adaptive behaviour and system of supports (AAMR, 2002). Intellectual disability is attributing to any condition that impairs development of the brain before birth, during birth or in the childhood years (The Arc, 1993).50% of the people with intellectual disability has been found to posses more than one causal factors (AAMR, 1992).
Historical Perspective
Individuals with developmental disabilities have been dependent on the customs and beliefs of the era and the culture or locale. In ancient Greece and Rome, infanticide was a common practice. By the second century A.D. individuals with disabilities, including children who lived in the Roman Empire were frequently sold to be used for entertainment or amusement. (Sheerenberger, 1983).
During the Middle Ages (476 – 1799 A.D.), the status and care of individuals with intellectual disability varied greatly. Although more human practices evolved (i.e., decreases in infanticide and the establishment of foundling homes), many children were sold into slavery, abandoned, or left out in the cold. Toward the end of this era, in 1690, John Locke published his famous work entitled An Essay Concerning Human Understanding. He believed that an individual was born without innate ideas (Doll, 1962).He emphasized the importance of learning through the senses.
Over the next 50 years, two key developments occurred in the United States: residential training schools were established in most states (19 states operated and 9 privately operated) by 1892, and the newly developed test of intelligence developed by Binet was translated in 1908 by Henry Goddard. In 1935, Edgar Doll developed the Vineland Social Maturity Scale to assess the daily living skills/adaptive behavior of individuals suspected of having Intellectual disability. Psychologists and educators now believed that it was possible to determine who had Intellectual disability and provide them with appropriate training in the residential training schools. The United States Congress passed the Education for the Handicapped Act in 1975, now titled the Individuals with Disabilities Education Act. This Act guaranteed educational services to children with disabilities age 3 through 21 and provided incentives for states to develop infant and toddler service delivery systems. Today, most states guarantee intervention services to children with disabilities between birth and 21 years of age.
Seguin developed a comprehensive approach to the education of children with intellectual disability, known as the Physiological method (Sheerenberger, 1983). Assuming a direct relationship between the senses and cognition, his approach began with sensory training including vision, hearing, taste, and smell and eye-hand coordination. The curriculum extended from developing basic self-care skills to vocational education with an emphasis on perception, coordination, imitation, positive reinforcement, memory and generalization.
Definition
An early classification scheme proposed by the American Association on Mental Deficiency Retardation in 1910, individuals with Intellectual disability as feeble-minded, meaning that their development was halted at an early age it difficult to keep pace with peers and manage their daily lives independently (Committee on Classification, 1910). The American Association on Mental Deficiency Retardation (AAMR) proposed and adopted a three part definition in 1959. “Intellectual disability refers to sub average general intellectual functioning which originates in the developmental period and is associated with impairment in adaptive behavior” (Heber, 1961). This definition included the three components of low IQ (<85), impaired adaptive behavior and origination before age 16. Only IQ and age of onset were measurable with the existing psychometric techniques. Deficits in adaptive behavior were generally based on subjective interpretations by individual evaluators even though the Vineland Social Maturity Scale was available (Sheerenberger, 1983). A five level classification scheme was introduced replacing the previous three level systems which had acquired a very negative connotation. The generic terms of borderline (IQ 67-83), mild (IQ 50-66), moderate (IQ 3-49), severe (16-32), and profound (IQ <16) were adopted.
The most recent change in the definition of Intellectual disability was adopted in 1992 by the American Association on Intellectual disability. “Intellectual disability refers to substantial limitations in present functioning. It is characterized by significantly sub average intellectual functioning, existing concurrently with related limitations in two or more of the following applicable adaptive skill areas: communication, self-care, home living, social skills, community use, self-direction, health and safety, functional academics, leisure and work. Intellectual disability manifests before age 18” (American Association on Intellectual disability AAMR, 1992). According to AAMR 1992 definition, the diagnosis of Intellectual disability person displays the following three characteristics.
The person’s intellectual functioning level is appox. 70 to 75 or below.
There are related limitations in two or more applicable adaptive skill areas.
The age of onset in 18 years or below. The adaptive behavior is quality of everyday performance in coping with environmental demands.
The quality of general adaptation is mediated by the level of intelligence and two concepts overlaps (AAMR 1992).
Educational Classifications
DSM-IV
DSM-IV attempts to blend the 1977 and 1992 definitions that were put forth by the American Association on Intellectual disability. It adopts the 1992 definition, but retains the severity level classification scheme from the 1977 definition. The upper IQ limit is 70, and an individual must have delays in at least two of the 10 areas outlined in the 1992 definition.
ICD-10
ICD-10 is the tenth revision of the International Classification of Diseases (World Health Organization, 1993). It is currently in use in some countries around the world but was not adopted for use in the United States until after the year 2000. ICD-10 characterizes Intellectual disability as a condition resulting from a failure of the mind to develop completely. ICD-10 also supports the idea of dual diagnosis, suggesting that Intellectual disability may be accompanied by physical or other mental disorders. Four levels of Intellectual disability are specified in ICD-10: F70 mild (IQ 50 – 69), F71 moderate (IQ 35 – 49), F72 severe (IQ 20 – 34), and F73 profound (IQ below 20). IQ should not be used as the only determining factor. Clinical findings and adaptive behavior should also be used to determine level of intellectual functioning.
Epidemiology
Baroff (1991) suggested that only 0.9% of the population can be assumed to have intellectual disability. Following a review of the most recent epidemiological studies, McLaren and Bryson (1987) reported that the prevalence of intellectual disability was approximately 1.25% based on total population screening. It is estimated that approximately 89% of these children have mild intellectual disability, 7% have moderate intellectual disability, and 4% have severe to profound intellectual disability and it appears to increase with age up to about the age of 20, with significantly more males than females identified.
Serious intellectual disability with a childhood an intelligence quotient below 50 and deficits in adaptive behavior, prevalence is remarkably constant between 3 and 5 per 1,000 children, socio economic conditions or across populations. Mild intellectual disability as all intelligence quotient in the range of 50-70 with deficits in adaptive behavior, prevalence in developed countries is highly variable, ranging across populations from low as 2/1,000 to high as 40/1,00. It is strongly associated with low socio economic status (Kiely et al, 1987, Chen et al, 1993; Durkin MS et al, 1998).
Penrose classical investigations in prevalence of intellectual disability revealed that the IQ of 10 to 14 years old children without organic impairment was normally distributed with mean IQ of 100 and SD 15.There was theoretical prevalence of 0.3% in IQ < 50, 2.3% for 50-70 and 25% for 70-75 (Hagberg et al, 1981, Hagberg et al, 1981, 1981, Hagberg et al, 1983).
In Literature review prevalence rates for severe intellectual disability (IQ <50) is center for true average value 3-3.8 per 1000 which coincides the theoretical rate 0.3% of severe intellectual disability [WHO, 1986, Roeleveld et al, 1997). Prevalence of Mild intellectual disability in Swedish school children is 0.4% and low prevalence in Sweden due to high general socio-economic level. (Hagberg et al, 1981, 1983). The progress in economic, social and technical during those years have resulted in progressively increasing mean IQ and low prevalence of mild intellectual disability (Hagberg et al, 1981).
Prevalence of intellectual disability estimated at 12.5/1000 for suwon area, Korea. In the United States, it is between 41.66/1000 in South Carolina (McDermott, 1994) and 12.0 and 1000 among 10 yrs old children in metropolitan Atlanta (Murphy et al, 1995). There were sufficient evidences that 3% of children of school age were intellectual disabled which could have been prevented (Roeleveld et al, 1997). The combined prevalence of intellectual disability and or development disabilities from 1994/1995 National Health interview survey in united states 14.9 per 1000 (Larson et al, 2001). Prevalence of Intellectual disability is developing countries is much higher than developed countries (WHO, 1986, Roeleveld et al, 1997) Pilot studies of severe Intellectual disability conducted in selected populations in Pakistan and India have reported extra ordinarily high prevalence estimates in the range of 12-24/1,000 (Hasan et al, 1981, Narayanan 1981, Belmant L, 1986). According to reports from developing countries, the prevalence of Intellectual disability at 19.0/1000 for serious retardation and 65.3/1000 children for mild retardation (Durkin et al, 1998). The prevalence of serious intellectual disability is 2to 9 years old children was 5.9/1000 which is slightly higher than prevalence range observed in developed countries and the prevalence of mild retardation was found with in the range observed in developed countries 14.4/1000 (Islam et al, 1993). The prevalence rates of mild/ serious retardation in Karachi were significantly associated with low socioeconomic status& consanguinity. Sixty percent of children were from consanguineous unions (Shamis et al, 1989, Darr et al, 1998,).
The prevalence of moderate to severe retardation (IQ<50) is 30 to 55 per 10,000 and mild handicap (IQ 50-70) is present in about 2% of the population (Roeleveld et al., 1997). In U.K about 1.5 million people have an IQ<70 (Penrose, 1988). Prevalence estimates vary geographically, likely as a result of socioeconomic deprivation and other health problems related to poverty.
Prevalence of moderate to severe intellectual disability was 30 to 55 per 10,000 and of mild handicap 2% of the population reported (Roeleveld, 1997). Reports from Yokohoma city revealed 75 cases of mild intellectual disability and 262 cases of severe /moderate intellectual disability (Akiko, 1998). Study from Finland found 77 children of severe intellectual disability and 74 of mild intellectual disability (Matilainen, 1995). Prevalence of severe intellectual disability as 19.5/1000 and of mild intellectual disability as (65. 3/1000) was reported in Pakistan (Durkin et al., 1998). Studies from Bangladesh reported prevalence of severe intellectual disability as 5.9/1000 (Durkin, 2000) (Table-1). Observed difference in the prevalence of mild, moderate and severe group may be due to variable risk factors including environment.
Table 1: Percentage frequency of IQ in different studies
| Studies | Mild | Moderate + Severe |
| Islam et al., 1993 | 49 | 50. 9 |
| Matilainen et al., 1995 | 22. 25 | 77. 7 |
| Roeleveld, 1997 | 65. 3 | 19. 5 |
| Durkin et al., 1998 | – | 5. 9 |
| Akiko et al., 1998 | 2 | 30 to 55 |
Life expectancy
Intellectual disability coexists with many serious physical problems. Life expectancy of intellectual disabled persons depends upon specific condition of children. In general, more severe the retardation the child has physical problem, shorter the life. Child with mild intellectual disability has a relatively normal life expectancy. Studies have shown that those with severe to profound intellectual disability have a shortened life expectancy due to diseases associated with different degree of retardation (Patricia &Jacobs et al, 1978).
Children with intellectual disability are generally at increased risk of mortality (Eryman et al, 1990). The mortality rate of children with disabilities is higher in Bangladesh than in Pakistan. Thus mortality differential between Pakistan and Bangladesh explain the lower prevalence of Intellectual disability in Bangladesh relative to Pakistan.
Intellectual disability coexists with many serious physical problems. Life expectancy of Intellectual disabled persons depends upon specific condition of children. In general with more severe retardation the child has more physical problem and shorter life. Child with mild intellectual disability has a relatively normal life expectancy. Studies have shown that those with severe to profound intellectual disability have a shortened life expectancy due to disease that is often associated with this degree of retardation (Jacobs et al, 1978). In most cases, it is a life long condition.
Sex ratio
Male to female ratio for severe intellectual disability is remarkably constant and this indicates a 20% excess of males. There were reports of comparable male to female ratio for mild Intellectual disability i.e. 40% excess of males in the Netherlands to 80% excess in Sweden (Hagberg et al, 1981)
Previous study reported the Intellectual disability of unknown etiology in Korea was more common in males and the male to female ratio was 3:1[1:0.3; 22]. This reflects a difference in registration and Identification procedure but also indicate a greater susceptibility of male central nervous system (Young et al, 2002)
Sex ratio of 16 children was 1:0.6 and showed a male prepondence among Intellectual disability children. There was no significant difference in mean IQ scores between boy and girls (p>0.05) (Vim et al, 2002).
Determination of the sex ratios in the literature did not specify the gender distribution in relation to diagnosis. Whereas studies from Finland reported almost equal male to female ratio (Maltilainen et al, 1995). Reports from California detected 1. 7:1 ratio (Lisa et al, 2001). In a Korean study, sex ratio of the children with intellectual disability was 1:0. 6, there was 40% excess of males (Young et al, 2002). In another study male to female ratio for severe intellectual disability showed 20% excess of males (Young et al, 2002). Male to female ratios for mild intellectual disability is ranging from 40% excess of males in the Netherlands to an 80% excess in Sweden (Hagberg et al, 1981). More ever the higher male female ratio might reflect a difference in registration and identification procedures. However significant excess of affected males in the present study strongly suggest additional potentially important, contribution from non specific X linked intellectual disability.
Dysmorphic examination
The etiology of Intellectual disability was due to abnormal development of CNS or presence of minor anomalies on the surface examination (Smith and Bostian, 1964).
In the view of the excessive physical stigmata Morooka (1971) stressed the importance of prenatal factors in a group of patients with obscure cause. Association of intellectual disability and congenital malformation has long been recognized and necessary component of evaluation of child with idiopathic Intellectual disability is a comprehensive dysmorphologic examination (Schaefer and Bodensteiner, 1992).
The diagnosis was more significant when patient have an unusual appearance and number are small. The presence of a major malformation did not increase the diagnostic rate (Hunter AG, 2000). The basis of physical examination, diagnosis was established in 1 of 30 patients (Karnebeek et al, 2002).The diagnosis of pathogenesis identified in 80% of all patients. Half were diagnosed by history and physical examination alone. (Battaglia and Carey, 2003).The diagnosis with global development delays was 63.3%.History and physical examination alone diagnosis 18.4% (Majnemer and Shevell, 1995)
Study of 99 children with GDD and 44, an etiology was determined (Shevell et al, 2000). 38.6% had diagnosis made by history and physical examination alone. Presence or absence of unusual features helps in investigation to steer further diagnosis studies. The use of more specific and diagnostic approaches will lead to better clarification of the etiology (Yoshifumi and Kodama, 1982).
Numerical results on the resulting diagnostic yield cannot be derived from these studies. In larger groups of patients, the number of two or more dysmorphic features found was from high 39.4% (Hunter, 2000) to very high 55.0% (Ohdo,1992). Importance of physical examination, including paediatric, neurological, and dysmorphological examinations was reported in a study (Van et al, 2002). There were a limited number of studies that reported on the percentage of patients with abnormal physical features in their population. Ohdo et al. reported the presence in 55%; Majnemer et al. in 44.5% ; Hunter in 39.4% and Van et al. in 81.9% population. It was expected that the physical examination would be the most important determinant of diagnostic success and this observation has been made by others (Battaglia et al, 1999 and Saul et al, 1996).
Analysis of dysmorphic features or development of milestones can be used for assessment of a mentally retarded child rather than a diagnosis tool or service because no cross tables could be gathered. Different studies of dysmorphological examination were performed in such a different way or the data was presented in such a different manner that pooling of results was not feasable or useful. However there were few parameters of similar results for a general dysmorphological evaluation. Presence of dysmorphic features within the families or other family members with intellectual disability reported in a number of studies (Sinclair, 1973; Matilainen et al, 1995; Stromme, 2000; Tan et al, 2000 and Van et al, 2002).
Development delay
The prevalence of development delay is estimated at 1% to 3% based on the rate quoted for Intellectual disability (Shevell et al, 2003).
Developmental screening or surveillance identifies those who need further evaluation and referral for services. The proportion of children having developmental depends on the psychometric characteristics of the methods, including sensitivity and specificity of the screening test (Blackman, 1992). Development delay might be considered as a set of symptoms and signs for which a variety of etiologies are known. The yield of etiologic evaluation of children with DD/MR varies widely 10% to 81% (Curry et al, 1997, Van Karnebeek et al, 2002 Shevell et al, 2003, Van Karnebeek et al, 2005).A large number of variables currently affects the physician’s evaluation process (Curry et al, 1997). Diagnosis of child is diagnostic algorithm; there are few systematic studies of the process of evaluation (Shevell et al, 2003). Karnebeek et al emphasizes the importance of the clinical history, family history and diagnostic skill of the clinical geneticist. Global development delay is a subset of developmental disabilities and significant delay in two or more developmental domains (gross/fine motor, cognition, speech/language, personal/social or activities of daily living (Simeonsson, 1992, Majnemer et al, 1995). Motor milestones are excellent indicators of various skills but poorly correlate with intellectual functioning. Language and delay milestones in infancy provide the best insight into intellectual potential and it is independent of motor skills.
Global developmental delay describes a clinical presentation with a great number of underlying causal factors. Accurate diagnosis of etiology has specific implication regarding treatment. Management of possible associated condition, prognosis, and estimation of recurrence risk and the design of prevention program (Shevell, 1998). Developmental surveillance is an integral component of a primary care medical home and there is great importance of early identification and child referral with developmental delays (John and Moeschler, 2006).
Etiology
The etiology remains unknown in about half of the Intellectual disabled cases, despite thorough clinical & laboratory investigation. Exogenous causes vary 18.6% to 44.5%, genetic causes vary 17.4% to 47.1% and the etiology remains unknown in 4.3% to 8.3%. The causes of Intellectual disability can be established in less than half of the cases. An important cause has been shown to be chromosomal rearrangements that result in segmental aneuploidy and alter the dosage of developmental genes (Joyce et al, 2001).
An association between full term low birth weight and intellectual disability has been observed during recent years. There was an increased frequency of chromosomal disorders among Intellectual disabled persons having low birth weight in comparison with those Intellectual disabled persons, who had birth weight within the normal range. The risk was higher for very low birth weight (<1500g) in children. It was high for moderately low birth weight (1500-2400g) children, and higher for severe Intellectual disability (IQ<500) than for mild Intellectual disability (50-70 IQ) (Mervis et al, 1995).
Number of articles reports prenatal screening as well as developmental follow up of neonates for well known causes of intellectual disability. In a Japnese study 15% prenatal, 8% perinatal and 12% postnatal causes were reported (Figure-1). Reason of intellectual disability was uncertain in 65% (Akiko, 1998). Study from Finland reported prenatal risk factors in 22%, perinatal in 1% and postnatal in 3% cases of intellectual disability. Uncertain reason was reported in 74% cases (Figure- 2).
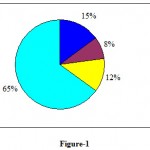 |
Figure 1
|
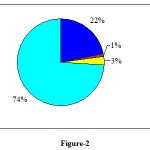 |
Figure 2
|
Studies from California reported that small infants were at increased risk for mild and severe intellectual disability (Lisa, 2001). In population of Finnish children, no significant difference was seen in birth weight of children with intellectual disability and of normal children (Rantakallio et al, 1985). There were reports of low birth weight of children (4. 6%) with IQ less than 70 (Stewart, 1989). Occurrence of low percentage may be due the development of neonatal medicine that has enabled low birth weight children to recover from their initial delay and grow up healthy and normal. Thus low birth weight is not currently considered as a cause of intellectual disability.
Figure-1
Figure-2
Epidemiological studies have identified many candidates for extrinsic factors including smoking, alcohol intake, maternal irradiation, fertility drugs, oral contraceptive and spermicides (Ghaliband and Issac, 1991; and lamb et al, 2005). Among the undiagnosed who are apparently cytogenetically normal these may be substantial proportion with a genetic cause which molecular technique could identify (Fryns, 1990). Causes of Intellectual disability can be roughly divided in to following categories:-
Chromosomal abnormalities: errors of chromosome numbers (Down’s syndrome), defects in chromosome or chromosomal inheritance (fragile X syndrome), chromosomal translocation, deletion, (cri du chat syndrome).
Genetic abnormalities and inherited metabolic disorders: galactosemia, Tay-sachs diseases, phenylketonuria.
Metabolic: congenital hypothyroidism, very high bilirubin levels in babies’ hypoglycemia.
Toxic: intrauterine exposure to alcohol, cocaine, amphetamine and other drugs, methylmercury poisoning, lead poisoning.
Malnutrition
Infections: congential and postnatal
Environmental: poverty, low socioeconomic status, deprivation syndrome.
Trauma: prenatal and postnatal
Unexplained
Other risk factors responsible for Intellectual disability have also been reported. Maternal smoking during pregnancy was associated with slightly more than 50% increase in the prevalence of idiopathic intellectual disability was reported (Drews et al, 1996).Maternal hypertension during pregnancy was associated with a relative risk of Intellectual disability in the offspring of 6.1 with 95% confidence interval of 1.3-28.9 (Salonen et al, 1984).
High incidence of Intellectual disability and relatively lower mortality rates have led to a higher detection rates of aminoaciduria and mucopolysaccharidosis than in the case of other lysosomal storage disorder (Talukder and Sharma, 1979). Rao (1980) reported 5 cases of phenlketonuria out of 414 children with mental defects. The associations between epilepsy and intellectual disability or cerebral palsy cases are well recognized.
Lower than expected risk for Intellectual disability was found among children of teachers & health care professional in a Norwegians population (Stromme, 2000). A strong positive association between Intellectual disability and maternal employment in the textile industry was reported (Decoufl et al, 1993).
A variety of disorders are associated with Intellectual disability such as epilepsy, cerebral palsy, vision and hearing impairments, speech/language problems and behavior problems (Mclaren and Bryson, 1987). In study of children with mild Intellectual disability, 2 had seizures, 2 had cerebral palsy and one had microcephaly (Baired and Sadovnick, 1985). Hearing and vision problems are common in children with global developmental delay and Intellectual disability. There were reports of hearing impairment in 13-15% and vision impairment in 13% of Intellectual disability cases (Sutton, 1996).
The prevalence of development delay is estimated at 1% to 3% based on the rate quoted for Intellectual disability (Shevell et al, 2003). Degree of Intellectual disability predicts a higher detection rates. Prevalence in the 1303 cases of moderate to severe Intellectual disability is 6.3%, whereas it is only 1% of mild Intellectual disability in the 479 cases (Flint et al, 2003). The estimated prevalence of all development delay is as high as 10%.
Despite recent advances, the origin of largely 40% of moderate to severe cases of Intellectual disability remains unexplained. Recognizing the cause of Intellectual disability has little therapeutic impact but helps in clarifying the recurrence risk and makes prenatal diagnosis and carrier testing feasible in affected families. Segmental aneusomy has recently been recognized as a significant cause of an Intellectual disability. In mild Intellectual disability a specific risk factor has been identified in about 43% of the cases studied. Out of these only 24% yield a fairly clear or convincing diagnosis (14% classified as genetic and 10% environmental). With moderate and severe Intellectual disability a cause is determined in up to 64% cases (45% linked to genetic causes and 19% to environmental factors) (Sutton,1996).
Virtually all of those with an IQ below 50 need life long support & about half of the mildly retarded are significantly impaired through out the life. Remedies are scanty preventive strategies inefficient and current research in to the problem is meager. One of the major obstacles, to the provision of effective preventive regimen is our poor understanding of origin of Intellectual disability.
Conclusion
Some research workers have shown that the cause is unknown in 75% of children of mild Intellectual disability. Some of the genetic disorders associated with intellectual disability are chronic health problems and development delay. There is no easy answer for, what causes intellectual disability, because of the complexity of the human body. Despite recent advances, the origin of 40% of moderate to severe cases of intellectual disability remains unexplained. Recognizing the cause of intellectual disability has little therapeutic impact but helps in clarifying the recurrence risk and makes prenatal diagnosis and carrier testing feasible in affected families. Virtually all of those with an IQ below 50 need life long support and about half of the mildly retarded are significantly impaired through out the life. Remedies are scanty, preventive strategies inefficient and current research in to the problem is meager. One of the major obstacles, to the provision of effective preventive regimen is our poor understanding of origin of intellectual disability.
References
- Akiko Y, Tomoko S, Takeshi M, Keiko E and Yoshiteru Y. 1998. An epidemiological study on the cause of mental retardation in Yokohama city. Kanaga. Seis. Lgakk., 48: 15-21.
- American Association on Mental Retardation. 1992. Mental retardation: Definition, classification, and systems of supports. Washington, D. C.: American Association on Mental Retardation.
- American Association on Mental Retardation. 2002. Mental Retardation: Definition Classification and systems of supports.10th ed.Washington, D.C., American Association on Mental Retardation
- Baird PA and Sadovnick AD. 1985. Mental retardation in over half-a-million conservative livebirths: An epidemiological study. Am. J. Ment. Def., 89: 323-330.
- Battaglia A and Carey JC. 2003. Diagnostic evaluation of developmental delay/ mental retardation: an overview. Am. J. Med. Genet., 117:3-14.
- Battaglia A, Bianchini E and Carey JC. 1999. Diagnostic yield of the comprehensive assessment of developmental delay/mental retardation in an institute of child neuropsychiatry. Am. J. Med. Genet., 82:60-66.
- Belmont L. 1986. Screening for severe mental retardation in developing countries: the international pilot study of severe childhood disability. In Berg JM, (ed.): “Science and service in mental retardation”. Proceedings of the Seventh Congress of the International Association for the Scientific Study of Mental Deficiency, London, England. Methuen Ltd., 389-95.
- Birch HG, Richerdson SA, Baird D, Horobin G and Ilslay R. 1970. Mental subnormality in the community a clinical and epidemiological study. Baltimore: Willams and Wilkins
- Blackman JA.1992. Developmental delays. In Hockelman, R.A., Friedman, S.B. and Nelson, N.M. (eds).” Primary Pediatric Care”. St. Louis, M.O., Mosby-year Book., 867-870.
- Chen J. and Simeonsson RJ.1993. Prevention of childhood disability in the People’s Republic of China. Child Care Health Dev., 19:71-88.
- Chiurazzi P and Oostra BA. 2000. Genetics of Mental retardation. Curr. opin. Pediatr., 12:529-535
- Curry CJ, Stevenson RE and Aughton D. 1997. Evaluation of Mental retardation: recommendations of a consensus conference. Am. J. Med. Genet., 72:468-477
- Darr A and Modell B.1988.The frequency of consanguineous marriage among British Pakistanis. J. Med. Genet., 25:186-90.
- Decoufl P, Murphy CC, Drews CO and Yeargin-Allsopp M. 1993. Mental retardation in ten year old children in relation to their mother employment during pregnancy. Am. J. Ind. Med., 5: 567-86.
- Doll EA. 1962. Trends and problems in the education of the mentally retarded, 1800 – 1940. Am. J. Ment. Def., 72: 175-183
- Drews C, Murphy CC, Yeargin AM and Decoufle P. 1996. The relationship between idiopathic mental retardation and maternal smoking during pregnancy. Pediatr., 97 (4) : 547-553
- Durkin MS, Hasan ZM and Hasan KZ.1998. Prevalence and correlates of mental retardation among children on Karachi, Pakistan. Am. J.Epidemiol., 147: 281-8.
- Durkin MS, Schupf N and Stein ZA. 2000 . Mental retardation. In:Wallace RB, ed. Public health and preventive medicine. East Norwalk, CT: Appleton and Lange (in press).
- Eryman RK, Grossman HJ and Chaney RH.1990. The life expectancy of profoundly handicapped people with mental retardation. N. Engl. J. Med., 323:584-9.
- Flint J and Knight S. 2003. The use of telomere probes to investigate submicroscopic rearrangements associated with mental retardation. Curr. Opin. Gene. Deve., 13: 310-316.
- Fryns JP, Volcke PH. Haspeslagh M, Beusen L and Van DenBerghe H.1990. J. Mental. Defic.Res., 34: 29-40.
- Ghalib MA and Isaac GS. 1991. Paternal consanguinity in Down syndrome. Ann. Natl. Acad. Med. Sci., 27: 43-46.
- Hagberg B and Kyllerman M.1983. Epidemiology of mental retardation-a Swedish survey. Brain. Dev., 5: 441-449.
- Hagberg B, Hagberg G, Lewerth A and Lindberg U.1981. Mild mental retardation in Swedish school children. II. Etiologic and pathogenetic aspects. Acta. Paediatr. Scand., 70: 445-52.
- Hasan Z and Hasan A.1981. Report on a population survey of mental retardation in Pakistan. Int. J. Ment. Health., 10:23-7.
- Heber, R. A. 1961. A manual on terminology and classification in mental retardation 2nd ed. Monograph Supplement to the American Journal of Mental Deficiency.
- Hunter AG. 2000. Outcome of the routine assessment of patients with mental retardation in a genetics clinic.Am.J.Med.Genet., 90:60-68.
- Islam S, Durkin MS and Zaman SS.1993. Socioeconomic status and the prevalence of mental retardation in Bangladesh. Ment. Retard., 31: 412-7.
- Jacobs PA, Matsuura JS, Mayer M and Newlands I. M.1978. A cytogenetic survey of an institution for the mentally retarded: I. Chromosome abnormalities. Clin. Genet., 13: 37-60.
- John BM, Michael MD, Shevell MD and Committee of Genetics. 2006. Clinical genetic evaluation of the child with mental retardation or developmental delays. Am. Acad. Ped., 10.1542: 2304-2315.
- Karnebeek VCDM, Scheper FY and Abeling NG. 2002. Aetiology of mental retardation or borderline cognitive delay in 281 children referred to a tertiary care center: A prospective study. In Van Karnebeek CDM ed. “Mental retardation”. Diagnostic studies on Aetiology (doctoral thesis). Amsterdam, Netherlands: Department of Pediatrics/Emma children’s Hospital and Department of clinical Genetics, Academic Medical Centre, and University of Amsterdam., 75-108.
- Kiely M.1987. The prevalence of mental retardation. Epidemiol. Rev., 9:194-218.
- Lamb NE, John SK, Eleanor F and Sherman SL. 2005. Association between maternal age and meiotic recombination for trisomy 21. Am. J. Hum. Genet., 6: 91-99.
- Larson SA, Lakin KC, Anderson L, Kwak N, Lee JH and Anderson D. 2001. Prevalence on mental retardation and developmental disabilities: estimates from the 1994/1995 National Health Survey Disability Supplements. Am. J. Ment. Retard., 106: 231-52.
- Lisa AC, Judith K & Grether SS. 2001. The epidemiology of mental retardation of unknown causes. Pediatr., 107: 86 -92.
- Lisa AC, Judith K and Grether SS. 2001. The epidemiology of mental retardation of unknown cause. Pediatr., 107 (6): 86 -92.
- Majnemer A and Shevell MI. 1995. Diagnostic yield of the neurological assessment of the developmentally delayed child. J.Pediatr., 127:193-99.
- Matilainen R, Airaksinen E, Mononen T, Launiala K and Kaariainen R.1995. A population-based study on the causes of mild and severe mental retardation. Acta. Paediatr., 84: 261−266.
- McDermott S. 1994. Explanatory model to describe school district prevalence rates for mental retardation and learning disabilities. Am. J. Ment. Retard., 99: 175-85.
- McLaren J and Bryson SE. 1987. Review of recent epidemiological studies in mental retardation: Prevalence, associated disorders, and etiology. Am. J. Ret., 92, 243-254.
- Mervis C, Decoufle P, Murphy CC and Yeargin-Allsopp M. 1995. Low birthweight and the risk for Mental retardation later in childhood. Paediatr. perinat. Epidemiol., 9 (4) : 455-68.
- Murphy CC, Yeargin-Allsopp M, Decoufle P and Drews CD.1995. The administrative prevalence of mental retardation in 10-yr-old children in Metropolitan Atlanta, 1985 through 1987. Am. J. Public Health., 85: 319-23.
- Narayanan HS.1981. A study of the prevalence of mental retardation in southern India. Int. J. Ment. Health., 10: 28-36.
- Ohdo S, Sonoda T, Ohba K and Hayakawa K. 1992. Etiogic and pathogenetic study of mental retardation with multiple congenital anomalies. Acta. Pediatr. Jpn., 34: 144-150.
- Penrose LS 1988. Clinical and genetic study of 1,280 case of Mental defect. Special report series 229. Medical research council, London.
- Rantakallio P and Wendt VL. 1985. Risk factors for mental retardation. Arch. Dis. Child., 60:946-952.
- Roeleveld N, Zielhuis GA and Gabreels F.1997. The prevalence of mental retardation: a critical review of recent literature. Dev. Med. Child Neurol., 39: 125-32.
- Salonen JT and Heinonen OP. 1984. Mental retardation and mother hypertension during pregnancy. J. Ment. Defic. Res., 1:53-6.
- Saul RA, Stevenson RE and Schroer RJ. 1996. Congenital anomalies in individuals with mental retardation. Proc. Geenwood Genet. Crt., 15: 160.
- Schaefer GB and Bodensteiner JB. 1992. Evaluation of the child with idiopathic mental retardation. Pediatr. Clin. North. Am., 39: 929-943.
- Shami SA, Schmitt LH and Bittles AH., Consanguinity related prenatal and postnatal mortality of the populations of seven Pakistani Punjab cities. J. Med. Genet., 1989; 26:267-71.
- Sheerenberger RC., A history of mental retardation. Baltimore: Brookes Publishing Co, 1983.
- Shevell MI. The evaluation of the child with a global developmental delay. Semin. Pediatr. Neurol., 1998; 5:21-6.
- Shevell MI, Ashwal S and Donley D., Practice parameter: Evaluation of child with global developmental delay. Report of Quality standards subcommittee of the American Academy of Neurology and The Practice committee of the child Neurology society .Neurology., 2000; 60: 367-80.
- Shevell MI, Majnemer A, Rosenbaum P and Abrahamowicz M. Etiologic yield of sub specialist’s evaluation of young children with global developmental delay. J.Pediatr., 2000; 136: 593-598.
- Simeonsson RJ and Sharp MC., Developmental delays. In Hoekelman, R.A., Friedman, S.B. and Nelson, N.M., (eds). Primary Pediatric Care.St.Louis,Mosby-year book., 1992; 867-70.
- Sinclair S., Etiological factors in mental retardation: A study of 470 cases. Ind. Pediat., 1973; 9: 391−396.
- Smith DW and Bostian KE. Congential anomalies associated with idiopathic mental retardation. J. Pediatr., 1963; 65:189-196.
- Stewart AL. Outcome, Harvey, D. ed. Wright. The baby under 1000 g., 1989; 331-339.
- Stromme P., Aetiology in severe and mild mental retardation; A population based study Norwegian children. Dev. Med. child Neurol., 2000; 42(2): 76-86.
- Sutton VR, Genetics and mental retardation. Q. J. M., 1996; 89(3): 169-175.
- Talukder G and Sharma, Genetic disease in India. Proc. India natl. Sci. Acad., 1979; 45: 273
- Tan BS, Law HY, Zhao Y, Yoon CS and N. DNA testing for Fragile X syndrome in 255 makes from special schools in Singapore. Ann. Acad. Med. Singapore., 2000; 29: 207-212.
- The Arc. “Introduction to mental retardation” Q. and A. Arlington, Texas: Author 1993.
- Van KCD, Jansweijer MC, Leenders AG, Offringa M, and Hennekam RC, Diagnostic investigations in individuals with mental retardation: A systematic literature review of their usefulness. Eur. J . Hum. Genet., 2005; 13: 6-25.
- Van KCDM, Scheper FY and Abeling NG., Aetiology of mental retardation or borderline cognitive delay in 281 children referred to a tertiary care center: a prospective study. In Van Karnebeek CDM ed. “Mental retardation”. Diagnostic studies on Aetiology (doctoral thesis).Amsterdam, Netherlands: Deparment of Pediatrics/Emma children’s Hospital and Department of clinical Genetics, Academic Medical Centre, and University of Amsterdam., 2002; 75-108.
- World Health Organization, International aspects of mental retardation. WHO offset publication no. 86. Geneva, 1986.
- World Health Organization. International classification of diseases: 10th revision. Ann Arbor, MI: Commision on Professional and Hospital Activities, 1993.
- Yoshifumi K., and dermatoglyphic studies on severely handicapped patients in institution. Acta. Med. Okaya., 1982; 35(5): 383-397.
- Young YS, Hyun HY and Yung L, The prevalence of mental retardation among third grade elementary school children in the suwon area, Korea. J. Kore. Med. Sci., 2002; 17: 86-90.


![]()
![]()
