

Manuscript accepted on : 21 November 2017
Published online on: --
Study of Combining Ability for Quality Component in Forage Sorghum [Sorghum Bicolor (L.) Moench]
Ashok Kumar Dehinwal, S. K. Pahuja, U. N. Joshi, Pummy Kumari and S. Arya
Department of Genetics and Plant Breeding, CCSHAU, Hisar, Haryana - 125004, India.
Corresponding Author E-mail: ashokdehinwalccshau@gmail.com
DOI : http://dx.doi.org/10.13005/bbra/2601

ABSTRACT: The study envisaged assessing the general combining ability of the parents and specific combining ability of the hybrids, using line x tester mating design. Twenty four hybrids along with their parents and checks ((SSG 59-3 and MFSH 4)) were evaluated at two locations with two date of sowing (Early and late sowing) during the kharif season of 2015-16. Data on five randomly taken plants from each genotype in each replication were recorded on different quantitative characters at first cut (55 days after sowing) and second cut (45 days after first cut). The ratio of σ2 GCA/σ2 SCA was less than unity for all the characters indicating preponderance of non-additive gene action (dominance and epistasis). Female parents 9A and 56A were also better combiners for HCN content, IVDMD and DDM in more than two different environments. HJ 513 and G 46 were found to be good general combiner male parents for protein content, protein yield, IVDMD and DDM in more than two different environments. The Cross combination of 465A × HJ 513 and 9A × IS 2389 were better for protein yield, IVDMD and DDM in more than two different environments. This suggests the usefulness of heterosis breeding or any breeding plan which makes use of specific combining ability effects for improvement in these traits.
KEYWORDS: Forage Sorghum; Quality Traits; Variance; Gene Action and Combining Ability
Download this article as:| Copy the following to cite this article: Dehinwal A. K, Pahuja S. K, Joshi U. N, Kumari P, Arya S. Study of Combining Ability for Quality Component in Forage Sorghum [Sorghum Bicolor (L.) Moench]. Biosci Biotech Res Asia 2017;14(4). |
| Copy the following to cite this URL: Dehinwal A. K, Pahuja S. K, Joshi U. N, Kumari P, Arya S. Study of Combining Ability for Quality Component in Forage Sorghum [Sorghum Bicolor (L.) Moench]. Biosci Biotech Res Asia 2017;14(4). Available from: https://www.biotech-asia.org/?p=28707 |
Introduction
Sorghum is one of the most important staple food and fodder crops in parts of the semi-arid tropics of the world and cultivated in areas considered to be too dry and hot for other cereals, because of its tolerance to drought and heat stress. It is highly palatable and digestible than maize and pearl millet as for as the nutritional quality is concerned. It produces a tonnage of dry matter having digestible nutrients (50%), crude protein (8%), fat (2.5%) and nitrogen free extracts (45%) (Azam et al., 2010). The farmers have a preference for sorghum as it can be utilized for different purposes like fresh fodder, hay and silage and grows well in hot and dry climate (Dara Singh and Sukhchain, 2010). It has quick growth habit, quick recovery or regeneration after cutting or grazing and its ability to provide highly palatable and nutritious fodder for cattle.
Improvement of sorghum is much emphasized owing to its importance as food and fodder crop. It is necessary to improve the fodder sorghum yield with nutritionally superior qualities in order to obtain better animal performance. The fodder yield is the primary trait targeted for improvement of fodder sorghum productivity. Combining ability analysis helps in identifying the parents, which could be used for hybridization programme to produce superior hybrids. In the present study, an attempt has been made to estimate the general and specific combining ability effects of the parents and crosses in forage sorghum.
Materials and Method
The experimental material for the present study comprised of 24 forage sorghum hybrids, 10 parents (six female and four male) and two standard checks (SSG 59-3 and MFSH 4). Hybrids were developed in a Line x Tester mating fashion on six females (lines) using four males (testers). The crosses were made in research area of Forage section, Department of Genetics and Plant Breeding, CCS HAU, Hisar during the kharif season of 2014-15. Hybrids and parents were evaluated at two locations i.e. research area of Forage Section, Department of Genetics and Plant Breeding, Chaudhary Charan Singh Haryana Agricultural University, Hisar and Regional Research Station Uchani, Karnal with two date of sowing (Early and late sowing) during the kharif season of 2015-16. All the thirty six genotypes were grown in a randomized block design in three replications of a two-row plot of 4.0 m length. All the recommended cultural package of practices was followed from sowing to harvesting of the crop. Data on five randomly taken plants from each genotype in each replication were recorded on different quality characters viz. TSS content [total soluble sugars (%)], protein content (%), protein yield (g/plant), IVDMD [(in vitro dry matter digestibility (%)], dry matter digestibility (g/plant) and HCN content (mg/kg green weight) in all the four environments (Table 2 and 3) at first cut (55 days after sowing) and second cut (45 days after first cut).
Results and Discussion
Estimates of variances due to general and specific combining ability for all the characters under study are presented in Table 1. General combining ability variances for female parents were highly significant for all the characters. The general combining ability variances of males were highly significant for all the traits. The SCA variances (σ2 SCA) were higher than GCA variance (σ2 GCA) for almost all the characters (Table 4). The ratio of σ2 GCA/σ2 SCA was less than unity for all the characters indicating preponderance of non-additive gene action (dominance and epistasis). Similar results have been reported by Agarwal and Shrotria (2005), Pandey et. al (2013), Prabhakar et. al (2013) and Rani et. al (2013).
General Combining Ability Effects
The data obtained from the crosses and parental lines were subjected to line x tester analysis. The estimates of general combining ability (GCA) effects of all the parents comprising six female and four male parents for all the characters in all the four environments have been presented in Table 2. The brief description of different characters for general combining ability analysis is as follows:
Total Soluble Sugars (TSS)
Among lines14A (0.84) and 56A (-0.52) in E1 and 31A (0.73) in E4 were found to be good general combiners for this character. Among testers, IS 2389 (0.41 and 0.54) in E1 and E3, and HJ 541 (0.49) in E4, respectively showed positive significant GCA effects for this character.
Protein Content
Among female parent, 9A (0.66) exhibited high positive and significant GCA effects for protein content in E1, 14A (0.46) in E2, 467A (0.38 and 0.35) in E3 and E4, respectively. Other lines which recorded significant positive GCA effects were 465A (0.30) in E2, 56A (0.23) in E3 and 9A (0.09) in E4 indicated their suitability as good general combiner for protein content. In case of testers, genotype HJ 541 (0.42) exhibited positive significant GCA effects for protein content in E1 while G 46 (0.21) in E2. The male G 46 (0.50) recorded positive significant GCA effects in E3 while IS 2389 (0.26) in E4. The other good combining male parent was HJ 541 (0.27 and 0.25) in E3 and E4, respectively for protein content.
Protein Yield Per Plant
In case of female parents, 9A (0.68) in E1, 14A (1.31) in E2, 467A (0.78 and 1.50) in E3 and E4, respectively showed high positive and significant GCA effects for this character. Other lines which recorded significant positive GCA effects were 14A (0.53) in E1 and 9A (0.41) in E4which indicated their suitability as good source material for this character. Among testers, genotypes G 46 (0.90, 0.44 and 0.83) in E1, E2, and E3, and HJ 541 (0.86) in E4 recorded high positive and significant GCA effects for this character. HJ 513 (0.54) in E1 was also found to be good general combiner for this character.
In Vitro dry Matter Digestibility (IVDMD)
Among lines, 9A (4.01 and 2.15) in E1 and E2 respectively, 467A (3.08) in E3 and 9A (5.86) in E4 recorded high positive and significant GCA effects for this character. Other female parents which showed significant positive GCA effects were 467A (2.81) in E1, 14A (2.09) and 56A (2.02) in E2, 465A (2.93) in E3 and 465A (3.71) in E4 indicated their suitability as good general combiner for this character. As far as testers are concerned, G 46 (1.55) in E1, HJ 513 (2.15) in E2, HJ 513 (2.68) in E3, HJ 513 (1.22) and HJ 541 (1.00) in E4 recorded positive GCA effects for this character. The other good combining testers were IS 2389 (1.20) in E1 and G 46 (1.03) in E4 which indicated their suitability as source material for this character.
Table 1: Analysis of variance for combining ability for different quality characters in different environments in forage sorghum
| SV | D.F | Env. | TSS | CP | PY | IVDMD | DDM | HCN |
| Replication | 2 | E1 | 2.54 | 3.06 | 1.41 | 7.87 | 12.96 | 130.62 |
| E2 | 1.19 | 5.61 | 9.34 | 8.25 | 48.33 | 99.94 | ||
| E3 | 2.13 | 3.13 | 3.17 | 8.25 | 17.93 | 107.65 | ||
| E4 | 1.14 | 2.82 | 0.88 | 7.87 | 30.00 | 122.36 | ||
| Hybrids | 23 | E1 | 1.60** | 2.13** | 10.72** | 46.03** | 343.46** | 405.64** |
| E2 | 0.66 | 1.18** | 7.19** | 74.01** | 245.54** | 443.50** | ||
| E3 | 1.59** | 2.50** | 5.00** | 66.37** | 165.36** | 389.73** | ||
| E4 | 1.90** | 1.62** | 7.07** | 131.84** | 226.08** | 458.43** | ||
| Lines | 5 | E1 | 1.27** | 1.73** | 2.85** | 88.09** | 154.69** | 598.79** |
| E2 | 0.92* | 2.03** | 6.05** | 83.77** | 206.62** | 424.43** | ||
| E3 | 0.10 | 1.07** | 3.55** | 110.20** | 258.90** | 538.48** | ||
| E4 | 2.16** | 0.73** | 8.25** | 197.92** | 239.91** | 569.50** | ||
| Tester | 3 | E1 | 2.59** | 2.20** | 12.96** | 80.69** | 855.76** | 41.52** |
| E2 | 0.52 | 1.09** | 2.19** | 54.57** | 110.31** | 38.46** | ||
| E3 | 2.57** | 3.95** | 5.98** | 74.83** | 157.24** | 156.46** | ||
| E4 | 2.74** | 2.17** | 8.51** | 84.82** | 183.12** | 73.16** | ||
| Lines x Testers | 15 | E1 | 1.52** | 2.25** | 12.90** | 25.08** | 303.93** | 414.09** |
| E2 | 0.60 | 0.92** | 8.57** | 74.65** | 285.56** | 530.86** | ||
| E3 | 1.90** | 2.69** | 5.28** | 50.07** | 135.80** | 386.81** | ||
| E4 | 1.65** | 1.81** | 6.38** | 119.22** | 230.06** | 498.46** | ||
| Error | 46 | E1 | 0.55 | 0.02 | 0.37 | 0.01 | 8.80 | 0.04 |
| E2 | 0.46 | 0.07 | 0.30 | 0.01 | 9.12 | 0.05 | ||
| E3 | 0.57 | 0.01 | 0.31 | 0.01 | 8.32 | 0.12 | ||
| E4 | 0.60 | 0.01 | 0.19 | 0.01 | 5.48 | 0.06 |
D.F. = Degree of Freedom * Significant at 5% level **Significant at 1% level
S.V. = Source of variation Env. = Environments TSS = Total Soluble Sugar content
CP = Protein content PY = Protein yield IVDMD = In vitro dry matter digestibility
DDM = Dry matter digestibility HCN = HCN content
E1 = Early sowing at Hisar E2 = Early sowing at Karnal
E3 = Late sowing at Hisar E4 = Late sowing at Karnal
Table 2: General combining ability effects of parents in different characters in different environments in forage sorghum
| Female
parents |
TSS content | Protein content | Protein yield per plant | |||||||||
| E1 | E2 | E3 | E4 | E1 | E2 | E3 | E4 | E1 | E2 | E3 | E4 | |
| 9A | -0.10 | -0.22 | -0.08 | 0.10 | 0.66** | 0.21** | 0.14** | 0.09* | 0.68** | 0.17 | -0.06 | 0.41** |
| 14A | 0.84* | -0.18 | 0.05 | -0.06 | 0.08 | 0.46** | -0.36** | -0.13** | 0.53* | 1.31** | -0.85** | -0.72** |
| 31A | 0.15 | -0.31 | -0.08 | 0.73* | 0.10* | -0.38** | -0.31** | 0.17** | -0.13 | -0.33 | -0.24 | -0.25 |
| 56A | -0.52* | 0.32 | -0.08 | 0.06 | -0.20** | 0.01 | 0.23** | -0.16** | -0.24 | -0.23 | 0.07 | -0.45** |
| 465A | 0.15 | 0.07 | 0.05 | -0.44 | -0.19** | 0.30** | -0.08* | -0.32** | -0.41 | -0.16 | 0.30 | -0.49** |
| 467A | -0.10 | 0.32 | 0.13 | -0.40 | -0.45** | -0.60** | 0.38** | 0.35** | -0.43* | -0.76** | 0.78** | 1.50** |
| SE (d) | 0.30 | 0.28 | 0.39 | 0.31 | 0.06 | 0.10 | 0.04 | 0.04 | 0.25 | 0.22 | 0.23 | 0.17 |
| Male parents | ||||||||||||
| HJ 513 | -0.09 | -0.07 | -0.02 | -0.45* | -0.06 | -0.36** | -0.51** | -0.48** | 0.54** | -0.11 | -0.41* | -0.69** |
| HJ 541 | 0.16 | 0.13 | -0.19 | 0.49* | 0.42** | 0.06 | 0.27** | 0.25** | -0.83** | -0.39* | -0.07 | 0.86** |
| IS 2389 | 0.41* | -0.21 | 0.54* | -0.09 | -0.43** | 0.09 | -0.26** | 0.26** | -0.61** | 0.07 | -0.36* | 0.22 |
| G 46 | -0.48* | 0.15 | -0.33 | 0.05 | 0.07 | 0.21* | 0.50** | -0.03 | 0.90** | 0.44** | 0.83** | -0.39** |
| SE (d) | 0.24 | 0.23 | 0.25 | 0.25 | 0.05 | 0.09 | 0.03 | 0.03 | 0.20 | 0.18 | 0.18 | 0.14 |
| Female
parents |
In vitro dry matter digestibility | Dry matter digestibility per plant | HCN content | |||||||||
| E1 | E2 | E3 | E4 | E1 | E2 | E3 | E4 | E1 | E2 | E3 | E4 | |
| 9A | 4.01** | 2.15** | -0.45** | 5.86** | 5.12** | 0.60 | -1.54 | 6.92** | -10.84** | -9.75** | -9.20** | -9.42** |
| 14A | -2.12** | 2.09** | -4.31** | -1.67** | -0.17 | 6.68** | -6.76** | -4.90** | -0.88** | 1.59** | -0.02 | 3.10** |
| 31A | -1.22** | 0.14** | -2.66** | -2.67** | -2.55* | 0.68 | -2.57* | -4.42** | -1.93** | -1.66** | -3.31** | -1.83** |
| 56A | -1.13** | 2.02** | 1.42** | -0.28** | -1.82 | 0.92 | 0.60 | -1.19 | 1.66** | 1.97** | -2.06** | -3.39** |
| 465A | -2.34** | -2.37** | 2.93** | 3.71** | -4.05** | -3.98** | 5.27** | 2.36** | 11.13** | 8.50** | 10.32** | 11.13** |
| 467A | 2.81** | -4.02** | 3.08** | -4.94** | 3.47** | -4.90** | 5.00** | 1.23 | 0.86** | -0.64** | 4.27** | 0.41** |
| SE (d) | 0.04 | 0.05 | 0.05 | 0.04 | 1.21 | 1.23 | 1.17 | 0.95 | 0.08 | 0.09 | 0.14 | 0.09 |
| Male parents | ||||||||||||
| HJ 513 | 0.33** | 2.15** | 2.68** | 1.22** | 3.39** | 3.50** | 3.29** | -0.44 | 0.46** | -1.18** | 2.52** | -0.88** |
| HJ 541 | -3.08** | 0.68** | -0.12** | 1.00** | -9.75** | -1.65 | -1.97* | 4.45** | -1.59** | -1.10** | 0.91** | 0.99** |
| IS 2389 | 1.20** | -1.48** | -2.28** | -3.25** | 0.37 | -1.85* | -2.96** | -3.12** | -0.76** | 0.36** | -4.27** | -2.34** |
| G 46 | 1.55** | -1.35** | -0.29** | 1.03** | 5.99** | 0.00 | 1.65 | -0.90 | 1.89** | 1.92** | 0.84** | 2.23** |
| SE (d) | 0.04 | 0.04 | 0.04 | 0.03 | 0.98 | 1.01 | 0.96 | 0.78 | 0.06 | 0.07 | 0.11 | 0.08 |
E1 = Early sowing at Hisar E2 = Early sowing at Karnal E3 = Late sowing at Hisar E4 = Late sowing at Karnal
Dry Matter Digestibility per Plant (DDM)
Lines 9A (5.12) in E1 14A (6.68) in E2, 465A (5.27) in E3 and 9A (6.92) in E4 were found to be the best general combiner for this character. Other female parents which showed significant positive GCA effects were 467A (3.47 and 5.00) in E1 and E3, and 465A (2.36) in E4, respectively which indicated their suitability as good general combiner for this character. Among testers, genotypes G 46 (5.99) in E1, HJ 513 (3.50 and 3.29) in E2 and E3, and HJ 541 (4.45) in E4, respectively showed positive significant GCA effects for this character. Other male parent which recorded significant positive GCA effects was HJ 513 (3.39) in E1 and hence was suitable as good general combiner for this character.
HCN Content
In forage sorghum, low HCN is desirable trait. The highest negative GCA effects were recorded for 9A in all the four environments which indicated its suitability as source material for low HCN content. Other female parents which showed significant negative GCA effects were 31A in E1 and 56A in E3 and in E4 and identified as good general combiner for HCN content. Among the testers, HJ 541 (-1.59) in E1, HJ 513 (-1.18) in E2, IS 2389 (-4.27 and -2.34) in E3 and E4, respectively exhibited negative significant GCA effects for HCN content. Other male parents which showed significant negative GCA effects were IS 2389 (-0.76) in E1, HJ 541 (-1.10 and -0.88) in E2 and E4, respectively indicated their suitability as source material for HCN content. Similar results have been reported by Bello et. al (2007), Singh et. al (2010), Tariq et. al (2012) and Pandey et. al (2013).
Specific Combining Ability Effects
Specific combining ability is the average performance of a specific cross combination expressed as deviation from the population mean. SCA effect is the main cause for superiority of a cross. It is inferred that superiority of a cross cannot be fixed through selection. The estimates of specific combining ability effects are provided in Table 3 and the description of different characters is as under:
Total Soluble Augars (TSS)
The high SCA effects were observed by the crosses 31A × IS 2389 (1.63) (poor x good GCA) and 14A × HJ 513 (1.49) (good x poor) for total soluble sugars in E1; crosses 9A × HJ 541 (1.50) (poor x poor) and 14A × IS 2389 (1.49) (poor x poor) in E2; crosses 9A × G 46 (1.16) (poor x poor) and 31A × G 46 (1.16) (poor x poor) in E3; and crosses 9A × is 2389 (1.67) (poor x poor) and 467A × HJ 513 (1.67) (poor x good) in E4. Hybrids 14A × G 46 (1.06) in E1 and 31A × G 46 (1.24) in E4 had also significant SCA effects for this character.
Protein Content
The highest SCA effects were shown by the crosses 56A × HJ 541 (1.51) (good x good GCA) followed by 465A × IS 2389 (1.23) (good x good) and 465A × HJ 513 (1.07) (good x poor) for protein content in E1 and crosses 14A × HJ 541 (0.79) (good x poor) and 31A × G 46 (0.74) (good x good) had high SCA effects in E2. On the other hand, high SCA effects were shown by crosses 467A × IS 2389 (1.31) (good x good) and 465A × HJ 541 (1.23) (good x good) for this character in E3 while crosses 14A × G 46 (0.97) (good x poor) followed by 465A × IS 2389 (0.87) (good x good) and 467A × IS 2389 (0.71) (good x good) in E4 recorded high SCA effects. Crosses 14A × G 46 (0.77) in E1; 465A × HJ 513 (0.66) in E2; 9A × HJ 513 (1.12 and 0.66) in E3 and E4, respectively had also significant SCA effects for this character.
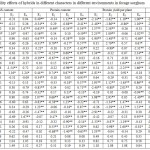 |
Table 3: Specific combining ability effects of hybrids in different characters in different environments in forage sorghum
|
Table 3: contd…..
| Hybrids | Dry matter digestibility per plant | HCN content | ||||||
| E1 | E2 | E3 | E4 | E1 | E2 | E3 | E4 | |
| 9A × HJ 513 | -16.17** | -4.80 | 4.38* | 6.34** | 6.53** | 6.19** | 0.25 | 6.43** |
| 9A × HJ 541 | -8.53** | -8.27** | -0.53 | 2.31 | -1.19** | -6.15** | -2.64** | -7.86** |
| 9A × IS 2389 | 13.11** | 9.74** | -0.04 | -2.99 | 8.32** | 9.38** | 9.76** | 7.25** |
| 9A × G 46 | 11.59** | 3.33 | -3.82 | -5.67** | -13.65** | -9.41** | -7.37** | -5.82** |
| 14A × HJ 513 | -1.61 | -6.03** | -1.86 | -0.12 | -2.31** | -3.23** | -5.08** | -8.17** |
| 14A × HJ 541 | 3.73 | 15.93** | 1.69 | 0.29 | -0.57** | -1.39** | -3.16** | 1.82** |
| 14A × IS 2389 | -2.70 | -7.87** | 0.96 | -7.93** | -6.29** | -5.49** | 1.54** | -3.51** |
| 14A × G 46 | 0.59 | -2.03 | -0.79 | 7.77** | 9.17** | 10.10** | 6.70** | 9.87** |
| 31A × HJ 513 | -1.29 | 0.38 | 2.21 | 2.97 | -11.12** | -8.16** | -8.05** | -3.81** |
| 31A × HJ 541 | 4.70* | 1.98 | 0.57 | -13.5** | 1.91** | 0.10 | 5.58** | 3.86** |
| 31A × IS 2389 | 5.77* | 5.54* | -5.70** | 8.61** | -12.38** | -16.90** | -13.92** | -17.98** |
| 31A × G 46 | -9.17** | -7.90** | 2.93 | 1.48 | 21.58** | 24.96** | 16.39** | 17.92** |
| 56A × HJ 513 | 3.14 | -3.58 | -8.83** | 3.94* | 6.29** | 5.45** | 6.42** | 5.21** |
| 56A × HJ 541 | 7.16** | 7.68** | -7.85** | 6.92** | -3.27** | -5.37** | -3.04** | 3.58** |
| 56A × IS 2389 | -9.29** | -3.19 | 11.17** | 4.02* | -7.47** | -4.02** | -11.32** | -11.93** |
| 56A × G 46 | -1.01 | -0.91 | 5.51* | -14.8** | 4.46** | 3.95** | 7.94** | 3.14** |
| 465A × HJ 513 | 15.5** | 19.19** | 9.95** | -14.6** | 3.62** | 4.12** | 8.62** | 8.63** |
| 465A × HJ 541 | 1.92 | -10.65** | 5.19* | 6.67** | -6.58** | -5.57** | -8.85** | -12.71** |
| 465A × IS 2389 | -6.58** | -7.54** | -6.91** | 4.29* | 18.31** | 18.37** | 16.37** | 21.07** |
| 465A × G 46 | -10.8** | -1.01 | -8.23** | 3.10 | -15.35** | -16.92** | -16.14** | 17.00** |
| 467A × HJ 513 | 0.41 | -5.17* | -5.84** | 0.94 | -3.01** | -4.37** | -2.16** | -8.29** |
| 467A × HJ 541 | -8.97** | -6.67** | 0.92 | -3.14 | 9.71** | 18.39** | 12.11** | 11.31** |
| 467A × IS 2389 | -0.31 | 3.32 | 0.51 | -6.00** | -0.50** | -1.34** | -2.42** | 5.10** |
| 467A × G 46 | 8.87** | 8.52** | 4.41* | 8.20** | -6.20** | -12.68** | -7.53** | -8.12** |
| SE (d) | 2.42 | 2.47 | 2.35 | 1.91 | 0.16 | 0.17 | 0.28 | 0.19 |
| 5% significant value | 4.04 | 4.12 | 3.92 | 3.19 | 0.27 | 0.28 | 0.47 | 0.32 |
| 1% significant value | 5.83 | 5.95 | 5.66 | 4.60 | 0.39 | 0.41 | 0.67 | 0.46 |
Protein yield per Plant
The cross 465A × HJ 513 (3.98) (poor x good GCA) followed by 9A × G 46 (2.25) (good x good) and 56A × HJ 541 (1.95) (poor x good) for protein yield in E1 while crosses 465A × HJ 513 (2.95) (poor x poor) followed by 14A × HJ 541 (2.79) (good x good) and 9A × IS 2389 (2.58) (poor x poor) in E2 showed high SCA effects. On the other hand, maximum SCA effects were shown by cross 56A × IS 2389 (2.01) (poor x good) followed by 31A × HJ 541 (1.64) (poor x poor) and 467A × IS 2389 (1.60) (good x good) for this character in E3 while cross 14A × G 46 (2.34) (good x good) followed by 31A × IS 2389 (1.66) (poor x poor) and 465A × IS 2389 (1.53) (good x poor) in E4 recorded high SCA effects.
In Vitro dry Matter Digestibility (IVDMD)
The highest SCA effects were recorded by crosses 14A × HJ 513(4.24) (good x good GCA) followed by 56A × HJ 541 (4.13) (good x good ) and 31A × G 46 (3.08) (good x good ) in E1 and crosses 465A × HJ 513 (6.13) (good x good ) followed by 31A × IS 2389 (6.05) (good x good ) and 9A × HJ 513 (5.21) (good x good ) in E2 for in vitro dry matter digestibility. On the other hand, maximum SCA effects were shown by crosses 56A × G 46 (7.08) (good x good) followed by 9A × HJ 513 (4.27) (good x good ) and 465A × HJ 541 (4.20) (good x good ) in E3 while cross 465A × HJ 541 (8.65) (good x good ) recorded highest SCA effects followed by 56A × IS 2389 (6.90) (good x good ) and 31A × G 46 (6.20) (good x good ) in E4. Hybrids 9A × G 46 (2.90) in E1; 14A × HJ 541 (4.93) in E2; 465A × HJ 513 (3.70) in E3 and 14A × HJ 513 (5.26) in E4 also showed significant SCA effects for this character.
Table 4: Genetic variance for different characters under different environments in forage sorghum
| Environment | E1 | E2 | E3 | E4 | ||||||||
| Characters | σ2 GCA | σ2 SCA | σ2 GCA
σ2 SCA |
σ2 GCA | σ2 SCA | σ2 GCA
σ2 SCA |
σ2 GCA | σ2 SCA | σ2 GCA
σ2 SCA |
σ2 GCA | σ2 SCA | σ2 GCA
σ2 SCA |
| TSS | -4.66 | 2666.40 | -0.002 | -46.97 | 2356.16 | -0.020 | -8.57 | 789.02 | -0.011 | -1.32 | 1470.99 | -0.001 |
| CP | -0.02 | 6.51 | -0.003 | 0.04 | 3.00 | 0.014 | -0.01 | 7.92 | -0.002 | -0.02 | 5.16 | -0.005 |
| PY | -0.33 | 34.26 | -0.010 | -0.30 | 21.86 | -0.014 | -0.04 | 14.57 | -0.002 | 0.13 | 19.91 | 0.007 |
| IVDMD | 3.95 | 114.75 | 0.034 | -0.37 | 220.25 | -0.002 | 2.83 | 178.47 | 0.016 | 1.48 | 372.40 | 0.004 |
| DDM | 13.42 | 1019.58 | 0.013 | -8.47 | 744.60 | -0.011 | 4.82 | 430.64 | 0.011 | -1.24 | 661.38 | -0.002 |
| HCN | -6.26 | 1179.51 | -0.005 | -19.96 | 1392.84 | -0.014 | -2.62 | 1133.84 | -0.002 | -11.81 | 1377.11 | -0.009 |
CP = Protein content (%) TSS = Total soluble sugars (%) PY = Protein yield per plant (g) IVDMD = In vitro dry matter digestibility (%)
DDM = Dry matter digestibility per plant (g) HCN = HCN content (mg/kg green weight) σ2 GCA = GCA variance σ2 SCA = SCA variance
E 1 = Early sowing at Hisar E 2 = Early sowing at Karnal E 3 = Late sowing at Hisar E 4 = Late sowing at Karnal
Table 5a: Promising general combining female parents for different characters in forage sorghum
| Environments
Characters |
Female parents | |||||||
| Early sowing (Hisar) (E1) | Early sowing (Karnal) (E2) | Late sowing (Hisar) (E3) | Late sowing (Karnal) (E4) | |||||
| TSS content (%) | 14A (0.84*) | – | – | – | – | – | 31A (0.73*) | – |
| Protein content (%) | 9A (0.66**) | 31A (0.10*) | 14A (0.46**) | 465A (0.30**) | 467A (0.38**) | 9A (0.14**) | 467A (0.35**) | 31A (0.17**) |
| Protein yield (g/plant) | 9A (0.68**) | 14A (0.53*) | 14A (1.31**) | – | 467A (0.78**) | – | 467A (1.50**) | 9A (0.41**) |
| IVDMD (%) | 9A (4.01**) | 467A (2.81**) | 9A (2.15**) | 14A (2.09**) | 467A (3.08**) | 465A (2.93**) | 9A (5.86**) | 465A (3.71**) |
| Dry matter digestibility (g/plant) | 9A (5.12**) | 467A (3.47**) | 14A (6.68**) | – | 465A (5.27**) | 467A (5.00**) | 9A (6.92**) | 465A (2.36**) |
| HCN content (mg/kg green weight) | 9A (-10.84**) | – | 9A (-9.75**) | – | 9A (-9.20**) | 56A (-2.06**) | 9A (-9.42**) | 56A (-3.39**) |
Table 5b: Promising general combining male parents for different characters in forage sorghum
| Env.
Ch. |
Male parents | |||||||
| Early sowing (Hisar) (E1) | Early sowing (Karnal) (E2) | Late sowing (Hisar) (E3) | Late sowing (Karnal) (E4) | |||||
| TSS | IS 2389 (0.41*) | – | – | – | IS 2389 (0.54*) | – | HJ 541 (0.49*) | – |
| CP | HJ 541 (0.42**) | – | G 46 (0.21*) | – | G 46 (0.50**) | HJ 541 (0.27**) | IS 2389 (0.26**) | HJ 541 (0.25**) |
| PY | G 46 (0.90**) | HJ 513 (0.54**) | G 46 (0.44**) | – | G 46 (0.83**) | – | HJ 541 (0.86**) | – |
| IVDMD | G 46 (1.55**) | IS 2389 (1.20**) | HJ 513 (2.15**) | HJ 541 (0.68**) | HJ 513 (2.68**) | – | HJ 513 (1.22**) | G 46 (1.03**) |
| DDM | G 46 (5.999**) | HJ 513 (3.39**) | HJ 513 (3.50**) | – | HJ 513 (3.29**) | – | HJ 541 (4.45**) | – |
| HCN | HJ 541 (-1.59**) | IS 2389 (-0.76**) | HJ 513 (-1.18**) | HJ 541 (-1.10**) | IS 2389 (-4.27**) | – | IS 2389 (-2.34**) | HJ 513 (-0.88**) |
Table 6: Promising specific combining hybrids for different characters in forage sorghum
| Env.
Ch. |
Hybrids | |||||||
| Early sowing (Hisar) (E1) | Early sowing (Karnal) (E2) | Late sowing (Hisar) (E3) | Late sowing (Karnal) (E4) | |||||
| TSS | 31A × IS 2389
(1.63**) |
14A × HJ 513
(1.49**) |
9A × HJ 541
(1.50**) |
14A × IS 2389
(1.49**) |
9A × G 46
(1.16*) |
31A × G 46
(1.16*) |
9A × IS 2389
(1.67**) |
467A × HJ 513
(1.67**) |
| CP | 56A × HJ 541
(1.51**) |
465A × IS 2389
(1.23**) |
14A × HJ 541
(0.79**) |
31A × G 46
(0.74**) |
467A × IS 2389
(1.31**) |
465A × HJ 541
(1.23**) |
14A × G 46
(0.97**) |
465A × IS 2389
(0.87**) |
| PY | 465A × HJ 513
(3.98**) |
9A × G 46
(2.25**) |
465A × HJ 513
(2.95**) |
14A × HJ 541
(2.79**) |
56A × IS 2389
(2.01**) |
31A × HJ 541
(1.64**) |
14A × G 46
(2.34**) |
31A × IS 2389
(1.66**) |
| IVDMD | 14A × HJ513
(4.24**) |
56A × HJ 541
(4.13**) |
465A × HJ 513
(6.13**) |
31A × IS 2389
(6.05**) |
56A × G 46
(7.08**) |
9A × HJ 513
(4.27**) |
465A × HJ 541
(8.65**) |
56A × IS 2389
(6.90**) |
| DDM | 465A × HJ 513
(15.50**) |
9A × IS 2389
(13.11**) |
465A × HJ 513
(19.19**) |
14A × HJ 541
(15.93**) |
56A × IS 2389
(11.17**) |
465A × HJ513
(9.95**) |
31A × 2389
(8.61**) |
467A × G 46
(8.20**) |
| HCN | 465A × G 46
(-15.35**) |
9A × G 46
(-13.65**) |
465A × G 46
(-16.92**) |
31A × IS 2389
(-16.90**) |
465A × G 46
(-16.14**) |
31A × IS 2389
(-13.92**) |
31A × IS 2389
(-17.98**) |
465A × HJ 541
(-12.71**) |
CP = Protein content (%) TSS = Total soluble sugars (%) PY = Protein yield per plant (g) IVDMD = In vitro dry matter digestibility (%)
DDM = Dry matter digestibility per plant (g) HCN = HCN content (mg/kg green weight) Env. = Environments Ch. = Characters
E 1 = Early sowing at Hisar E 2 = Early sowing at Karnal E 3 = Late sowing at Hisar E 4 = Late sowing at Karnal
GCA and SCA value in parenthesis **Significant at 1% level of significance *Significant at 5% level of significance
Dry Matter Digestibility per Plant (DDM)
The maximum SCA effects were observed by cross 465A × HJ 513 (15.50) (good x good GCA) followed by 9A × IS 2389 (13.11) (good x poor) and 9A × G 46 (11.59) (good x good) for this character in E1 while by cross 465A × HJ 513 (19.19) (good x good) followed by 14A × HJ 541 (15.93) (good x poor) and 9A × IS 2389 (9.74) (poor x good) in E2. On the other hand, maximum SCA effects were observed in the cross 56A × IS 2389 (11.17) (poor x good) followed by 465A × HJ 513 (9.95) (good x good) and 56A × G 46 (5.51) (poor x poor) for this character in E3 and cross 31A × IS 2389 (8.61) (good x good) followed by 467A × G 46 (8.20) (poor x poor) and 14A × G 46 (7.77) (good x poor) in E4. Hybrids 467A × G 46 (8.87) and 56A × HJ 541 (7.16) in E1; crosses 467A × G 46 (8.52) and 56A × HJ 541 (7.68) in E2; crosses 467A × G 46 (4.41) and 9A × HJ 513 (4.38) in E3 and cross 56A × HJ 541 (6.92) and 465A × HJ 541 (6.67) in E4 had also significant SCA effects which indicated that these crosses were good specific combiners for this character.
HCN Content
The high SCA effects were shown by the crosses 465A × G 46 (-15.35) (good x good GCA) and 9A × G 46 (-13.65) (good x good) in E1; 465A × G 46 (-16.92) (good x good GCA) and 31A × IS 2389 (-16.90) (good x good) in E2; 465A × G 46 (-16.14) (good x good GCA and 31A × IS 2389 (-13.92) (good x good) in E3 and 31A × IS 2389 (-17.98) (good x good GCA) and 465A × HJ 541 (-12.71) (good x good) in E4, respectively. Other crosses which had significant SCA effects were 14A × G 46 (9.17) and 9A × IS 2389 (8.32) in E1; 14A × G 46 (10.10) and 9A × IS 2389 (9.38) in E2 ; 9A × IS 2389 (9.76) in E3 and 14A × G 46 (9.87) and 465A × HJ 513 (8.63) in E4. This indicated that these crosses were found to be good specific combiners for this character. Similar results have been reported by Reddy et. al (2006), Bello et. al (2007), Joshi et. al (2009), Singh et. al (2010) and Pandey et. al (2013).
Two good combining female and male parents in all the four environments for various traits have been presented in Table 5a and Table 5b, respectively. Lines 9A, 31A and 467A were good general combiner female parents for protein content while 9A, 14A and 467A were good combiner female parents for protein yield in two environments. Female parents 9A and 56A were also better combiners for HCN content, IVDMD and DDM in more than two different environments. HJ 513 and G 46 were found to be good general combiner male parents for protein content, protein yield, IVDMD and DDM in more than two different environments. Similar results have been reported by Agarwal and Shrotria (2005), Pandey et. al (2013) and Rani et. al (2013).
Best specific cross combinations for different characters have been presented in Table 6. Read-through of this table revealed that the cross combination of 465A × HJ 513 and 9A × IS 2389 were better for protein yield, IVDMD and DDM in more than two different environments. The cross combination of 465A × IS 2389 was better for protein content (crude protein) and 465A × HJ 513 was good specific combiner for IVDMD and DDM. The cross combination of 31A × IS 2389 and 465A × G 46 exhibited high and negative SCA effects for HCN content. Similar results have been reported by Kamdi et. al (2011) and Bibi et. al (2012). Thus, the study reveals that there is lot of scope for the use of these lines in future breeding programmes in the development of either base populations or hybrids. The lines with lower hydrocyanic acid contents can be exploited for the improvement of quality of fodder sorghum thereby enhancing the nutritive value of the crop.
References
- Agarwal M. and Shrotria P. K., 2005. Heterosis and inbreeding depression in forage sorghum [Sorghum bicolor (L.) Moench]. Indian Journal of Genetics and Plant Breeding, 65(1): 12-14.
- Azam, M., Waraich, E. A., Pervaiz, A. and Nawaz, F., 2010, Response of a newly developed fodder sorghum (Sorghum bicolor (L.) Monech) variety (F-9917) to NPK application. Pakistan J. Life Soc. Sci., 8(2): 117-120.
- Bello, D., Kadams, A. M., Simon, S. Y. and Mashi, D. S. 2007. Studies on genetic variability in cultivated sorghum [Sorghum bicolor (L.) Moench] cultivars of Adamava State Nigeria. American Eurasian Journal of Agricultural & Environmental Sciences, 2(3): 297-302.
- Bibi, A., Sadaqat, H. A., Tahir, M. H. N., Usman, B. F. and Ali, M. 2012. Genetic analysis of forage quality traits in sorghum-sudangrass hybrids under water stress. Journal of Animal and Plant Sciences, 22(4): 1092-1100.
- Dara Singh and Sukhchain, 2010, Combining ability analysis in multicut sorghum [Sorghum bicolor (L.) Moench]. Range Mgmt. & Agroforestry, 31(2): 125-127.
- Joshi, D. C., Shrotria, P. K., Singh, R. and Chawla, H. S. 2009. Morphological characterization of forage sorghum (Sorghum bicolor (L.) Moench) varieties for DUS testing. Indian Journal of Genetics and Plant Breeding, 69(4): 383-393.
- Kamdi, S. R., Manjare, M. R. and Sushir, K. V. 2011. Combining ability analysis for forage yield and yield contributing characters in sweet sorghum (Sorghum bicolor (L.) Moench). Mysore Journal of Agricultural Sciences, 45(4): 837-843.
- Pandey, P., Shrotria, P. K., Singh, S. and Rajendra, R. 2013. Combining ability for fodder yield and its components in sorghum [Sorghum bicolor (L.) Moench]. Pantnagar Journal of Research, 11(2): 184-190.
- Prabhakar, S., Elangovan, M. and Bahadure, D. M. 2013. Combining ability of new parental lines for flowering, maturity and grain yield in Rabi sorghum. Electronic Journal of Plant Breeding, 4(3): 1214-1218.
- Rani, C., Umakanth, A. V., Vemanna, I. and Tanmay, V. K. 2013. Heterosis studies for ethanol yield and its related traits in F1 hybrids of sweet sorghum [Sorghum bicolor (L.) Moench]. Madras Agricultural Journal, 100(1/3): 1-8.
- Reddy, B. V. S., Sharma, H. C., Thakur, R. P. and Ramesh, S. 2006. Characterization of ICRISAT-bred sorghum hybrid parents (set I). International Sorghum and Millets Newsletter, 47: 138.
- Singh, S., Dwivedi, V. K., Sherotria, P. K. and Pandey, S. 2010. Genetic divergence in sorghum (Sorghum bicolor (L.) Moench). Forage Res, 36(1): 48-51.
- Tariq, A., Sattar., A. Z., Ghulam, S., Muhammad, G., Khalid, S., Khan, M., Shahid, I. and Talat, M. 2012. Character association and inheritance studies of different sorghum genotypes for fodder yield and quality under irrigated and rainfed conditions. African Journal of Biotechnology, 11(38):9189-9195.

This work is licensed under a Creative Commons Attribution 4.0 International License.


