

Manuscript accepted on : 15 November 2017
Published online on: --
Nutrient and Oceanography Requirement for G.Edulis and U.Lactuca in Setiu Wetland
Oladokun Olanrewaju Sulaiman1 , Giulia Guerriero2, Fadzil Akhir1 and Ismail Nabilah1
1School of Ocean Engineering, University Malaysia Terengganu, Kuala Terengganu, Malaysia.
2Department of Biology, University of Naple, Naple, Italy.
Corresponding Author E-mail: oolanrewaju8@gmail.com
DOI : http://dx.doi.org/10.13005/bbra/2564

ABSTRACT: Nutrients and Oceanography parameters are the key environmental factors that can determine biomass yield and productivity of an aquaculture system. Oceanography parameters are primarily controlled by the choice of location and season of the aquaculture site. Nutrients are controlled on the site and nutrient manipulations can control biomass yield, productivity and the amount of certain products formed. Carbon, nitrogen and phosphorus are the main three nutrient elements that influence the growth of seaweed. The different concentration of nutrients at difference aquaculture site was determined which in return influence types of seaweed growth at certain location.
KEYWORDS: Nutrient;Oceanography Parameters Seaweeds;
Download this article as:| Copy the following to cite this article: Sulaiman O. O, Guerriero G, Akhir F, Nabilah I. Nutrient and Oceanography Requirement for G.Edulis and U.Lactuca in Setiu Wetland. Biosci Biotech Res Asia 2017;14(4). |
| Copy the following to cite this URL: Sulaiman O. O, Guerriero G, Akhir F, Nabilah I. Nutrient and Oceanography Requirement for G.Edulis and U.Lactuca in Setiu Wetland. Biosci Biotech Res Asia 2017;14(4). Available from: https://www.biotech-asia.org/?p=28412 |
Introduction
Seaweeds are plant that growth in the sea. There are thousands of different kinds of seaweed all over the world. Seaweeds require a wide variety of nutrients to growth. Nitrogen and Phosphorus are the two nutrients that limit seaweed growth and yields in the most natural environments. When N and P are added in aquaculture practices, carbon then becomes limiting and therefore carbon is also added.1
Factor Affecting Seaweed Aquaculture
Factors affecting seaweed cultivation are described as followed3:
Water Temperature
Optimum condition would be between 25°C to 30°C where the prefer area would be the one between the spring low tide limit and the reef edge or an area which does not dry up during these big low tides occurring during full or new moon.
Water Salinity
Salinity defines as the amount of salt that can measure in seawater. Minimum salinity needed for optimum growth is 28 ppt.
Water Movement
Moderate water movement is mostly preferred. Nevertheless, ensure that constant exchange of ocean water as the one you have with the changing of the tides and sufficient water movement as the one created by waves. This will bring the necessary nutrients to the plants for a healthy growth. Hence the seaweed aquaculture location must be in the direction of water current flows and not against it.
Sunlight
Seaweed needs sunlight for growth. Seaweed such as Ulva and Gracilaria use sunlight as a source of energy for it to growth and to manufacture carbohydrates like carrageenan, the commercially valuable substance inside the seaweed. Thus, it is essential to have plenty of sunlight. Clear seawater allows sunlight to penetrate more easily to the plants. This is why when seaweed is planted close to the sea surface, it grows faster and healthier compared to that planted close to the sea bottom or in deep water.
Nutrient
Biomass absorbs nutrients to grow and it is one of the three essential elements. These nutrients are released again when biomass degrades. The nutrients become available again as fertilizer, or flow into the water system. Available nutrients in natural conditions are limited. Fertilizers are produced to increase crop yields in agriculture.
Nutrient Requirement for Macro Algae
Formation of macro algae initiated by the equation below1:
550CO2 + 580H2O + 30HNO3 + H3PO4 →(CH2O)550 (NH3)30 H3PO4 + 610O2
From this formula, chemical composition ratio for C:N:P (weight) equal to 213:14:1. Large quantities of nitrogen and phosphorus needed for algae cultivation.. Coastal waters or deltas are usually nutrient rich. Nutrients from sediments and fertilizers from farmland flow into rivers and coastal areas. Chlorophyll is an element in biomass and is necessary for photosynthesis. Higher concentration chlorophyll means more biomass because of more nutrients.4
Location
A salt-water area with high nutrient content is required for macro algae to growth. In addition, other parameters such as nutrient, carbon dioxide and light also play an important role for macro algae production.2 In this case study, Setiu wetland was chosen which located in Terengganu, on the east coast of peninsular Malaysia. Setiu wetland is the largest natural wetland which forms a part of Setiu river basin, and also of the larger Setiu-Chalok-Bari- Merang basin wetland complex. It is located at 05° 40N and 102° 43’ E as in Figure 1 below3:
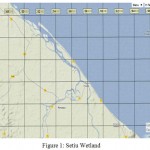 |
Figure 1: Setiu Wetland
|
Water Sampling
The water samples were takes in Setiu wetland. The 200 meter depth is marks on the rope at the vandorn water sampler. The latitude and longitude at the location was identified using the Global Positioning System (GPS) where the GPS was located approximately 500 meter distance from the shore. The water samples are transfer into bottles as soon as possible after takes using vandorn water sampler to prevent the disruption of surrounding. Water sampling was taken at two different times as point of comparison with the temperature in the bottles approximately 32°C.
Results
Sample Collection and Preservation
Water sample are collect using vandorn water sampler and transferred to the bottle samples. Generally, at least one liter of water sample is needed. Sample volume is depending on the sampling location. The water samples are kept from heat and light to avoid pigment decomposition and bacteria infect. The location of each sampling sites are marks using GPS and the temperature of sea water is taken immediately to prevent surrounding disturbance. Hence, the water samples are place in an ice chest at temperature 1-4°C. Table 1 shows the coordinate for Setiu wetland.
Table 1: Location of sampling site in Setiu wetland
| Parameter | Setiu wetland |
| Latitude (°N) | 05 °40.540 |
| 40.54 | |
| Temperature (°C) | 32 |
Table 2 and Graph 2 below illustrate the nutrient condition of the water samples collected at the respective sites for Gracilaria edulis and Ulva lactuca.
Table 2: Different parameters measures at Setiu wetland
| Location and time | ||
| Parameters (mg/L) | Setiu wetland (11.00 am) | Setiu wetland (3.00pm) |
| COD | 110 | 118 |
| Total P | 0.04 | 0.03 |
| Total N2 | 39 | 24 |
| NO3-N | 1.03 | 0.95 |
| Total PO4 | 0.14 | 0.09 |
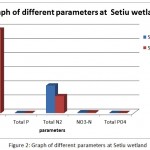 |
Figure 2: Graph of different parameters at Setiu wetland
|
Overall result show that total nitrogen, phosphate, phosphorus and ammoniacal nitrogen at 11 am slightly higher than the values at 3 pm. This probably due to movement of waves or current that wash away the nutrient from that area to another are or its being used by the organism for photosynthesis or other biological activities. However the value of COD (carbon oxygen demand) higher by 8 (mg/L) at 3pm compare to at 11 am probably due to high organic compounds in the area at 3pm possibly due to waste water from industry or nearby activities that increase its COD level (Table 3).
Table 3: Environmental parameters for Gracilaria. edulis and Ulva lactuca
| Environmental parameters | Gracilaria . edulis | Ulva lactuca |
| Temperature (°C) | 28.9 ± 2.10 | 28.9 ± 2.0 |
| Salinity (ppt) | 22.15 ± 2.20 | 19.5 ± 1.50 |
| Dissolved oxygen (mg/L) | 3.58 ± 0.05 | 3.19 ± 0.02 |
| pH | 8.43 ± 0.20 | 7.85 ± 0.30 |
| Turbidity (NTU) | 9.74 ± 0.04 | 8.68 ± 0.03 |
| Ammonium (mg/L) | 1.0 ± 0.03 | 1.25 ± 0.02 |
| Total nitrogen (N) (mg/L) | 3 0 ± 1.50 | 4.2 ± 0.50 |
| Nitrate (mg/L) | 0.02 ± 0.01 | 0.23 ± 0.02 |
| Total phosphate (P) (mg/L) | 0.2 ± 0.06 | 0.5 ± 0.10 |
| Phosphate (mg/L) | 1.04 ± 0.05 | 2.22 ± 0.04 |
Result for 2 different species of macro algae shows that Gracilaria. edulis and Ulva lactuca used approximately the same salinity and dissolved oxygen. The temperature required for both species to growth also the same which is 28.9 ±2.0. Nevertheless, the pH needed for Gracilaria edulis to survive more basic pH 8.43 ± 0.20 compare to Ulva lactuca which needed pH 7.85 ± 0.30 for optimum growth. In addition, the nutrient required such as total ammonium, nitrogen, nitrate and phosphate is higher for Ulva lactuca compared to Gracilaria edulis.
Oceanography Requirement
The oceanography data was taken from April- October 2013 at both 11 am and 3 pm to further understand the change happen each week (Figure 9).
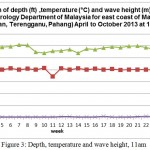 |
Figure 3: Depth, temperature and wave height, 11am
|
This result show throughout April to October at 11 am, no significant changes occur to wave height with average range from 0.29 to 0.61 meter. Nevertheless, temperature show a drop in reading beginning of June to end of July with average temperature drop range from (27.5-28.6) °C. The depth on the other hand show constant average reading around 20.5 except one significant drop third week of June probably due to interchange of season (Figure 4).
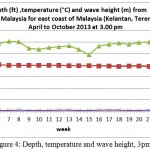 |
Figure 4: Depth, temperature and wave height, 3pm
|
This result show throughout April to October at 3 pm, no significant changes occur to wave height with average range from 0.29 to 0.61 meter. Nevertheless, temperature shows a drop in reading beginning of June to end of August with temperature average drop range from (29.14-24.54)°C. The depth on the other hand show constant average reading range from (19.33- 20.45) meter (Figure 5).
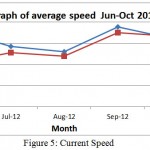 |
Figure 5: Current Speed
|
The same pattern is observed for speed recorded from June to October 2012 at 11am and 3 pm. For 11 am reading, the speed drop from 0.18 m/s to 0.13 m/s from June to August. The speed starts to increase in September to 0.19 m/s likely due to change to monsoon season. For reading at 3 pm, the speed increase from 0.10 m/s to 0.12 m/s from June to August while a high increase can be observe in September which give reading 0.18 m/s. This probably due to the change of season to Monsoon season ( Figure 6).
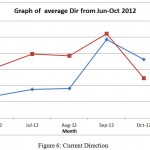 |
Figure 6: Current Direction
|
This graph in Figure 7 show the pattern of Dir (direction from which the dominant waves are coming. Direction is a mean over all frequencies in a given period) over month from June-October at 11am and 3 pm. The reading at 11 am show lower value compare to reading at 3pm overall. For Dir at 11 am, the value starts to increase gradually from 177 to 186 where a sudden spike can be observed in September with 247 Dir value. This probably due to interchange of season. The Dir value decrease slightly in October to 222.
The same pattern was observed for data recorded at 3pm where Dir value increase slightly from 212 in June to 227 in August. A sudden spike was recorded in September which give value of 254. This Dir value later show significant drop in October to199.
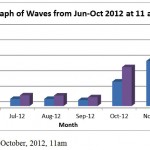 |
Figure 7: Waves, June-October, 2012, 11am
|
This result show Hs (Significant wave height in metres and is the average of the highest one third of all waves in the record) and Hmax (Maximum wave height in metres) over June to November time period at 11 am. Result show exponential increase for Hs from June to November with value range from (0.36-2.92) metres. These high Hs most likely due to Monsoon season that hit East coast area of Malaysia from October to January. Hmax also follow the same exponential increase with value range from (0.52-4.77) metres (Figure 8).
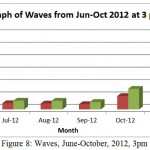 |
Figure 8: Waves, June-October, 2012, 3pm
|
Results show a decrease of Hs from June to August with value range from (0.81-0.41) metres. September to Nov show exponential increase of Hs from (0.41-3.2) metres. The wave high (Hs) most likely due to Monsoon season that hit East coast area of Malaysia from October to January. Hmax also follow the same exponential decrease with value range from (1.27-0.69) metres from June to August before exponentially increase from September to November with value range from (0.60-5.0) metres
References
- Kunshan G, Kelton R.M. Use of macroalgae for marine biomass production and CO2 remediation: a review, Kluwer Academic Publishers. 1994.
- teRaa H.R, Ockels W.J, Melkert J.A, Snijders T. A & van Blokland W. B. Bio jet fuel from macro algae. Delft University of Technology, Faculty of Aerospace Engineering. 2010.
- Sulaiman O.O, Raship A. R. N, Azman B.A,Angelo S.D, Madonna R. A & Tee K. F. (2015). Macro Algae: Biodiversity, Usefulness to Humans and Spatial Study for Site Selection in Oceanic Farming.Journal of Biodiversity & Endangered Species. 2015.
- Harrison P.J & Hurd C.L. Nutrient physiology of seaweeds: application of concepts to aquaculture. Cahiers de biologie marine. 2001;1-2.

This work is licensed under a Creative Commons Attribution 4.0 International License.


