

Manuscript accepted on : 07 March 2017
Published online on: --
Plagiarism Check: Yes
Vikrant Kumar Sahu1, Sunil,Kumar Nair2, Ashish Kumar Vishwakarma1, S. B. Verulkar1 and Girish Chandel1
1Department of Plant Molecular Biology and Biotechnology, COA, IGKV, Raipur-492012 C. G.
2Department of Genetics and Plant Breeding COA, IGKV, Raipur-492012 C. G.
Corresponding Author E-mail: ghchandel@gmail.com
DOI : http://dx.doi.org/10.13005/bbra/2450

ABSTRACT: QTL hotspots are the genomic regions influencing several traits by harboring important regulators. Therefore in the present study F5 mapping population was used to map the novel genomic regions and genomic hotspots by composite interval mapping. In all 130 QTLs were identified for grain yield and its attributing traits. Out of 130 QTLs, 36 QTLs were major effects QTLs and 8 QTLs were found stable over the locations. We identified strong major effects QTL for flag leaf length (qFLL3.1) with 46% phenotypic variance. In this study 6 known QTLs (qph3.1, qnt3.1, qnt3.2, qTGW3-4, qTGW4-1, qPPP4-2) were also validated and co-localized in chromosome 3 and 4 along with currently identified QTLs genomic regions. These genomic regions consist, hotspots of 15 major and 23 minor effects QTLs, which encompasses >3000 genes. Selection for advantageous allele underlying major robust QTLs will be useful to break genetic barriers of yield to sustained food security.
KEYWORDS: Environment; Markers; Yield Quantitative traits; QTLs; Rice;
Download this article as:| Copy the following to cite this article: Sahu V. K, Nair S. K, Vishwakarma A. K, Verulkar S. B, Chandel G. QTL Hotspots Detected for Yield Contributing Traits in Rice (Oryza Sativa L.) using Composite Interval Mapping Analysis. Biosci Biotech Res Asia 2017;14(1). |
| Copy the following to cite this URL: Sahu V. K, Nair S. K, Vishwakarma A. K, Verulkar S. B, Chandel G. QTL Hotspots Detected for Yield Contributing Traits in Rice (Oryza Sativa L.) using Composite Interval Mapping Analysis. Biosci Biotech Res Asia 2017;14(1). Available from: https://www.biotech-asia.org/?p=23102 |
Introduction
Rice (Oryza sativa L.) is one of the most important food crops worldwide and staple foods for more than half of the world’s population including two billion Asians, and more than 70 percent Indians. It contributes 43 percent to the total food grain and 53 per cent to the cereal production and thus holds the key to sustain food sufficiency in the country (Siddiq et al. 2004). To meet the growing demand from human population which is expected to touch 9 billion by 2050, rice varieties with higher yield potential and greater yield stability need to be developed (Marathi et al. 2012). The major way to meet the projected production demand is to integrate the classical breeding techniques with modern biotechnological tools for rice improvement (Collard et al. 2008).
Yield and yield related traits are a complex in nature and governed by several minor genes, quantitative trait loci and affected by environmental factors. These traits also showed continuous variation in segregating populations. Rice varieties differ tremendously in the levels of grain yield, with immense variability in the combinations of component traits owing to the vast diversity of genetic constitutions. The inheritance of quantitative traits classically involves multiple genes, each having a small effect that is sensitive to environmental changes. These traits are known in general as having low heritability and thus have earned the reputation of being difficult to investigate. Presence of significant G × E interaction has been reported by comparing QTLs detected in multiple environments. The disappearance of QTLs detected in one environment in another has been considered a manifestation of G × E interaction and the detection of QTLs with consistent expression across environments is considered as stability indicator for the utilization of these QTLs in breeding program (Cho et al. 2007). However, the development of molecular marker, genome mapping, and QTL analysis technologies has greatly facilitated the investigation of genetic bases of quantitative traits for a single Mendelian genetic dissection study and can further clarify the genetic effects of their size and mode of action (Meng et al. 2012). This is important not only for an understanding of the genetic mechanism of agronomic traits in rice, but also for molecular marker assisted selection. In rice, researchers have constructed high-density genetic linkage maps based on restriction fragment length polymorphism (RFLP) and simple sequence repeat (SSR) markers (McCouch et al. 2002). Mapping population’s specifically designed for dissecting the genetic bases of yield traits via QTL mapping have been constructed, producing large amounts of data leading to the identification of hundreds of QTLs for yield traits.
Based on the above, a study was planned to understand the genetic mechanism and molecular players of the traits associated with grain yield using molecular marker technology with objectives to map novel genomic regions and QTL hotspots influencing grain yield and its component traits by using the two locations phenotypic data of F5 recombinant inbred population generated by new parental cross combination of Swarna and IR86931B-6 rice genotypes.
Experimental
Materials and Methods
The experimental material for the present investigation comprised of 85 lines of F5 population derived from Swarna (a high yielding Semi-dwarf widely adapted indica variety) with IR86931B-6 (Semi-tall, inter specific line derived from Nagina22).
Evaluation of F5 Recombinant Inbreed Lines
The F5 RILs were evaluated with two replications in randomized block design under irrigated condition at two different locations in Raipur. The data for yield and yield contributing traits were recorded from three selected representative plants in all the genotypes in each location in replicates. The method adopted for recording observation for each of the fifteen characters is presented as: Seedling height (SH) at seedling stage was measured in cm from base to tip of leaf at 25 days after sowing (DAS). Total number of tillers per m2 area (TT) were counted and recorded at maturity. Total number of Effective tillers (panicle bearing tillers) in per m2 area (ET) were counted and recorded at the time of harvest. Plant height (PH) was measured in cm from base to tip of leaf on main tiller at harvest of the crop. Flag leaf length (FLL) of the main tiller was measured in cm at beginning of anthesis. Flag leaf width (FLW) of the main tiller was measured in cm at beginning of anthesis. Flag leaf area (FLA) was recorded by multiplication of FLL and FLW (FLA = FLL* FLW). Number of days taken from sowing to panicle emergence in 50 per cent of the population was recorded as days to fifty percent flowering (DFF). Panicle length was recorded as (PL) length of the primary panicle from the panicle base to tip was measured in centimeter and recorded. Panicle Weight (PW) was recorded as weights of 3 random panicles in grams at maturity. Total number of filled grains in each of 12 random panicles was counted and the mean was calculated and recorded as grain per panicle (GPP). Hundred grain weight (HGW) recorded as weight of 100 grains selected at random from each genotype in grams. Total number of filled and unfilled grains was counted from 12 randomly selected panicles and mean filled and unfilled grains per panicle were calculated to estimate the per cent fertile spikelets in a panicle. Harvest Index (HI) is the ratio between the grain yield and the total dry matter of the plant. Grain yield per m2 (YLD), the weight of the dried (14% moisture) and cleaned grains from the plants grown in one meter2 area were measured and expressed in grams.
Statistical Analysis of the Phenotypic Data
Analysis of variance (ANOVA), test of significance of variance components were carried out as suggested by Panse and Sukhatme, (1967). Frequency distributions estimated and histograms were plotted for characters with the help of Statistica7 software (Sa 2007). All data was analyzed without any transformation.
The genetic parameters like genotypic and phenotypic coefficients of variation (GCV and PCV), heritability in broad sense (h2), expected genetic advance (GA), Coefficient correlation was calculated for all possible combination among the characters at genotypic, phenotypic and environmental levels were estimated with the help of SPAR 1 (Doshi and Gupta 1991). The significance of correlation coefficients was tested, against Fisher’s table value (1936) for (g-2) degree of freedom at 5 % and 1 % level of significance, where g is the number of genotypes. The calculated (r) is then compared with table value of ‘r’ at 5% and 1% level of significance (Snedecor and Cochran 1967).
Genomic DNA Isolation, Polymorphism Survey and Genotyping of Mapping Population
For generating the genotypic data DNA was extracted from fresh leaf tissues as described by modified CTAB (Pervaiz et al. 2011) method with slight modifications, further quantification and diluted to final concentration of 50ηg/μl for PCR analysis. The polymerase chain reaction (PCR) was carried out in 96 well PCR plates obtained from Axygen Scientific Inc. Union city CA, USA. The 20 µl master mix consisted of 50 ηg of genomic DNA, 1 U of Taq DNA polymerase, 1 X PCR assay buffer with 1.5 mM MgCl2, 10µM each of forward and reverse primer and 1 mM of dNTP mix was prepared on ice and the PCR plate was immediately loaded in the thermal cycler (Verity, Applied Biosystem USA) for PCR using conditions of (1) Initial denaturation at 94°C for 5 min; (2) 35 cycles of 94°C for 1 min; 55-60°C (depending on marker) for 1min; 72°C for 2 min; (3) final extension at 72°C for 5min.
A set of 343 marker loci comprising of 156 HvSSR (Highly variable simple sequence repeats), 176 SSR (Simple sequence repeats) and 11 belong to RGNMS (Rice genic non coding micro satellites) were used for polymorphism survey between Swarna and IR86931B-6. Out of 176 SSR used, 38 were previously reported (Marathi et al. 2012, Kotla et al. 2013) QTL specific markers for yield and yield contributing traits. The primer sequences for RM series markers were obtained from (McCouch et al. 2002, Temnykh et al. 2000, Chen et al. 1997) and gramene SSR markers web resources (www.gramene.org), RGNMS markers (Parida et al. 2009) and HvSSR (Harvinder et al. 2010). Genotypic data was generated with a set of 83 polymorphic primers providing genome wide coverage i.e. RGNMS, SSR and HvSSR markers. Chi square test (χ2) was done for these polymorphic markers to check the marker segregation pattern.
Development of Linkage Map and QTL Mapping
Linkage map based on 83 polymorphic markers and position of QTLs on Chromosomes was identified using Single marker analysis (SMA) and composite interval mapping (CIM) performed using programme QTL cartographer 2.5 (Wang et al. 2005) with a 2.5 threshold value. Identified major effects QTLs along with their markers were mapped in 12 rice chromosomes with the help of MapChart version 2.3. Nomenclature for QTLs was first two or three letter abbreviation followed by the identity of the chromosome on which the QTL is found and a terminal suffix with unique identifier to distinguish multiple QTL on a single chromosome was used (McCouch 1997). QTLs identified in the present study were compared with earlier reported QTLs and the QTLs available in gramene database to detect common QTLs across populations for 13 traits. QTLs on the same chromosomal region as found in the present study were selected for detailed comparisons. The rice genetic linkage map (the Cornell SSR map) were used to compare QTL locations found in the present study and co localized with validated QTLs. QTLs were identified as potentially novel if the marker intervals harboring QTLs were not significantly overlapping the previously reported marker intervals. QTL hotspots were identified manually as reported from Marathi et al. (2012) by searching in a sliding window of 20 cM in the original QTL data and the regions with more than three co-locating QTLs in each window region were recorded. The window was advanced in 5 cM steps across the entire genetic map and the maximum number of QTL in a window region was recorded.
Results and Discussion
Trait Performance
The mean performance of parents and minimum and maximum trait values of F5 RILs at two locations are presented in table 1. The results of ANOVA revealed highly significant mean sum of squares for all the traits in both location, suggesting presence of sufficient variation among the genotypes for these traits. Hence, there is scope to select desirable F5 lines with higher productivity combining favorable yield contributing traits. In the mapping population developed for the present study, wider variability was observed for all the traits as indicated by the range and co-efficient of variation, this provides more opportunities to select plants with different combination of desirable traits. Maximum variability was observed for grain per panicle and yield per m2 in location 1(L1) and for harvest index at location 2 (L2) whereas, Minimum variability was observed for flag leaf width and days to fifty percent flowering at location 1 and two respectively.
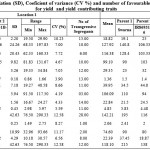 |
Table 1: Trait means, range, standard deviation (SD), Coeficient of variance (CV %) and number of favourable transgressive segregants over better parent for yield and yield contributing traits |
The transgressive variation was noticed for all the traits and it was noticed in both direction which indicated that neither of the parents carried the entire positive or all the negative alleles. The frequency distribution showed continuous variation and approximately followed normal distribution for most of the traits, indicated the polygenic (quantitative) nature of these yield contributing traits (figure 1).
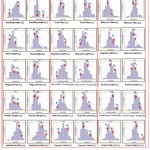 |
Figure 1: Frequency Distribution of Yield and Yield Contributing Traits in Location1 and Location 2
|
Heritability, Genetic Advance, Variability and Correlation
In the present study, considerably high genetic variability, heritability and genetic advance (GA) were observed in the F5 mapping population for most of yield contributing traits (table 2). This indicated that, the advanced breeding combined with direct selection for yield along with important productivity traits in irrigated condition could be highly effective in improvement of yield in rice. According to Johnson et al. (1955), high heritability coupled with high GA, are normally more helpful than heritability alone and it indicates that the heritability is due to additive gene action and selection may be effective.
Table 2: Broad sense heritability, Genetic advance (GA) as per cent of mean, phenotypic coefficient of variance (PCV) and genotypic Coefficient of variance (GCV) for yield and yield contributing traits
| Character | Location 1 | Location 2 | ||||||
| Heritability | Genetic advance | GCV | PCV | Heritability | Genetic advance | GCV | PCV | |
| Seedling Height (cm) | 45 | 02.34 | 02.15 | 08.9 | 70 | 3.22 | 09.91 | 11.84 |
| Total Tiller per m2 | 74 | 21.44 | 10.18 | 11.84 | 93 | 48.46 | 19.06 | 19.75 |
| Effective Tiller per m2 | 08 | 05.82 | 10.30 | 33.20 | 92 | 41.5 | 18.05 | 18.81 |
| Plant Height (cm) | 79 | 17.21 | 10.61 | 10.85 | 78 | 17.91 | 09.95 | 11.29 |
| Flag Leaf Length (cm) | 66 | 08.98 | 05.09 | 06.26 | 80 | 11.61 | 05.95 | 06.67 |
| Flag Leaf Width (cm) | 50 | 02.73 | 06.83 | 09.63 | 84 | 8.34 | 15.05 | 16.42 |
| Flag Leaf Area (cm) | 86 | 00.27 | 10.76 | 11.61 | 88 | 0.34 | 12.77 | 13.59 |
| Days to 50% Flowering | 72 | 08.89 | 14.15 | 16.61 | 85 | 15.76 | 20.74 | 22.46 |
| Panicle Length (cm) | 60 | 01.79 | 05.07 | 06.53 | 51 | 1.93 | 05.75 | 08.04 |
| Panicle Weight (gm) | 57 | 00.48 | 06.36 | 08.42 | 77 | 0.87 | 09.96 | 11.35 |
| Grain per Panicle | 52 | 00.23 | 10.12 | 10.16 | 79 | 0.4 | 10.53 | 11.81 |
| 100 Grain Weight (gm) | 78 | 52.72 | 18.8 | 21.33 | 96 | 68.16 | 23.71 | 24.17 |
| Spikelet Fertility (%) | 44 | 07.91 | 10.23 | 12.01 | 66 | 11.32 | 09.04 | 11.09 |
| Harvest Index (%) | 65 | 04.22 | 11.4 | 14.09 | 94 | 16.54 | 37.06 | 38.30 |
| Yield per m2 (gm) | 76 | 45.01 | 10.02 | 11.08 | 92 | 55.01 | 23.46 | 24.34 |
Coefficient of variation truly provides a relative measure of variance among the different traits. In our study close relationship between GCV and PCV were found in all the traits in both location except for number of effective tillers per m2 in location 1, here PCV is more than twice of GCV (table 2). This finding was in agreement with Zahid et al. (2006), who also observed similar results also in yield and yield related traits. Association of yield with yield related traits revealed the Significant correlations between yield and yield related traits in F5 mapping population.
Correlation coefficients with > 0.707 are considered as highly significant, because at this level each trait influences the other trait to an extent of more than 50 per cent (Snedecor and Cochreham, 1989). We found such significant relationship between TT and ET in both locations (table 3) will be useful for selection programmes to increase the chances of simultaneously improving two or more traits. Similar results for TT and ET was also reported by Kumar et al. 2014.
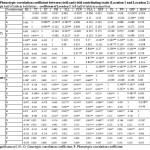 |
Table 3: Genotypic and Phenotypic correlation coefficient between yield and yield contributing traits (Location 1 and Location 2) Coefficient of Location 1: coefficient of Location 2: |
right half of table in bold letters ; left half of table in normal font
**Significant at 0.01; *Significant at 0.05; G: Genotypic correlation coefficient; P: Phenotypic correlation coefficient
Identification of Qtls for Yield and its Contributing Traits
Parental Polymorphism Survey and Construction of Linkage Map
Parental polymorphism survey at 343 loci revealed that 83 loci (24.20%) were found polymorphic between parents. Out of total polymorphism percentage, HvSSR, SSR and RGNMS marker showed 19.23% (30), 28.98% (51) and 18.18% (2) polymorphic ratio respectively. The highest percentage of polymorphism was obtained on chromosome 2 (41.67%) and lowest on chromosome 12 (6.67%). In chromosome three, 24 polymorphic markers were obtained, which was maximum among all chromosomes. Based on these polymorphic markers linkage map was constructed with a total map length of 1275.24 cM. The average interval size was 21.68 cM, the smallest size in chr 3 (6.02 cM), and the largest in chr.8 (32.93 cM). Marker segregation analysis of 83 polymorphic markers showed that only 14 (16.87 %) markers followed mendelian segregation, rest of the 69 markers, 50 (60.24%) were skewed towards Swarna and 19 (22.89%) were skewed towards IR86931B-6. The single marker analysis showed that, A total of 158 loci (consisting commonly associated markers for some traits) were significantly associated with yield and yield contributing traits in both locations exactly.
Identification of Major And Minor Effects Qtls by Composite Interval Mapping (CIM)
The genotypic data thus generated along with phenotypic date recorded in the field was used for identification and mapping of QTLs by calculating threshold logarithm of odds (LOD) for each trait by performing test with 1000 permutations. The experimental threshold LOD mean were 2.5 at 5% level of significance in both locations. A total of 130 QTLs (major and minor) spread over 11 linkage groups were detected for all phenotyped yield and related traits except DFF and PL, across two locations. Out of 130 identified QTLs for yield and related traits, 36 QTLs were found as major
Table 4: Major effects QTLs detected by composite interval mapping across two locations
| Trait/SN | QTLs | CHR | FLANKING MARKER | QTL Size (cM) | Peak Position (cM) | QTL interval | QTL interval | LOD Score | Additive effect | Dominance effect | Phenotypic variance (R2) % | |||||||||
| L1 | L2 | L1 | L2 | L1 | L2 | L1 | L2 | L1 | L2 | L1 | L2 | L1 | L2 | |||||||
| Seedling Height | ||||||||||||||||||||
| 1 | qSH1.1 | 1 | HVSSR01-07 – RM283 | – | 2.5 | – | 18.6 | – | – | 17.35 | 19.85 | – | 4.57 | – | 1.26 | – | 0.79 | – | 17 | |
| Total Tiller | ||||||||||||||||||||
| 2 | qTT3.3 | 3 | RM338 – RM3698 | 14 | 3 | 55.9 | 55.9 | 48.9 | 62.9 | 54.4 | 57.4 | 3.7 | 3.98 | 3.7 | 5.21 | 54.33 | 63.45 | 8 | 16 | |
| 3 | qTT4.3 | 4 | RM307 – RM1112 | 4 | 3.1 | 133.9 | 134.9 | 131.9 | 135.9 | 133.35 | 136.45 | 3.58 | 3.45 | 1.48 | 5.51 | 54.35 | 60.97 | 3 | 11 | |
| Effective Tiller | ||||||||||||||||||||
| 4 | qET3.5 | 3 | RM338 – RM3698 | 21.9 | – | 55.9 | – | 44.95 | 66.85 | – | – | 3.79 | – | 5.64 | – | 56.65 | – | 18 | – | |
| 5 | qET10.1 | 10 | HVSSR10-30 – HVSSR10-34 | 46.9 | 44 | 38 | 38 | 14.55 | 61.45 | 16 | 60 | 3.71 | 5.8 | 5.77 | 4.82 | 52.05 | 53.6 | 1 | 11 | |
| Plant Height | ||||||||||||||||||||
| 6 | qPH1.2 | 1 | RM3746 – RM1003 | 45.5 | 71 | 68.6 | 118.6 | 45.85 | 91.35 | 83.1 | 154.1 | 4.37 | 4.08 | 4.14 | 1.43 | 22.88 | 24.83 | 10 | 8 | |
| 7 | qPH3.2 | 3 | RM49 – RM7576 | 2.1 | 1.8 | 22.5 | 22.5 | 21.45 | 23.55 | 21.6 | 23.4 | 3.9 | 4.4 | 0.11 | 0.47 | 30.31 | 33.61 | 7 | 10 | |
| Flag Leaf Length | ||||||||||||||||||||
| 8 | qFLL3.1 | 3 | HVSSR03-80 – HVSSR03-91 | – | 7.4 | – | 128.7 | – | – | 125 | 132.4 | – | 3.12 | – | 2.51 | – | 4.97 | – | 46 | |
| Flag Leaf Width | ||||||||||||||||||||
| 9 | qFLW2.3 | 2 | HVSSR02-50 – HVSSR02-60 | 9 | 13.5 | 86.7 | 88.7 | 82.2 | 91.2 | 81.95 | 95.45 | 4.63 | 2.56 | 0.06 | 0.06 | 0.33 | 0.36 | 21 | 10 | |
| 10 | qFLW2.4 | 2 | HVSSR02-60 – RM6318 | 2.2 | 2.5 | 95.6 | 95.6 | 94.5 | 96.7 | 94.35 | 96.85 | 4.28 | 3.72 | 0.05- | 0.05 | 0.28 | 0.38 | 10 | 6 | |
| 11 | qFLW3.4 | 3 | RM6959 – RM16 | – | 10.8 | – | 89.1 | – | – | 83.7 | 94.5 | – | 2.57 | – | 0.08 | – | 0.2 | – | 14 | |
| 12 | qFLW6.1 | 6 | HVSSR06-43 – HVSSR06-44 | 12.9 | 28.4 | 38 | 14.2 | 31.55 | 44.45 | 0 | 28.4 | 4.44 | 3.43 | 0.07 | 0.08 | 0.38 | 0.38 | 8 | 18 | |
| 13 | qFLW6.2 | 6 | HVSSR06-43 – HVSSR06-44 | – | 12.8 | – | 31 | – | – | 24.6 | 37.4 | – | 2.52 | – | 0.09 | – | 0.38 | – | 23 | |
| 14 | qFLW9.1 | 9 | RM316 – RM278 | 27.3 | – | 34 | – | 20.35 | 47.65 | – | – | 3 | – | 0.04 | – | 0.34 | – | 10 | – | |
| 15 | qFLW10.1 | 10 | HVSSR10-30 – HVSSR10-34 | 46.7 | – | 40 | – | 16.65 | 63.35 | – | – | 3.41 | – | 0.01 | – | 0.34 | – | 14 | – | |
| Flag Leaf Area | ||||||||||||||||||||
| 16 | qFLA3.1 | 3 | RM3698 – RM16 | – | 4 | – | 90.1 | – | – | 88.1 | 92.1 | – | 3.33 | – | 2.85 | – | 10.04 | – | 11 | |
| Panicle Weight | ||||||||||||||||||||
| 17 | qPW2.1 | 2 | HVSSR02-77 – HVSSR02-86 | – | 15 | – | 133.2 | – | – | 125.7 | 140.7 | – | 2.53 | – | 0.17 | – | 0.2 | – | 11 | |
| 18 | qPW4.1 | 4 | RM3276 – RM1112 | – | 5.5 | – | 130.9 | – | – | 128.15 | 133.65 | – | 3.1 | – | 0.18 | – | 0.41 | – | 13 | |
| Grain Per Panicle | ||||||||||||||||||||
| 19 | qGPP1.1 | 1 | HVSSR01-07 – RM283 | – | 2 | – | 18.6 | – | – | 17.6 | 19.6 | – | 4.03 | – | 21.75 | – | 2.91 | – | 13 | |
| 20 | qGPP3.1 | 3 | RM3698 – RM16 | – | 3 | – | 91.1 | – | – | 89.6 | 92.6 | – | 6.36 | – | 27.07 | – | 0.68 | – | 33 | |
| 21 | qGPP3.2 | 3 | RM3698 – HVSSR03-69 | 7 | – | 91.1 | 87.6 | 94.6 | – | – | 3.19 | 17.78 | 2.95 | 20 | – | |||||
| 22 | qGPP4.1 | 4 | HVSSR04-37 – RM3276 | 28.5 | – | 96.2 | – | 81.95 | 110.45 | – | – | 3.45 | – | 12.44 | – | 29.09 | – | 12 | – | |
| 23 | qGPP9.1 | 9 | RM316 – RM278 | 22.5 | 41 | 34 | 62 | 22.75 | 45.25 | 41.5 | 82.5 | 2.99 | 3.34 | 20.32 | 27.32 | 74.78 | 24.97 | 4 | 30 | |
| Hundred Grain Weight | ||||||||||||||||||||
| 24 | qHGW2.1 | 2 | RM452 – HVSSR02-60 | 30 | – | 79.7 | – | 64.7 | 94.7 | – | – | 3.24 | – | 0.09 | – | 0.42 | – | 10 | – | |
| 25 | qHGW3.1 | 3 | RM07 – HVSSR03-37 | 9 | – | 53.9 | – | 49.4 | 58.4 | – | – | 3.4 | – | 0.11 | – | 0.27 | – | 19 | – | |
| 26 | qHGW3.2 | 3 | RM6959 – RM3698 | – | 23 | – | 71 | – | – | 59.5 | 82.5 | – | 2.75 | – | 0.08 | – | 0.3 | – | 19 | |
| 27 | qHGW6.1 | 6 | HVSSR06-43 – HVSSR06-44 | – | 13 | – | 52 | – | – | 45.5 | 58.5 | – | 2.56 | – | 0.1 | – | 0.38 | – | 28 | |
| Spikelet Fertility | ||||||||||||||||||||
| 28 | qSF1.1 | 1 | RM1003 – RM5389 | 6 | – | 137.9 | – | 134.9 | 140.9 | – | – | 2.56 | – | 4.29 | – | 5.65 | – | 11 | – | |
| 29 | qSF3.1 | 3 | RM5474 – RM49 | – | 1.5 | – | 19.8 | – | – | 19.05 | 20.55 | – | 6.45 | – | 6.19 | – | 4.28 | – | 25 | |
| Harvest Index | ||||||||||||||||||||
| 30 | qHI2.1 | 2 | RM12368 – HVSSR02-50 | 24.3 | – | 34 | – | 21.85 | 46.15 | – | – | 4.48 | – | 3.25 | – | 12.18 | – | 12 | – | |
| 31 | qHI3.1 | 3 | RM489 – RM49 | – | 3 | – | 19.3 | – | – | 17.8 | 20.8 | – | 2.59 | – | 4.02 | – | 2.03 | – | 19 | |
| 32 | qHI7.1 | 7 | RM11 – RM70 | – | 9 | – | 82 | – | – | 77.5 | 86.5 | – | 2.94 | – | 5.86 | – | 1.3 | – | 25 | |
| 33 | qHI8.1 | 8 | RM25 – HVSSR08-46 | 43.2 | – | 91.5 | – | 69.9 | 113.1 | – | – | 2.62 | – | 3.28 | – | 1.54 | – | 22 | – | |
| Yield per meter2 | ||||||||||||||||||||
| 34 | qYLD1.1 | 1 | HVSSR01-07 – RM3746 | – | 4.3 | – | 21.6 | – | – | 19.45 | 23.75 | – | 2.69 | – | 10.13 | – | 42.91 | – | 13 | |
| 35 | qYLD2.1 | 2 | RM12368 – HVSSR02-50 | 9.5 | – | 38.3 | 33.55 | 43.05 | – | – | 6.97 | 5.25 | 45.66 | 10 | – | |||||
| 36 | qYLD5.1 | 5 | RM3683 – HVSSR05-57 | 7.1 | – | 89.7 | – | 86.15 | 93.25 | – | – | 2.68 | – | 6.75 | – | 48.48 | – | 13 | – | |
Where; SH: Seedling Height; TT: Total Tiller/m2 ; ET: Effective Tiller/m2; PH: Plant Height; FLL: Flag Leaf Length (cm); FLW: Flag Leaf Width (cm); FLA: Flag Leaf Area (cm2); PW: panicle Weight (gm); GPP: Grain Per panicle; HGW: Hundred Grain Weight (gm); SF: Spikelet Fertility (%); HI: Harvest Index (%); YLD: Yield/m2; L1: location 1; L2: Location 2; LOD: Log of Odds; R2: Phenotypic Variance; TR2; Total Phenotypic Variance; cM: centi Morgan
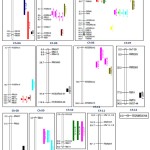 |
Figure 2: Molecular linkage map showing the position of major effects QTLs for yield and yield contributing 13 traits in rice chromosomes
|
effects QTLs across two locations with minimum LOD threshold value 2.5 and having ≥10% phenotypic variance (table 4) and rest of the other QTLs were minor effects QTLs with less than 10% phenotypic variance.
All major effects QTLs were mapped in 12 rice chromosomes based on their positions (figure 2). Out of these 9 QTLs were common in both locations whereas 12 QTLs were present in location one and 15 QTLs were present in location two. Maximum 7 major effects QTL was identified for FLW (qFLW2.3, qFLW2.4, qFLW6.1, qFLW6.3, qFLW9.1 and qFLW10.1) in chromosome 2, 6, 9 and 10 followed by 5 major effects QTLs were observed for GPP (qGPP1.1, qGPP3.1, qGPP3.2, qGPP4.1 and qGPP9.1) in chromosome 1, 3, 4 and 9 whereas minimum major effects QTLs were identified for SH (qSH1.1), FLL (qFLL3.1), FLA (qFLA3.1) in chromosome one and three. Maximum number (11 QTLs) of major effects QTLs were found in chromosome three. Among these QTL qFLL3.1 (LOD-3.12) has highest phenotypic variance with additive effects of 2.1, dominance effects of 4.97and variance (R2 %) of 46 percent.
Seedling height is also important trait for initial level screening of plant condition. Only one major effect QTL (qSH1.1) was detected for this trait on location 2 on chromosome1 with LOD value 4.57 and phenotypic variance 17 percent. This might be novel QTL region for this trait because previously identified QTL for this trait by Abe et al. 2012 was presented on chromosome 3.
Appropriate total tiller, number of effective tillers and plant height are prerequisites for attaining the increased yield level in rice breeding programme. For these traits, two major effects, for TT (qTT3.3 and qTT4.3) and ET (qET3.5 and qET10.1) were present in Location two. Kotla et al. 2013 also reported QTLs for tiller number in chromosome number 2 and 3 respectively. Similarly in RIL population, Zhou et al. 2013 reported Five QTLs for the tiller number per plant on chromosomes 3, 4, 6, 9, and 12, respectively. The major effect QTLs contributed the most, up to 10%, indicating that the number of tiller per plant was controlled by multiple quantitative trait genes.
Plant height is an important agronomic trait that determines the yielding potential of rice variety. Plant height is known to be controlled in both major and minor genes but most of the relevant reports confirmed its polygenic nature (Rahman et al. 2007). Only two major effect QTL, qPH1.2 with LOD value 4.37 in L1and 4.08 in L2) and qPH3.1 (with LOD value3.9 in L1and 4.4 in L2) has been observed for this trait in both locations. Detecting the major effect QTLs controlling plant height at vegetative and maturity is useful in practical breeding and agriculture. Similarly Wang et al. 2012, Marathi et al. 2012 and Kotla et al. 2013 also reported QTLs for plant height in different mapping population.
It was reported that the source leaves, particularly the flag leaves, were associated with improved grain filling, 1000-grain weight and panicle weight as well as other yield-related traits in cereal crops (Quarrie et al. 2006). In our present study similar results observed where FLL, FLW and FLA positively correlated (both genotypically and phenotypically) with PL, PW, GPP and HGW which confirms the previous findings. Compared to other leaves, the flag leaf contributes the most photosynthetic assimilates in rice therefore; it assumes the Flag leaf length, width and area has greatest importance in terms of grain yield (Lupton, 1973). The above sentences proven by the 9 major effects QTLs identified related to these traits. Out of 9 QTLs, one QTL for FLL (qFLL3.1), 7 QTLs for FLW (qFLW2.3, qFLW2.4, qFLW3.4, qFLW6.1, qFLW6.2, qFLW9.1, qFLW10.1 and one QTL for FLA (qFLA3.1). The QTL, qFLL3.1 was found for flag leaf length has highest phenotypic variance (46%) among all the traits with 3.12 LOD value. Similar findings also observed by Wang et al. (2012) on BRILs (backcross recombinant inbreed lines, Marathi et al. (2012) also reported 14 QTLs for FLL in RIL population across three locations.
Simple selection criterion for yield can be increased by selecting plants with many heavy panicles, increasing the number of grain per panicle, heavy grain weight and high percentage of spikelet fertility. Total of 13 major effects QTLs found for these traits viz PW (qPW2.1 and qPW4.1), GPP (qGPP1.1, qGPP3.1, qGPP3.2, qGPP4.1, and qGPP9.1), HGW (qHGW2.1, qHGW3.1, qHGW3.2 and qHGW6.1) and SF (qSF1.1 and qSF3.1). Similar results also observed by Wang et al. (2012), and Zhou et al. (2013) in different mapping populations for the same traits, which confirms our findings.
Harvest index is also has a major importance in rice yield. Higher the HI value may increase the yield also. A total of 4 major effects QTLs identified (two QTLs in each locations) for HI viz qHI2.1, qHI3.1, qHI7.1, qHI8.1. Previously Sabouri et al. (2009) reported eight significant QTLs across ten environments which showed the importance of this trait.
In the present study, for yield three major effects QTLs viz qYLD1.1, qYLD2.1, qYLD5.1 were identified in chromosome 1, 2 and 5. The additive effects of this QTL were also high with 6.25 and 5.25. For plot yield Swamy et al. (2011) also reported three QTLs qPYLD3.1, qPYLD4.1 and qPYLD4.2 were detected on two chromosomes. Marathi et al. (2012) also reported 5 QTL for Grain yield per plant. A major QTL, qYLD4-1, was identified with LOD 3.28 explaining 15% of phenotypic variation.
Co localization of Known QTLs
In the present study, total 6 known QTLs from study of Kotla et al. (2013) and Marathi et al. (2012) were validated by single marker analysis and co localized, in the background of Swarna and IR86931B-6 derived mapping population flanked by 8 significant marker loci governing the QTLs for plant height (qph3.1, flanked with RM16 and RM489), number of tillers (qnt3.1, flanked with RM7 and RM514; qnt3.2, flanked with RM514 and RM517) and thousand grain weight (qTGW3-4, flanked with RM3698 and RM16; qTGW4-1, flanked with RM3276 and RM1112) and panicles per plant (qPPP4-2, flanked with RM3276 and RM1112) in 3 and 4, chromosome. These co localized regions of yield related traits will be further useful for identification of putative candidate gene by fine mapping and used for the cloning purpose and further breeding programme. Liu et al. (2010) also validated QTLs, SPP3b and TGW3b in the BC3F2 population governing the trait spikelet per panicle and thousand grain weights in chromosomal 3. This gives strength of our validated QTLs, for hunderd grain weight in same chromosomal region (Figure 3).
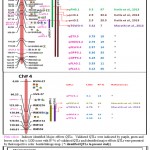 |
Figure 3: Position of validated QTLs (qTGW3.4, qPH3.1, qnt3.1 and qnt3.2; qPPP4-2, qTGW4-1) in molecular linkage map of chromosome 3 in and 4 respectively along with the identified QTLs hotspots and major effects QTLs. |
QTLs were presented by their respective color beside linkage map. ( *: identified QTLs in present study)
QTL Hot Spots (Clusters)
While considering phenotypic and genetic correlation it is very interesting to examine co localized QTLs for breeding perspective. One of the central concepts in genetical genomics is the existence of QTL hotspots, where a single polymorphism leads to widespread downstream changes in the expression of distant genes, which are all mapping to the same genomic locus (Schadt et al. 2003). In this study 5 QTLs hotspots containing 37 QTLs affecting many traits were identified in chromosome 3 and chromosome 4 between colocalized QTLs flanking marker regions of which, some are either genetically correlated or allometrically related. Out of 37 QTLs, 14 was major effects QTLs with more than 10% phenotypic variance having minimum 3 LOD value and 23 minor effects QTLs less than 10 % phenotypic variance.
Out of 14 major effects QTLs 12 found in chromosome 3 and only 2 major effect QTLs (qTT4.3 and qPW4.1) were found to be present on chromosome 4 for total tiller and panicle weight (Table 5; Figure 3).
Table 5: QTL Hotspots (with with minor and major effects QTLs) Identified in the Region of co-localized QTLs
| SN | Chr | Co-localized
QTLs |
Flanking markers | Peak interval | No of QTLs | Name of QTLs |
| 1 | 3 | qTGW3-4 | RM3698 – RM16 | 87.13 – 92.50 | 5 | qPH3.4, qFLW3.4, qFLW3.5, qFLA3.1,
qGPP3.1 |
| 2 | 3 | qph3.1 | RM489 – RM16 | 17.33- 92.50 | 22 | qTT3.1, qTT3.2, qTT3.3, qET3.1, qET3.2, qET3.3, qET3.5, qPH3.2, qPH3.3, qPH3.4, qFLW3.2, qFLW3.3, qFLW3.4, qFLW3.5, qFLA3.1, qGPP3.1, qHGW3.1, qHGW3.2, qSF3.1, qSF3.2, qSF3.3, qYLD3.1 |
| 3 | 3 | qnt3.1 | RM7 – RM514 | 24.66 – 141.12 | 23 | qTT3.3, qTT3.4, qET3.4, qET3.5, qPH3.3, qPH3.4, qPH3.5, qPH3.6, qFLL3.1, qFLW3.2, qFLW3.3, qFLW3.4, qFLW3.5, qFLW3.6, qFLA3.1, qGPP3.1, qGPP3.2, qHGW3.1, qHGW3.2, qSF3.2, qSF3.3, qYLD3.1, qYLD3.2 |
| 4 | 3 | qnt3.2 | RM517 – RM514 | 39.32 – 141.12 | 25 | qTT3.2, qTT3.3, qTT3.4, qET3.3, qET3.4, qET3.5, qPH3.3, qPH3.4, qPH3.5, qPH3.6, qFLL3.1, qFLW3.2, qFLW3.3, qFLW3.4, qFLW3.5, qFLW3.6, qFLA3.1, qGPP3.1, qGPP3.2, qHGW3.1, qHGW3.2, qSF3.2, qSF3.3, qYLD3.1, qYLD3.2 |
| 5 | 4 | qPPP4-2 | RM3276 – RM1112 | 121.99 – 136.94 | 5 | qTT4.3, qET4.3, qPH4.4, qPW4.1, qHI4.1 |
| 6 | 4 | qTGW4-1 | RM3276 – RM1112 | 121.99 – 136.94 | 5 | qTT4.3, qET4.3, qPH4.4, qPW4.1, qHI4.1 |
Note : Major effects QTLs (R2≥ 10%) were indicated in bold letter.
According to Marathi et al, 2012, it is very difficult to know the contributing mechanism between all these traits in a hotspot as correlations do not suggest link between them. It is possible that these clusters represent more than one gene but the present mapping population resolution is not sufficient to differentiate whether it is due to either linkage or pleiotropy. It is observed that some hotspots contain QTLs that are not allometrically linked. It may possible that these loci represent trans acting QTL (most likely transcription factors) where the effect of alterations in regulation or structural characteristics would be expected to have smaller effects on many traits (Rae et al, 2009). It can be concluded that each QTLs present within a QTL hotspot region give strengthen to results that these all traits are relative to each other and might donate a small positive effect, but co- locality of some traits point out that choice for valuable allele at these loci will result in a cumulative increase in yield due to the integrative positive effect of various QTLs.
References
- Abe., Takagi H., Fujibe T., Aya K., Kojima M., Sakakibara H., Uemura A. Aiko Uemura OsGA20ox1, a candidate gene for a major QTL controlling seedling vigor in rice. Theoretical and Applied Genetics. 2012;125(4):647-57.
CrossRef - Cho T. G., Kang H. J., Lee J. S., Lee Y. T., Lim S. J., Gauch H., Eun M. Y., McCouch R. Identification of Quantitative Trait Loci in Rice for Yield, Yield Components, and Agronomic Traits across Years and Locations. Crop Science. 2007;47:2403–2417.
CrossRef - Collard B. C. Y., Mackill D. J. Marker-assisted selection: an approach for precision plant breeding in the twenty-first century. Philosophical Transactions of the Royal Society B: Biological Sciences. 2008;363:557-72.
CrossRef - Doshi S. P., Gupta K. C. SPAR 1: A statistical package for agricultural research data analysis. IASRI, New Delhi.
- Harvinder S., Deshmukh R. K., Singh A., Singh A. K., Gaikwad K., Sharma T. R., Mohapatra T., Singh N. K. Hypervariable SSR markers suitable for rice genotyping using agarose gels. Molecular Breeding. 2010;25(2):359-364.
CrossRef - Johnson H. W., Robinson H. F., Comstock R. E. Estimation of genetic and environmental variability in soybean. Agronomy Journal. 1955;47:477-483.
CrossRef - Kotla A., Agarwal S., Yadavalli V. R., Vinukonda V. P., Dhavala V. N. C., Neelamraju Quantitative Trait Loci and Candidate Genes for Yield and Related Traits in Madhukar x Swarna RIL Population of Rice. Journal of Crop Science and Biotechnology. 2013;16(1):35-44.
CrossRef - Kumar V., Koshta N., Sohgaura N., Koutu G. K. Genetic Evaluation of RILs Population for Yield and Quality Attributing Traits in Rice (Oryza sativa L.). Journal of Agricultural Technology. 2013;1(1):43-51.
- Lupton F. G. H. Selection criteria determining yield in semi dwarf wheat varieties. Annals of Applied Biology. 1973; 72:47-50.
- Marathi B., Guleria S., Mohapatra T., Parsad R., Mariappan N., Kurungara V. K., Atwal S. S., Prabhu K. V., Singh N. K., Singh A. K. QTL analysis of novel genomic regions associated with yield and yield related traits in new plant type based recombinant inbred lines of rice (Oryza sativa L.). BMC Plant Biology. 2012;12:137.
CrossRef - McCouch S., Teytelman L., Xu Y., Lobos K. B, Clare K., et al. Development and mapping of 2240 new SSR markers for rice (Oryza sativa ). DNA Research. 2002;9:199–207.
CrossRef - McCouch S. R., Cho Y. G., Yano M., Paul E. M., Blinstrub M., Morishima H., Kinoshita T. Report on QTL nomenclature. Rice Genetics Newsletter. 1997;14:11–13.
- Meng H., Chen S., Cheng Z., Chai D., Li Y. SRAP markers for fruit shape in cucumber. Pakistan Journal of Botany. 2012;44(4):1381-1384.
- Panse V. G., Sukhatme P. V. Statistical methods for agricultural workers. 2012; ICAR, New Delhi. 1967;97-151.
- Parida S. K., Kalia S. K., Dalal S. K., Hemaprabha V., Selvi G., Pandit A., Singh A., Gaikwad A., Sharma K., Srivastava T. R., Singh N. K., Mohapatra T. Informative genomic micro satellite markers for efficient geno typing applications in sugarcane. Theoritical and Applied Genetics. 2009;118:327-338.
CrossRef - Pervaiz Z. H., Turi N. A., Khaliq I., Rabbani M. A., Malik S. A. A modified method for high-quality DNA extraction for molecular analysis in cereal plants. Genetics and Molecular Research. 2011;10(3):1669-1673.
CrossRef - Quarrie S. A., Quarrie S. P., Radosevic R., Rancic D., Kaminska A., Barnes J. D., Leverington., Ceoloni C., Dodig D. Dissecting a wheat QTL for yield present in a range of environments: from the QTL to candidate genes. The Journal of Experimental Botany. 2006;57:2627–2637.
CrossRef - Rae A. M., Street N. R., Robinson M., Harris N., Taylor G. Five QTL hotspots for yield in short rotation coppice bioenergy poplar: The poplar biomass loci. BMC Plant Biology. 2009;9:23.
CrossRef - Rahman M. L., Chu S. H., Choi M. S., Qiao Y. L., Jiang W., Piao R., Khanam S., Cho Y. I., Jeung J. U., Jena K., Koh H. J. Identification of QTLs for some agronomic traits in rice using an introgression line from Oryza minuta. Molecular Cells. 2007;24:16-26.
- Sa J. Applied Statistics Using Spss, STATISTICA, Matlab and R. Berlin: Springer. 2007; ISBN 3-540-71971-7.
- Sabouri H., Sabouri A., Dadras A. R. Genetic dissection of biomass production, harvest index and panicle characteristics in indica-indica crosses of Iranian rice (Oryza sativa ) cultivars. Australian Journal of Crop Science. 2009;3(3):155-166.
- Schadt E. E., Monks S. A., Drake T. A., Lusis A. J., Che N., Collnayo V., Ruff T. G., Milligan S. B., Lamb J. R., Cavet G., Linsley A., Mao M., Stoughton R. B., Friend S. H. Genetics of gene expression surveyed in maiz mouse and man. Nature. 2003;422:297–302.
CrossRef - Siddiq A,, Roy J. K. Das S. R. Rice varietal improvement under cropping system approach. In: Recent Advances in Rice-based Farming Systems. 2004;20-35.
- Snedecor G. W., Cochran W. G. Statistical Methods, Eighth Edition. Iowa State University Press. UK.
- Swamy B. P. M., Prashant V., Dixit S., Ahmed H. U., Kumar A. Meta-analysis of grain yield QTL identified during agricultural drought in grasses showed consensus. BMC Genomics. 2011; 12:319.
CrossRef - Wang P., Zhou G., Cui K., Li Z., Yu S. Clustered QTL for source leaf size and yield traits in rice (Oryza sativa). Molecular Breeding. 2012;29:99–113.
CrossRef - Wang S., Basten C. J., Zeng Z. B. Windows QTL Cartographer. 2.5. Department of Statistics, North Carolina State University, Raleigh, NC. (http://statgen.ncsu.edu/qtl cart/WQTLCart.htm 2.5). 2005.
- Zahid M. A., Akhtar M., Sabir M., Manzoor Z., Awan T. Correlation and path analysis studies of yield and economic traits in basmati rice. Asian journal of Plant Science. 2006;5(4):643-645.
CrossRef - Zhou S., Zhu.,Wang F., Huang J., Wang G. Mapping of QTLs for yield and its components in a rice recombinant inbred line population. Pakistan Journal of Botany. 2013; 45(1): 183-189.

This work is licensed under a Creative Commons Attribution 4.0 International License.


