

Manuscript accepted on : 29 September 2016
Published online on: --
Plagiarism Check: Yes
Optimization of the Enzymatic Hydrolysis of Soy Protein Isolate by Alcalase and Trypsin
Leila Rostammiry1, Mohammad reza Saeidiasl1, Reza Safar2 and Rohollah Javadian3
1Department of Food Science and Technology, Sabzevar Branch, Islamic Azad University, Sabzevar, Iran.
2Agricultural Research Education and Extension Organization (AREEO),Iranian Fisheries Science Research Institute (IFSRI), Caspian Sea Ecology Research Center, Sari, Iran.
3Department of Fisheries, Ghaemshar Branch, Islamic Azad University, Ghaemshar, Iran.
DOI : http://dx.doi.org/10.13005/bbra/2435

ABSTRACT: Soybean protein isolate was hydrolyzed to obtain soybean polypeptide solution using alcalase and trypsin. The effects of three independent variables including E/S (X1), temperature (X2) and pH (X3), at three levels in actual and coded values (-1, 0, +1), were evaluated to determine the best complex of variables and the degree of hydrolysis (DH) has been considered as response to variables. Response Surface Methodology (RSM) based on Box-Behnken Design was applied to optimization the condition of enzymatic hydrolysis of soy protein isolate. The optimal reaction conditions of soybean protein isolate hydrolyzed by alcalase and trypsin were that the E/S was 4.38 and 4.49%; pH was 8 and 7.11; temperature was 46.21 and 41.85°C, respectively and hydrolysis time wa s 45 and 60 minute respectively. RSM generated model predicted DH that 15.9782% for alcalase and 20.471% for trypsin could be achieved at these conditions and this model was valid based on the DH value obtained from the experimental study which was quite similar with the predicted value. High yield of DH obtained from the optimization process could produce soy protein hydrolysate with good nutritional and functional properties.
KEYWORDS: acalase; Response Surface Methodolgy Soy Protein Isolate; trypsin;
Download this article as:| Copy the following to cite this article: Rostammiry L, Saeidiasl M. R, Safari R, Javadian R. Optimization of the Enzymatic Hydrolysis of Soy Protein Isolate by Alcalase and Trypsin. Biosci Biotech Res Asia 2017;14(1). |
| Copy the following to cite this URL: Rostammiry L, Saeidiasl M. R, Safari R, Javadian R. Optimization of the Enzymatic Hydrolysis of Soy Protein Isolate by Alcalase and Trypsin. Biosci Biotech Res Asia 2017;14(1). Available from: https://www.biotech-asia.org/?p=21634 |
Introduction
Soy is considered a staple food in Asian countries, for its nutritional quality, good functional properties, low cost and high production (Friedman and Brandon, 2001). Studies show that the consumption of soy protein has many positive effects on health such as antihypertensive, cholesterol-lowering and body-fat reducing, and prevention of osteoporosis, anticancer (De Leo et al, 2009; Aoyama et al, 2000; Pipe et al, 2009).Among the cereals and other species of legumes, soy is the one that contains the highest protein content (about 40%).
Todays, population growth and demand for soy protein has increased, although the foods of animal origin are still the main source of dietary protein. This demand has stimulated the food industry to use herbal protein in their products (Kempka et al, 2014) for its functional properties beside nutritional effects. The functional properties of soy protein are solubility, water holding capacity, viscosity, foaming, emulsifying properties (Garcia et al, 1997). These properties is related to physicochemical parameters such as amino acids composition, molecular size, intra molecular and extra molecular bonds, pH, temperature and ionic strength (Lampart-Szczapa, 2001).Soybean Protein Isolate use in formulation of various food produces for its functional properties, good aroma, high protein content (>90%) (Mateos-Aparicioet al, 2008).
Hydrolysis methods of soybean protein can be divided into three methods including alkaline, acid, and enzymatic hydrolysis. Enzymatic hydrolysis has characteristics that reaction conditions are mild, easy to control and damage to nutrients in the reaction process was less (Feng and Xiong, 2003).Trypsin, pepsin, alcalase, papain, bromoline, neutral protease, papain, complex protease and other microbial protease were the common enzyme used in soybean protein hydrolysis. Many parameters including pH, substrate of hydrolysis, temperature, enzyme concentration, time, and ratio of enzyme to substrate influence on the quality and quantity properties of soy protein hydrolysate (Yongsheng et al, 2015). Action sites of different enzymes on the protein were different. Different enzymes may also bring a different functional properties, therefore controlling the condition of hydrolyses is important. Response surface methodology (RSM) was considered to be effective in optimizing and monitoring food processes (Wangtueai and Noomhorm 2009).
In this study, effect of pH, temperature and ratio of enzyme to substrate was evaluate on the hydrolysis condition of soy protein isolate and then was used RSM for optimization of condition for enzymatic hydrolysis by alcalase and trypsin.
Material and Method
Soybean protein isolate powder was provided by Benampowder, Iran. Alcalase (enzyme activity = 2.4 AU/g) and trypsin (enzyme activity = 2.4 USP/mg) was purchased from Novozymes, Denmark and stored at 4 ˚C until use. Other chemical reagents used for experiments were of analytical grade.
Chemical composition
Moisture content was determined by placing approximately 2 g of sample into a pre-weighted aluminum dish. Samples were then dried in an oven at 105 ˚C until a constant weight (AOAC, 2005). The total crude protein (N × 6.25) in raw materials was determined using the Kjeldahl method (AOAC, 2005). Total lipid in sample was measured by Soxhlet extraction (AOAC, 2005). Ash content was estimated by charring in a predried sample in a crucible at 600 ˚C until a white ash was formed (AOAC, 2005).
Degree of hydrolysis
Degree of hydrolysis was estimated according to the method of Hoyle and Merritt (1994). To the supernatant, one volume of 20% trichloroacetic acid (TCA) was added, followed by centrifugation at 6700×g at 10 ˚C for 20 min to collect the 10% TCA-soluble materials. The degree of hydrolysis (DH) was computed as:
%DH= (10%TCA – soluble N2 in the sample / total N2 in the sample)*100
Experimental Design for optimization
Response Surface Methodology (RSM) based on Box-Behnken Design was applied to optimization the condition of enzymatic hydrolysis of soy protein isolate by alcalase and trypsin. According to this design 15 experimental points recommended by Design-Expert, Version 8.0.11 software (Statease Inc., Minneapolis, Minn., U.S.A.). The effects of three controlled independent variables, E/S[1] (X1), temperature (X2) and pH (X3) at tree levels in actual and coded values (-1, 0, +1) was evaluated to determine the best complex of variables. The DH can be considered as response to variables. The coded levels of the independent variables used in the RSM design are listed in Table 1.
Table 1: coded levels of the independent variables used in the RSM design
| Levels | |||||||
| +1 | 0 | -1 | Coded variable | Factors | |||
| alcalase | trypsin | alcalase | trypsin | alcalase | trypsin | ||
| 4.5 | 4.5 | 3 | 3 | 1.5 | 1.5 | X1 | E/S (%) |
| 65 | 42 | 55 | 37 | 45 | 32 | X2 | Temperature(◦C) |
| 8 | 8 | 7 | 7 | 6 | 6 | X3 | pH |
2ratio of enzyme to substrate concentration
Statistical analysis
The second-order polynomial model proposed for the response surface analysis of the designed experiment was explained by equation:
Where, Y is the DH (response); K is number of independent variables, ϵ is random error, β0, βi, βii and βij are the coefficients of intercept, linear, quadratic and interactive terms respectively; while Xi and Xj are the coded values of the three independent variables.
The relationship between variables and results of this study was shown as a linear approximation polynomial model, Double cross and second grade to modeling and optimization of variables in enzymatic hydrolysis of soy protein isolate by alcalase and trypsin by Box-Behnken. Model coefficients done by P test. The suitability of the model and the adequacy model checked by analysis of variance analysis fit and regressionindex (R2), respectively.
Results and Discussion
Chemical composition
Chemical composition of raw soy protein and hydrolyzed soy protein powder by alcalase and trypsin shown in table 2. Protein content of raw soy protein was 75.21% and after hydrolysis it increase to 87.35 % and 80.25% for hydrolyzed soy protein isolate by alcalase and trypsin, respectively.
Table 2: Chemical composition of raw soy protein and hydrolyzed soy protein powder by enzymes
| moisture | Ash | Fat | Protein | Materials (%) | ||||||||
| alcalase | trypsin | alcalase | trypsin | alcalase | trypsin | alcalase | trypsin | |||||
| 10.45 | 10.45 | 10.24 | 10.24 | 4.32 | 4.32 | 75.21 | 75.21 | raw soy protein | ||||
| 8.35 | 9.41 | 2.21 | 8.36 | 1.09 | 1.46 | 87.35 | 80.25 | Hydrolyzed soy protein isolate | ||||
Influences of independent variables on hydrolysis of soy protein isolate
Degree of hydrolysis
The results of degree of hydrolysis (DH) of soy protein isolate by trypsin and alcalase was shown in Table 2 as dependent variables. The highest DH (15.93%) was achieved at pH=8, temperature 55◦c and E/S 4.5 and the condition of the least DH (13.46%) have been at pH=6, temperature 55◦c and E/S 1.5 for alcalase. In hydrolysis by trypsin, Maximum (20.37%) and minimum (18.15%) DH were at pH=7, temperature 42◦c and E/S 4.5 and the condition of the least DH have been at pH=8, temperature 32◦c and E/S 3, respectively. Therefore, little difference between actual and predicted amount of DH shown the high accuracy of model to estimated responsible variable. Maximum and minimum amount of DH in trypsin were more than hydrolysis by alcalase.
The results of analysis of variance (Anova) are presented the effects of various factors (pH, temperature, E/S) in Table 3.
Table 3: Actual and predicted levels of degree of hydrolysis (DH) in optimizing the hydrolysis condition by trypsin and alcalase
| Run | (%) DH | X1 | X2 | X3 | |||||||
| Actual | Predicted | (%) 1.5-4.5 | c) ◦) 32-42 | 06-Aug | |||||||
| Alcalase | trypsin | Alcalase | trypsin | Alcalase | trypsin | Alcalase | trypsin | Alcalase | trypsin | ||
| 1 | 13.64 | 20.37 | 13.8 | 20.51 | 0 | 1 | -1 | 1 | -1 | 0 | |
| 2 | 15.87 | 18.73 | 15.95 | 18.93 | 0 | -1 | -1 | 0 | 1 | -1 | |
| 3 | 15.56 | 19.72 | 15.36 | 19.34 | -1 | 1 | 0 | 0 | 1 | 1 | |
| 4 | 13.46 | 19.79 | 13.47 | 19.6 | -1 | 0 | 0 | 1 | -1 | -1 | |
| 5 | 14.18 | 18.15 | 14.1 | 18.51 | 1 | 0 | 0 | -1 | -1 | 1 | |
| 6 | 14.21 | 18.98 | 13.76 | 18.99 | 0 | -1 | 1 | 1 | -1 | 0 | |
| 7 | 14.85 | 19.17 | 14.37 | 19.33 | 0 | 0 | 0 | 0 | 0 | 0 | |
| 8 | 14.97 | 19.37 | 15.06 | 19.33 | 1 | 0 | -1 | 0 | 0 | 0 | |
| 9 | 13.98 | 19.91 | 14.39 | 19.98 | -1 | 1 | 1 | 0 | 0 | -1 | |
| 10 | 15.69 | 19.31 | 15.65 | 19.06 | 0 | -1 | 1 | 0 | 1 | 1 | |
| 11 | 14.74 | 19.55 | 15.03 | 19.33 | 1 | 0 | 1 | 0 | 0 | 0 | |
| 12 | 15.93 | 19.63 | 15.99 | 19.9 | 1 | 0 | 0 | 1 | 1 | 1 | |
| 13 | 14.45 | 19.41 | 14.73 | 19.31 | 0 | 0 | 0 | -1 | 0 | -1 | |
| 14 | 14.29 | 19.08 | 14.43 | 19 | -1 | -1 | -1 | -1 | 0 | 0 | |
| 15 | 15..10 | 18.77 | 14.73 | 18.82 | 0 | 1 | 0 | -1 | 0 | 0 | |
Table 4: Analysis of variance for the second order response surface model for degree of hydrolysis by trypsin and alcalase
| Sum of square | Degree of freedom | Mean square | F value | P value
(Prob>F) |
source | |||||||
| alcalase | trypsin | alcalase | trypsin | alcalase | trypsin | alcalase | Trypsin | alcalase | trypsin | |||
| 7.95 | 3.61 | 3 | 6 | 2.65 | 0.60 | 35.52 | 8.06 | 0.0001> | 0.0048 | model | ||
| 0.8 | 0.89 | 1 | 1 | 0.8 | 0.89 | 10.73 | 11.94 | 0.0074 | 0.0086 | E/S-A | ||
| 2.813E-003 | 1.41 | 1 | 1 | 2.813E-003 | 1.41 | 0.038 | 18.91 | 0.8496 | 0.0024 | Temp-B | ||
| 7.14 | 0.13 | 1 | 1 | 7.14 | 0.13 | 95.80 | 1.78 | 0.0001> | 0.2192 | pH-C | ||
| 4.21 | 0.72 | 1 | 1 | 3.45 | 0.72 | 8.21 | 9.86 | 0.711 | 0.0144 | AB | ||
| 2.45 | 0.15 | 1 | 1 | 2.17 | 0.15 | 35.21 | 1.99 | 0.0021 | 0.1964 | AC | ||
| 2.17 | 0.30 | 1 | 1 | 4.56 | 0.30 | 41.17 | 4.05 | 0.652 | 0.789 | BC | ||
| 0.82 | 0.6 | 11 | 8 | 0.075 | 0.075 | residual | ||||||
| 0.61 | 0.52 | 9 | 6 | 0.067 | 0.087 | 0.63 | 2.42 | 0.7453 | 0.3210 | Lack of fit | ||
| 0.22 | 0.072 | 2 | 2 | 0.11 | 0.036 | Pure error | ||||||
| 8.77 | 4.21 | 14 | 14 | total | ||||||||
F value of the model was more than F value of the table for alcalase and trypsin, also p value of the model was lower than 0.05, that shows a significant (p<0.01) value. As the results show,multiple regression coefficients was derived to fore casting a second order polynomial model for response variable. RSM generates the response surface regression equation for trypsin and alcalasethat can be expressed as follows:
YDH = 34.3– 0.98(X1) – 0.47(X2) + 0.06(X1X2) + 0.06(X2X3) (1) for trypsin
YDH = 7.58+ 0.21(X1) + 0.95(X3) (2) for alcalase
The ANOVA results demonstrate that second order polynomial model of independent variable is enough express the response (Table 4). Regression coefficients (R2=0.9064) show that the selected regression model express the reaction very well and just 9.36% of total variance cannot showed the DH of hydrolysis soy protein by alcalase. The Adjusted correlation coefficient for this DH was 0.8809 that was matched with correlation coefficient of test,reasonably. The Changes in new and forecasted data examined and its accuracy forecasted correlation coefficient were determined (0.8258).
Table 5: Summary statistical model for efficiency DH by alcalase and trypsin
| Sources Change of Model | Standard deviation | Actual R2 | Adjusted
R2 |
forecasted R2 | Accuracy | Coefficient of variation | PRESS | ||||||||
| alcalase | trypsin | alcalase | trypsin | alcalase | trypsin | alcalase | trypsin | alcalase | trypsin | alcalase | trypsin | alcalase | trypsin | ||
| linear | 0.27 | 0.4 | 0.9064 | 0.579 | 0.8809 | 0.4642 | 0.8258 | 0.1164 | 17.89 | – | 1.85 | – | 1.53 | 3.72 | recommended |
| Interaction | 0.28 | 0.27 | 0.9262 | 0.8580 | 0.8708 | 0.7516 | 0.7166 | 0.3193 | – | 10.73 | – | 1.41 | 2.48 | 2.86 | |
| second order | 0.26 | 0.33 | 0.9611 | 0.8738 | 0.8911 | 0.6468 | 0.7151 | 0.7822 | – | – | – | – | 2.5 | 7.49 | |
| Cubic | 0.33 | 0.19 | 0.9755 | 0.9828 | 0.8283 | 0.8797 | – | – | – | – | – | + | + | Aliased | |
Accuracy for this test was 10.43 and 17.89 for trypsin and alcalase, respectively. The Accuracy more than 4 is desirable and show the Accuracy in forecasting. (Aghamohammadi et al., 2007). Low values of the coefficient of variation and standard deviation demonstrate high accuracy and validity of recommended model. In this study, coefficient of variation and standard deviation were 1.85 and 0.27, respectively, that show low error in test.Predicted Residual Error Sum of Squares (PRESS) determined the accuracy of point in predicted model (Jabasingh and Pavithra., 2010). PRESS was 3.72 and 1.53 for trypsin and alcalase. Whatever PRESS was lower, the model was better to predict the efficiency of the response variable.Two-Factor independently and linearly (enzyme to substrate, pH) have significant effect on DH (p<0.01) while this effect not seen in temperature (p>0.05). Also,there isn’t aninteractions and power(duplex) between variables (p>0.05).The effect of the independent variable on the degree of hydrolysis by alcalase and trypsin can be visualized through a three-dimensional response surface which is based on the second order polynomial model(Figure1a-c and Figure 2a-c).Figure 1a shows the effects of temperature and E/S on DH during hydrolysis. The result showed that DH increased with the increase in ratio of the enzyme to the substrateby alcalase. DH was found increased rapidly at the beginning of the reaction and then a decrease in the DH value was observed at high temperature. A high temperature level will lead to a complete inactivation of alcalase enzyme due to the thermal denaturation. The linear effect of A in polynomial model was significant (p<0.01) on increasing efficiency of DH while B was omitted from regression response system (p>0.05).
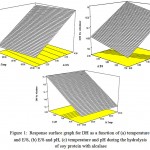 |
Figure 1: Response surface graph for DH as a function of (a) temperature and E/S, (b) E/S and pH, (c) temperature and pH during the hydrolysis of soy protein with alcalase
|
Figure 1b shows the effects of enzyme to substrate concentration and temperature on the hydrolysis of soy protein by alcalase. Based on the results, decrease of E/S made decreasing efficiency of DH. In high concentration of E/S will cause a positive and increasing effect on DH. Figure 1b demonstrate that the effect pH on DH increase in different concentration of enzyme and substrate. Either, linear effects of two parameter was significant (p<0.01).
Figure 1c shows the effects of temperature and pH on DH by alcalase. Based on the results, increasing the temperature would decrease the DH value with a mild slope than figure 1a. However, decreasing pH lead to decreasing efficiency of DH. Increasing pH lead to increasing DH but this increasing is similar in different temperature and linear effect of pH was significant (p<0.01).
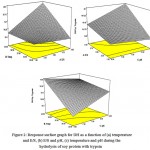 |
Figure 2: Response surface graph for DH as a function of (a) temperature and E/S, (b) E/S and pH, (c) temperature and pH during the hydrolysis of soy protein with trypsin
|
Figure 2a shows the effects of enzyme and substrate concentration and temperature by trypsin. Based on the results, increasing the temperature would increase the DH value in fixed E/S. according to figure 2a, further increases of E/S would cause increase in the DH value in fixed temperature. Effect of Temperature and E/S were significant (p<0.05) on DH. Figure 2b shows the relationship of pH and E/S on DH. The decreasing of pH had most effect on increasing DH and the increase E/S due to the increasing DH. Interactions both items were not significant (p>0.05) and it deleted from regression response system. The effect of temperature and pH on DH by trypsin was shown in Figure 2c. Increasing temperature would increase DH with mild slope. Interactions pH and temperature were significant (p<0.1).
Optimization of hydrolysis
In order to verify the model, RSM suggested the optimum levels of different independent variables based on the desirability profile. If the desirability value is close to 1.0, it means the suggested conditions are suitable to achieve the highest DH. From Table5, the optimum enzymatic hydrolysis conditions by alcalase and trypsin obtained were at pH 8 and 7.11, temperature of 46.21oC and 41.85 oC, concentration of enzyme to substrate 4.38 and 4.49 with the DH value at 15.9782% and 20.471%, respectively.
Table 6: Optimum enzymatic hydrolysis conditions
| E/S | temperature | pH | DH | desirability value | number | ||||
| alcalase | trypsin | alcalase | trypsin | alcalase | trypsin | alcalase | trypsin | ||
| 4.49 | 4.43 | 64.79 | 41.94 | 7.98 | 7.58 | 15.9492 | 20.4393 | 1.000 | 1 |
| 4.42 | 4.49 | 51.01 | 41.98 | 7.98 | 7.82 | 15.9562 | 20.4646 | 1.000 | 2 |
| 4.38 | 4.49 | 47.88 | 41.50 | 7.99 | 6.44 | 15.9696 | 20.4593 | 1.000 | 3 |
| 4.24 | 4.42 | 45.14 | 41.90 | 7.98 | 6.99 | 15.9347 | 20.4498 | 1.000 | 4 |
| 4.38 | 4.49 | 46.21 | 41.85 | 8 | 7.11 | 15.9782 | 20.471 | 1.000 | 5 |
Conclusion
The second order polynomial has been shown to adequately describe and predict the DH value of soy protein. The hydrolysis of soy protein using alcalase and trypsin enzyme is greatly influenced by different operating conditions such as pH, temperature, substrate concentration and enzyme concentration for the production high yield of soy protein hydrolysate. The optimum enzymatic hydrolysis conditions by alcalase and trypsin obtained were at pH 8 and 7.11, temperature of 46.21oC and 41.85 oC, concentration of enzyme to substrate 4.38 and 4.49 with the DH value at 15.9782% and 20.471%, respectively after hydrolyzing for 45 and 60 min. Soy protein hydrolysate produced has potential for applications in food and pharmaceutical products.
Reference
- Aghamohammadi N., Aziz H. B. A., Isa M. H.,Andzinatizadeh A. A. Powdered Activated Carbon Augmented Activated Sludge Process For Treatment Of Semi-Aerobic Landfill Leachate Using Response Surface Methodology. Bioresour. Technol. 2007;98:3570-3578.
CrossRef - Aoyama T., Fukui K., Takamatsu K., Hashimoto Y., And Yamamoto T. Soy Protein Isolate And Its Hydrolysate Reduce Body Fat Of Dietary Obese Rats And Genetically Obese Mice (Yellow Kk). Nutrition. 2000;16(5):349-354.
CrossRef - Association Of Official Analytical Chemists. Official Method Of Analysis. 17th Ed., Association Of Official Analytical Chemists. Washington. 2005.
- Leo D. F., Panarese S., Gallerani R.,Andceci L. R. Angiotensin Converting Enzyme (Ace) Inhibitory Peptides: Production And Implementation Of Functional Food. Curr Pharm Des. 2009;15(31):3622-3643.
CrossRef - Feng J And Xiong Y. L. Interaction And Functionality Of Mixed Myofibrillar And Enzymehydrolyzed Soy. J. Food Sci. 2003;68(3):803-809.
CrossRef - Friedman M And Brandon D. L. Nutritional And Health Benefits Of Soy Proteins. J Agric Food Chem. 2001;49(3):1069-1086.
CrossRef - Garcia M. C., Torre M., Marina M. L., Andlaborda F. Composition And Characterization Of Soyabean And Related Products. Crit Rev Food Scinutr. 1997;37(4):361-391.
CrossRef - Guo X. F. Determination Of Hydrolysis Degree Of Proteins. China Oil. Fat. 25(6):176-177.
- Hoyle N. T And Merritt J. H. Quality Of Fish Protein Hydrolysate From Herring (Clupeaharengus). Journal Of Food Science. 2000;59:76–79.
CrossRef - Jabasingh S. A And Pavithra G. Response Surface Approach For The Biosorption Of Cr Ions By Mucorracemosus. Clean. 2010;38:472–477.
- Kempka A. P., Honaiser T. C., Fagundes E And Prestes R. C. Functional Properties Of Soy Protein Isolate Of Crude And Enzymatically Hydrolysed At Different Times. International Food Research Journal. 2014;21(6):2229-2236.
- Lampart-Szczapa E. Legume And Oilseed Proteins: Technomic Publishing Co. Inc. 2001.
- Mateos-Aparicio I.,Cuenca A. R., Villanueva-Suarez M. J And Zapata-Revilla M. A. Soybean A Promising Health Source. Nutrhosp. 2008;23(4):305-312.
- Pipe E. A., Gobert C. P., Capes S. E., Darlington G. A., Lampe J. W And Duncan A. M. Soy Protein Reduces Serum Ldl Cholesterol And The Ldl Cholesterol:Hdl Cholesterol And Apolipoprotein B: Apolipoprotein A-I Ratios In Adults With Type 2 Diabetes. J Nutr. 2009;139(9):1700-1706.
CrossRef - Wangtueai S And Noomhorm A. Processing Optimization And Characterization Of Gelatin From Lizardfish (Saurida Spp.) Scales. Lwt – Food Science And Technology. 2009;42:825-834.
CrossRef - Yongsheng M., Xianhui S And Lintong W. Study On Optimal Conditions Of Alcalase Enzymatic Hydrolysis Of Soybean Protein Isolate. Advance Journal Of Food Science And Technology. 2015;9(2):154-158.
CrossRef

This work is licensed under a Creative Commons Attribution 4.0 International License.


