

Manuscript accepted on : 02 March 2017
Published online on: --
Plagiarism Check: Yes
J. Ling, D. L. Oh and A. Y. Y. Chia
School of Biosciences, Taylor’s University, Lakeside Campus, Jalan Taylor’s, 47500 Subang Jaya, Selangor Darul Ehsan, Malaysia.
Corresponding Author E-mail: sukdv84@gmail.com
DOI : http://dx.doi.org/10.13005/bbra/2411

ABSTRACT: Treating post-menopausal symptoms with hormone replacement therapy is associated with various health risks. Alternatively, licorice root is often used to relief post-menopausal symptoms in traditional medicine. The bioactive components of licorice root, such as GA, GE and GLA, have been previously studied in vitro for their estrogenic effects. In this study, they were subjected to molecular docking study to further acknowledge their estrogenicity. GA and GE showed positive binding energy in the molecular docking study, suggesting that they could not bind nor activate ERs. Intermolecular interaction analysis identified multiple sites of unfavorable steric bumps, indicating pentacyclic structure and methyl side groups of GA and GE were detrimental to formation of energy favorable positions in ligand binding cavity of ERs. On the other hand, GLA could be docked into the ligand binding cavity of ERs, though with comparatively higher binding energy to that of 17β-estradiol (E2). It was observed that the rotatable 1,3-benzenediol of GLA is essential for GLA-ERs binding. Furthermore, oxidation of the methyl side groups of GLA might improve the binding affinity. In conclusion, GLA, not GA and GE, is a partial ERs agonist and could be further modified to design novel semi-synthetic post-menopausal drugs.
KEYWORDS: Estrogen receptor (ER); GLA, Glabridin acid (GLA); Glabridin acid (GLA)Molecular docking;
Download this article as:| Copy the following to cite this article: Ling J, Oh D. L, Chia A. Y. Y. Molecular Docking Studies of Glycyrrhizic acid (GA), Glycyrrhetic acid (GE) and Glabridin (GLA) With Estrogen Receptors (Ers). Biosci Biotech Res Asia 2017;14(1). |
| Copy the following to cite this URL: Ling J, Oh D. L, Chia A. Y. Y. Molecular Docking Studies of Glycyrrhizic acid (GA), Glycyrrhetic acid (GE) and Glabridin (GLA) With Estrogen Receptors (Ers). Biosci Biotech Res Asia 2017;14(1). Available from: https://www.biotech-asia.org/?p=22550 |
Introduction
Estrogen is important for developing and maintaining the normal female reproductive and sexual functions in women. These endocrinal effects are modulated via activation of estrogen receptors (ERs) and successive signaling pathways or gene transcriptional activities.1 Post-menopausal women have reduced female sex hormones and thus often suffer from symptoms such as hot flashes, night sweats, osteoporosis, and so on. Hormone replacement therapy (HRT) is the standard treatment to control these post-menopausal symptoms and diseases for women.2 Despite the beneficial effects, the use of endogenous estrogen and progesterone in HRT was associated with the increased risks of stroke, venous thrombosis, and ovarian cancer.3 Hence, it is significant to continuously seek for alternative therapies for menopause symptoms and post-menopause conditions.
Glycyrrhiza glabra, commonly known as licorice, is a traditional herb found in subtropical regions and custom to treat several kinds of diseases, including menopausal symptoms4-5 The extracts from its root contain various types of active compounds that exert many medicinal benefits.6-8 Among the active compounds found in licorice root extracts are GA, GE and GLA (Figure 1).
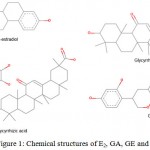 |
Figure 1: Chemical structures of E2, GA, GE and GLA. |
GA and GE had been reported to possess a wide range of biological effects, such as antioxidant, anti-inflammatory, anti-viral, anti-allergic, anti-hepatotoxic and anti-ulcer.9-11 Literature review shows that GA and GE might not be estrogenic. For example, Hillerns et al. (2005) reported that GA and GE were unable to displace E2 even at high concentrations (500 µM).12 In another previous study however, GA was reported to bind to estrogen receptors but at minimal level.13 GLA is a phytoestrogen, and it shares several structural features with E2. To be specific, both possess 3 phenanthrene shape fused rings and contain an aromatic ring substituted with hydroxyl group.14 GLA was reported to exert estrogenic effects yet at a relatively lower level compared to that of E2.15
To date, there are no studies that reason how GLA showed lower estrogenic effects to ERs compared to E2 even though they share several common features. There are also very little insights on GA and GE binding to ERs. Therefore, in this study, molecular docking studies were conducted to acknowledge the binding mode and intermolecular interactions of GLA, GA and GE with ERs as well as to compare with that of E2 and subsequently associating the findings with ERs agonistic binding.
Methodology
Molecular docking and intermolecular analysis were driven by Dell Inspiron 3443 laptop computer with the following specifications: Windows 10 Pro, Intel ® Core ™ i7-5500U CPU at 2.40 GHz, 8 GB RAM, NVIDIA GeForce 840M graphics card.
Preparation of Macromolecules and Ligands
The crystallographic structure of ER-α and -β (PDB ID: 1ERE and 3OLS) were downloaded from RCSB Protein Data Bank (www.rcsb.org). Both PDB structures were bound with E2 at respective ligand binding domain. The 2D structures of GA, GE and GLA (PubChem CID: 14982, 10114 and 124052 respectively) were downloaded from the PubChem Compound Database.
Using AutoDockTools (ADT) 1.5.6, the water molecules and E2 were removed and the macromolecules (ERs) were converted to Autodock PDQBT format where Gasteiger charges were added to each atom, non-polar hydrogens merged followed by re-distribution of atomic partial charges and determination of atom types.
The ligands (E2, GA, GE and GLA) were loaded to ADT 1.5.6 viewer, which then automatically computed Gasteiger charges and mapped the atom types. The root and torsion number were determined and subsequently the ligands were converted to Autodock PDBQT format.
Setting up Grid Parameter File and Docking Parameter File
Using ADT 1.5.6, the map types were set by selecting the respective E2 from ER-α and -β as chosen ligand. The grid boxes were centered on E2 and the grid box size was set to 40 points at x, y, and z dimensions. The respective coordinates of E2 from ER-α and -β were noted and were used to setup the grid box location for subsequent molecular docking of GA, GE and GLA with ERs. The grid box sizes for GE and GLA were set identically to that of E2 whereas the grid box for GA were set to 56 points at x, y, and z dimensions to accommodate the bigger ligand. The grid parameter files for respective ligands were generated and saved.
Next, ER-α and -β were set as rigid macromolecule while E2, GLA, GA, and GE were set as ligands respectively. The docking search parameters were set to genetic algorithm with 100 number of runs and the rest left with default settings. The respective Lamarckian Genetic Algorithm docking parameter files for each ligands were generated.
Molecular Docking
Prior to molecular docking, AutoGrid 4 was run to calculate the interaction energies grid maps for respective ligand atom types. Autodock 4 was executed and molecular docking simulations were performed thrice for the respective ligands with ERs. The lowest binding energy complexes of the respective ligands with ERs were viewed and extracted using ADT 1.5.6. The binding mode and intermolecular interactions of GLA, GA and GE were then determined and compared to that of E2 using Discovery Studio 4.1 Client and PoseView (Protein Plus Server, Center for Bioinformatics, University of Hamburg).
Results and Discussion
Molecular Docking
The outcome of molecular docking was analyzed and summarized in Table 1 and Figure 2-3. It was observed that E2 could be docked into the ligand binding cavity of ERs. The triplicates of 100 run molecular docking of E2 with ERs yielded identical conformations throughout (as shown in the histogram summary of Figure 2 and Table 1). The mean lowest binding energy of E2 docked with ER-α and -β were -10.47 ± 0.00 kcal/mol and -10.920 ± 0.000 kcal/mol respectively. It was also determined that the root mean square deviation (RMSD; average distance between the atoms) of lowest binding energy conformations of molecular docked E2 with ERs and the original crystallographic data were 0.6297 Å and 0.3432 Å respectively. As the RMSD values were less than 2 Å, therefore the molecular dockings in this study were generally accepted as repeatable and reliable.
Table 1: Molecular docking summary of E2, GA, GE and GLA with ERs.
| Protein | Ligand | Mean Lowest Binding Energy (kcal/mol) | Mean RMSD (Å) | Mean Number in Cluster |
| between lowest binding conformations (triplicates) | ||||
| ER-α | E2 | -10.470 ± 0.000 | 0.000 ± 0.000 | 100.000 ± 0.000 |
| GA | 332.300 ± 1.235 | 0.473 ± 0.081 | 37.667 ± 12.662 | |
| GE | 14.570 ± 0.008 | 0.066 ± 0.031 | 93.333 ± 4.509 | |
| GLA | -3.210 ± 0.016 | 0.202 ± 0.152 | 75.333 ± 1.528 | |
| ER-β | E2 | -10.920 ± 0.000 | 0.000 ± 0.000 | 100.000 ± 0.000 |
| GA | 330.550 ± 6.765 | 0.474 ± 0.156 | 46.333 ± 3.786 | |
| GE | 24.147 ± 0.015 | 0.048 ± 0.029 | 73.667 ± 4.041 | |
| GLA | -3.083 ± 0.006 | 0.022 ± 0.008 | 96.333 ± 3.055 | |
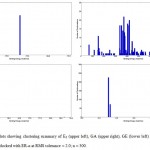 |
Figure 2: Histogram plots showing clustering summary of E2 (upper left), GA (upper right), GE (lower left) and GLA (lower right) molecular docked with ER-α at RMS tolerance = 2.0; n = 300. |
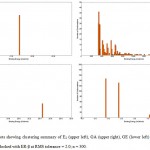 |
Figure 3: Histogram plots showing clustering summary of E2 (upper left), GA (upper right), GE (lower left) and GLA (lower right) molecular docked with ER-β at RMS tolerance = 2.0; n = 300. |
In this study, GA and GE were calculated to have mean lowest binding energy of 332.30 ± 1.2349 kcal/mol and 14.57 ± 0.008165 kcal/mol respectively in the molecular docking to ER-α. Similar trend was observed for that of ER-β, which the mean lowest binding energy were 330.550 ± 6.765 kcal/mol and 24.147 ± 0.015 kcal/mol respectively. These observations suggested that GA and GE could not bind to nor activate ERs, which corresponded to the findings by Nishihara et al. (2000) and Hillerns et al. (2005), and opposed to the results reported by Fujisawa et al. (2000).12-13,16
On the other hand, GLA was able to be docked into the ligand binding cavity of ERs, but with relatively higher mean lowest binding energy (-3.21 ± 0.01633 kcal/mol and -3.083 ± 0.006 kcal/mol respectively). Simons et al. (2011) reported that GLA displayed ER α-selective antagonism,17 which contrasted with the findings in this study. Nevertheless, Powers and Setzer (2015) reported that GLA could docked with ERs, with higher selectivity to ER-β.18 Poh et al. (2015) also reported that GLA exert relatively lower estrogenic effects compared to E2 in ligand binding assay.15 These findings corresponded with the molecular docking results in this study, though it is to note that GLA did not portray selectivity to any ER subtypes significantly as reported by Powers and Setzer (2015).18 The molecular docking results suggested that GLA could be a partial agonist instead of a full agonist to ERs as partial agonists tend to divert less binding energy than full agonists into effective conformational changes.19-20
Intermolecular Interaction Analysis
Table 2-5 shows the intermolecular interaction analysis summary of E2, GA, GE and GLA with ERs. Previous study had demonstrated that GLU353, ARG394 and HIS524 of ER-α or GLU305, ARG346 and HIS475 of ER-β are the 3 important residues that form hydrogen bonds with E2.21 In this study, hydrogen bonding between E2 and these residues were also observed (Figure 4-5). However, an additional hydrogen bond between LEU387 of ER-α and LEU339 of ER-β with E2 was also observed in this study. This is most likely due to the fact that the molecular docking was run without water molecules. When water molecules were incorporated in the intermolecular interaction analysis using the original PDB information, a water molecule were found between LEU387 of ER-α and LEU339 of ER-β, and that water molecule formed hydrogen bond with E2 instead. It is also worth to note that the amino acid residues that contributed to hydrophobic interactions in this study such as ALA350, LEU384, LEU391, PHE404, ILE424 and LEU525, were also reported by Wang et al. (2013) in their studies21. This further supported that our molecular docking study is reliable accurate.
Table 2: Intermolecular interaction analysis of E2 molecular docked ERs.
| ER-α | ER-β | ||||||||
| Interaction Residues/Atoms | Type | Triplicates | Interaction Residues/Atoms | Type | Triplicates | ||||
| 1 | 2 | 3 | 1 | 2 | 3 | ||||
| GLU353:OE2 – E2:O3 | HBond | R | R | R | GLU305:OE2 – E2:O3 | HBond | R | R | R |
| LEU387:O – E2:O3 | HBond | R | R | R | LEU339:O – E2:O3 | HBond | R | R | R |
| ARG394:NH2 – E2:O3 | HBond | R | R | R | ARG346:NH2 – E2:O3 | HBond | R | R | R |
| HIS524:ND1 – E2:O17 | HBond | R | R | R | HIS475:ND1 – E2:O17 | HBond | R | R | R |
| ALA350 – E2 | HY | R | R | R | LEU298 – E2 | HY | R | R | R |
| LEU384 – E2 | HY | R | R | R | ALA302 – E2 | HY | R | R | R |
| LEU387 – E2 | HY | R | R | R | MET336 – E2 | HY | R | R | R |
| MET388 – E2 | HY | R | R | R | LEU339 – E2 | HY | R | R | R |
| LEU391- E2 | HY | R | R | R | MET340 – E2 | HY | R | £ | £ |
| PHE404 – E2 | HY | R | R | R | LEU343 – E2 | HY | R | R | R |
| ILE424 – E2 | HY | R | R | R | PHE356 – E2 | HY | R | R | R |
| LEU525 – E2 | HY | R | R | R | ILE373 – E2 | HY | R | R | R |
| ILE376 – E2 | HY | R | R | R | |||||
| LEU476 – E2 | HY | R | R | R | |||||
Table 3a: Intermolecular interaction analysis of GA molecular docked with ERs.
| ER-α | ER-β | ||||||||
| Interaction Residues/Atoms | Type | Triplicates | Interaction Residues/Atoms | Type | Triplicates | ||||
| 1 | 2 | 3 | 1 | 2 | 3 | ||||
| PRO325:O – GA:O59 | HBond | R | £ | R | MET295:CA – GA:O61 | HBond | £ | £ | R |
| ILE326:CA – GA:O45 | HBond | R | R | R | PHE356:O – GA:O35 | HBond | R | R | R |
| LEU327:O – GA:O46 | HBond | £ | R | R | PRO358:CD – GA:O35 | HBond | R | R | R |
| MET357:N – GA:O61 | HBond | £ | R | £ | PHE377:N – GA:O48 | HBond | R | R | R |
| LEU387:O – GA:O55 | HBond | R | R | R | GLY472:O – GA:O45 | HBond | R | R | R |
| GLY390:CA – GA:O55 | HBond | R | R | R | HIS475 – GA:O46 | HBond | R | R | R |
| ARG394:NH1 – GA:O55 | HBond | R | R | £ | LEU476:N – GA:O45 | HBond | R | R | R |
| PRO406:CD – GA:O60 | HBond | £ | R | R | MET295:SD – GA:O59 | S-Bond | R | £ | £ |
| HIS524:CE1 – GA:O34 | HBond | £ | £ | R | MET336:SD – GA:O55 | S-Bond | £ | £ | R |
| MET343 – GA | HY | R | R | R | VAL280 – GA | HY | R | R | R |
| LEU346 – GA | HY | R | £ | R | LEU301 – GA | HY | R | R | R |
| LEU349 – GA | HY | R | R | R | MET336 – GA | HY | R | R | R |
| ALA350 – GA | HY | R | R | £ | LEU339 – GA | HY | R | R | R |
| LEU384 – GA | HY | R | R | R | MET340 – GA | HY | R | R | R |
| LEU387 – GA | HY | R | R | R | LEU343 – GA | HY | R | R | R |
| MET388 – GA | HY | R | R | R | ARG346 – GA | HY | R | R | R |
| LEU391 – GA | HY | R | R | R | LEU380 – GA | HY | R | R | R |
| PHE404 – GA | HY | R | R | R | HIS279 – GA | StericB | £ | R | R |
| MET421 – GA | HY | R | R | R | VAL280 – GA | StericB | R | R | R |
| ILE424 – GA | HY | R | R | R | LEU298 – GA | StericB | £ | R | £ |
| LEU428 – GA | HY | R | £ | R | THR299 – GA | StericB | £ | £ | R |
| HIS524 – GA | HY | R | R | R | LEU301 – GA | StericB | R | R | R |
Table 3b: Intermolecular interaction analysis of GA molecular docked with ERs (continue).
| LEU525 – GA | HY | R | R | R | GLU305 – GA | StericB | R | R | R |
| LEU327 – GA | StericB | R | £ | £ | LEU339 – GA | StericB | R | R | R |
| LEU349 – GA | StericB | £ | R | £ | ARG346 – GA | StericB | R | R | R |
| GLU353 – GA | StericB | R | R | R | PHE356 – GA | StericB | R | R | R |
| ARG394 – GA | StericB | R | R | R | ILE373 – GA | StericB | R | R | R |
| ALA405 – GA | StericB | R | R | R | |||||
| HIS524 – GA | StericB | R | R | R | |||||
| LEU525 – GA | StericB | R | R | R |
Table 4: Intermolecular interaction analysis of GE molecular docked with ERs
| ER-α | ER-β | ||||||||
| Interaction Residues/Atoms | Type | Triplicates | Interaction Residues/Atoms | Type | Triplicates | ||||
| 1 | 2 | 3 | 1 | 2 | 3 | ||||
| ARG394:NH2 – GE:O4 | HBond | R | R | R | LYS471:O – GE:O1 | HBond | R | R | R |
| LEU525:N – GE:O1 | HBond | R | R | R | MET336:SD – GE:O2 | S-Bond | R | R | R |
| GLY521:O – GE:O1 | HBond | R | R | £ | MET295 – GE | HY | R | R | R |
| MET343 – GE | HY | R | R | R | LEU298 – GE | HY | R | R | R |
| LEU346 – GE | HY | R | R | R | LEU301 – GE | HY | R | R | R |
| LEU349 – GE | HY | R | R | R | ALA302 – GE | HY | R | R | R |
| ALA350 – GE | HY | R | R | R | MET336 – GE | HY | R | R | R |
| LEU387 – GE | HY | R | R | R | LEU339 – GE | HY | R | R | R |
| LEU391 – GE | HY | R | R | R | LEU343 – GE | HY | R | R | R |
| PHE404 – GE | HY | R | R | R | PHE356 – GE | HY | R | R | R |
| MET421 GE | HY | R | R | R | ILE373 – GE | HY | R | R | R |
| ILE424 – GE | HY | R | R | R | ILE376 – GE | HY | R | R | R |
| HIS524 – GE | HY | R | R | R | HIS475 – GE | HY | R | R | R |
| LEU525 – GE | HY | R | R | R | LEU476 – GE | HY | R | R | R |
| MET528 – GE | HY | R | R | R | GLU305:OE2 – GE:C27 | StericB | R | R | R |
| ALA350 – GE | StericB | R | R | R | LEU343:CB – GE:C33 | StericB | R | R | R |
| LEU391 – GE | StericB | R | R | R | GLY472:O – GE:C23 | StericB | R | R | R |
Table 5: Intermolecular interaction analysis of GLA molecular docked with ERs
| ER-α | ER-β | ||||||||
| Interaction Residues/Atoms | Type | Triplicates | Interaction Residues/Atoms | Type | Triplicates | ||||
| 1 | 2 | 3 | 1 | 2 | 3 | ||||
| LEU346:O – GLA:O3 | HBond | R | R | R | ARG346:NH1 – GLA:O4 | HBond | R | R | R |
| ALA350:N – GLA:O3 | HBond | R | £ | £ | GLU305:OE1 – GLA:O4 | HBond | R | R | R |
| ARG394:NH2 – GLA:O4 | HBond | R | R | R | LEU298 – GLA | HY | R | R | R |
| PHE404:O – GLA:O4 | HBond | R | R | R | LEU339 – GLA | HY | R | R | R |
| LEU346 – GLA | HY | R | R | R | LEU343 – GLA | HY | R | R | R |
| LEU349 – GLA | HY | R | R | R | ILE373 – GLA | HY | R | R | R |
| ALA350 – GLA | HY | R | £ | R | ILE376 – GLA | HY | R | R | R |
| MET388 – GLA | HY | R | R | R | HIS475 – GLA | HY | R | R | R |
| LEU391 – GLA | HY | R | R | R | LEU476 – GLA | HY | R | R | R |
| PHE404 – GLA | HY | R | R | R | |||||
| MET421 – GLA | HY | R | R | R | |||||
| ILE424 – GLA | HY | R | R | R | |||||
| HIS524 – GLA | HY | R | R | R | |||||
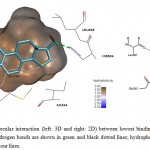 |
Figure 4: Illustration of intermolecular interaction (left: 3D and right: 2D) between lowest binding energy conformations of E2 in triplicates and ER-α. Hydrogen bonds are shown in green and black dotted lines; hydrophobic interactions are shown as surfaces and smooth contour lines. |
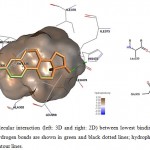 |
Figure 5: Illustration of intermolecular interaction (left: 3D and right: 2D) between lowest binding energy conformations of E2 in triplicates and ER-β. Hydrogen bonds are shown in green and black dotted lines; hydrophobic interactions are shown as surfaces and smooth contour lines. |
Fang et al. (2001) had suggested 3 main structural criteria for ligands to bind to ERs: 1) an aromatic ring attached with a hydroxyl group; 2) a second hydroxyl group; 3) hydrophobic core structure.22 Structuraly, GA and GE is pentacyclic triterpenoids with hydroxyl and carboxyl side groups, which fits part of the criteria, theoretically might be able to be docked into the ligand binding cavity of ERs. However, intermolecular interaction analysis of GA and GE docked with ERs showed multiple sites of unfavorable steric bumps (Figure 6-9). The presence of steric bumps indicated that the pentacyclic structure and methyl side groups of GA and GE are too rigid and bulky to facilitate energy favorable position in the ligand binding cavity of ERs. Indeed, the general ERs agonist consist of maximum of tetracyclic structure (as indicated by search hits at The Binding Database; results not shown). Moreover, the molecular size of ligands is an important factor to fit into the binding pocket of estrogen receptors, as suggested by Armstrong (2011).23 Therefore, even though a long list of hydrogen bonds and hydrophobic interactions were formed with one or more of the three important amino acid residues, the steric hindrance masked the favorable interactions. It is therefore concluded that GA and GE are also not practical for further chemical modification as ligands for ERs.
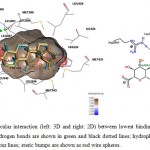 |
Figure 6: Illustration of intermolecular interaction (left: 3D and right: 2D) between lowest binding energy conformations of GA in triplicates and ER-α. Hydrogen bonds are shown in green and black dotted lines; hydrophobic interactions are shown as surfaces and smooth contour lines; steric bumps are shown as red wire spheres. |
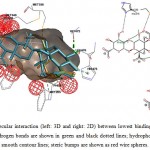 |
Figure 7: Illustration of intermolecular interaction (left: 3D and right: 2D) between lowest binding energy conformations of GA in triplicates and ER-β. Hydrogen bonds are shown in green and black dotted lines; hydrophobic interactions are shown as surfaces and smooth contour lines; steric bumps are shown as red wire spheres. |
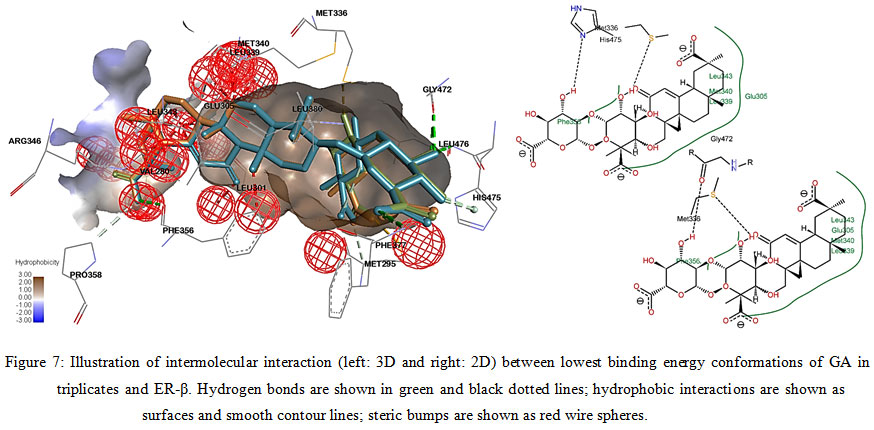 |
Figure 8: Illustration of intermolecular interaction (left: 3D and right: 2D) between lowest binding energy conformations of GE in triplicates and ER-α. Hydrogen bonds are shown in green and black dotted lines; hydrophobic interactions are shown as surfaces and smooth contour lines; steric bumps are shown as red wire spheres. |
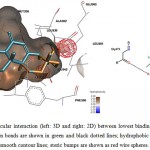 |
Figure 9: Illustration of intermolecular interaction (left: 3D and right: 2D) between lowest binding energy conformations of GE in triplicates and ER-β. Hydrogen bonds are shown in green and black dotted lines; hydrophobic interactions are shown as surfaces and smooth contour lines; steric bumps are shown as red wire spheres. |
GLA has been reported to share some similarity on molecular structures with E2, which both of them contain aromatic ring that substituted with hydroxyl group14. In general, GLA also fits the structural criteria suggested by Fang (2001), except lacking the second hydroxyl group. Certainly, GLA was able to be docked into the ligand binding cavity of ERs in this study. As shown in Figure 10 and 11, it was observed that GLA formed hydrogen bond with 1 or 2 of the 3 important amino acid residues (ARG394 of ER-α; GLU305 and ARG346 of ER-β). The lacking of 1 or 2 hydrogen bonds could be the reason why GLA-ERs showed relatively higher binding energies compared to that of E2-ERs. It is important to note that GLA also formed hydrogen bonds with LEU346, ALA350 and PHE404 in addition to ARG394 of ER-α in this study. Even though these hydrogen bonds were generally shorter and supposing stronger than those of E2-ER-α,24 the binding energy of GLA-ER-α was still relatively higher. This suggested that van der Waals forces and desolvation energy could play a more critical role in the binding of GLA-ERα.
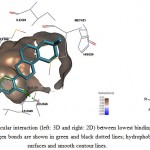 |
Figure 10: Illustration of intermolecular interaction (left: 3D and right: 2D) between lowest binding energy conformations of GLA in triplicates and ER-α. Hydrogen bonds are shown in green and black dotted lines; hydrophobic interactions are shown as surfaces and smooth contour lines. |
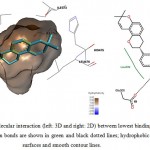 |
Figure 11: Illustration of intermolecular interaction (left: 3D and right: 2D) between lowest binding energy conformations of GLA in triplicates and ER-β. Hydrogen bonds are shown in green and black dotted lines; hydrophobic interactions are shown as surfaces and smooth contour lines. |
Another significant point to note is that the aromatic ring attached with hydroxyl group (1, 3-benzenediol) of GLA is rotatable. This is favorable as it provides flexibility to GLA so it could pose to better energy favorable conformation, such as that shown in Figure 11. It also gives more freedom to chemical modification and design of GLA analogues as ER agonists. The methyl side groups at the tricyclic structure is also ideal to be oxidized to form that extra hydroxyl groups that could facilitate better ERs binding as suggested by Fang et al. (2001). Therefore, it is suggested that GLA could be subjected to further chemical modifications and design novel semi-synthetic post-menopausal drugs.
Conclusion
In conclusion, GA and GE could not bind to ERs possibly due to the rigid and bulky pentacyclic ring structure and methyl side groups. GLA was observed to exert partial estrogenic activity towards ERs and there is potential to further chemically modify and optimize the estrogenicity.
Acknowledgement
This study was supported by Taylor’s University through its PhD Scholarship Programme and Exploratory Research Grant Scheme (ERGS), Ministry of Higher Education, Malaysia (Project code: ERGS/1/2012/STG08/TAYLOR/03/2).
Conflict of Interest
The authors declare that they have no conflict of interest.
References
- Murphy E. Estrogen signaling and cardiovascular disease. Circ Res. 2011;109(6):687-96.
CrossRef - Na K. S., Jee D. H., Han K., Park Y. G., Kim M. S., Kim E. C. The ocular benefits of sstrogen replacement therapy: A population-based study in postmenopausal Korean women. PLoS One. 2014;9(9):e106473.
CrossRef - Armitage M., Nooney J., Evans S. Recent concerns surrounding HRT. Clin Endocrinol. 2003;59(2):145-55.
CrossRef - Asl M. N., Hosseinzadeh H. Review of pharmacological effects of Glycyrrhiza sp. and its bioactive compounds. Phytother Res. 2008;22(6):709-24.
CrossRef - Sharma V., Agrawal R. C. Evaluation of anticlastogenic effects of Glycyrrhiza glabra root extract against Cyclophosphamide induced chromosomal aberration in Swiss albino mice. J App Pharm Sci. 2015;5(6):127-132.
CrossRef - Gaur R., Gupta V. K., Singh P., Pal A., Darokar M. P., Bhakuni R. S. Drug resistance reversal potential of isoliquiritigenin and liquiritigenin isolated from Glycyrrhiza glabra against methicillin-resistant Staphylococcus aureus (MRSA). Phytother Res. 2016;30(10):1708-15.
CrossRef - Maurya S. K., Raj K., Srivastava A. K. Antidyslipidaemic activity of Glycyrrhiza glabra in high fructose diet induced dsyslipidaemic Syrian golden hamsters. Indian J Clin BioChem. 2009;24(4):404-9.
CrossRef - Martins N., Barros L., Duenas M., Santos-Buelga C., Ferreira I. C. F. R. Characterization of phenolic compounds and antioxidant properties of Glycyrrhiza glabra rhizomes and roots. RSC Adv. 2015;5(34):26991-7.
CrossRef - Liu J., Burdette J. E., Xu H., Gu C., van Breemen R. B., Bhat K. P., Booth N., Constantinou A. I., Pezzuto J. M., Fong H. H., Farnsworth N. R., Bolton J. L. Evaluation of estrogenic activity of plant extracts for the potential treatment of menopausal symptoms. J Agric Food Chem. 2001;49(5):2472-9.
CrossRef - Visht S., Kulkarni G. T. Studies on the preparation and in vitro-in vivo evaluation of mucoadhesive microspheres of glycyrrhetinic acid isolated from liquorice. Bangladash Pharm J. 2015;18(1):30-7.
CrossRef - Jalilzadeh-Amin G., Najarnezhad V., Anassori E., Mostagavi M., Keshipour H. Antiulcer properties of Glycyrrhiza glabra extract on experimental models of gastric ulcer in mice. Iran J Pharm Res. 2015;14(4):1163-70.
- Hillerns P. I., Zu Y., Fu Y. J., Wink M. Binding of phytoestrogens to rat uterine estrogen receptors and human sex hormone-binding globulins. Z Naturforsch C. 2005;60(7-8):649-56.
CrossRef - Fujisawa Y., Sakamoto M., Matsushita M., Fujita T. Glycyrrhizin inhibits the lytic pathway of complement–possible mechanism of its anti-inflammatory effect on liver cells in viral hepatitis. Microbiol Immunol. 2000;44(9):799-804.
CrossRef - Somjen D., Katzburg S., Vaya J., Kaye A. M. Estrogenic activity of GLA and glabrene from licorice roots on human osteoblasts and prepubertal rat skeletal tissues. J Steroid Biochem Mol Biol. 2004;91(4-5):241-6.
CrossRef - Poh M. S. W., Yong P. V. C., Viseswaran N., Chia Y. Y. Estrogenicity of Glabridin in Ishikawa Cells. PLoS One. 2015;10(7):e0121382.
CrossRef - Nishihara T., Nishikawa J., Kanayama T., Dakeyama F. Estrogenic activities of 517 chemicals by yeast two-hybrid assay. J Health Sci. 2000;46(4):282-98.
CrossRef - Simons R., Vincken J. P., Mol L. A. M., The S. A. M., Bovee T. F. H., Luijendijk J. C., Verbruggen M. A., Gruppen H. Agonistic and antagonistic estrogens in licorice root (Glycyrrhiza glabra). Anal Bioanal Chem. 2011;401(1):305-13.
CrossRef - Powers C. N., Setzer W. N. A molecular docking study of phytochemical estrogen mimics from dietary herbal supplements. In Sillico Pharmacol. 2015;3(4):1-63.
CrossRef - Bolonna A. A., Kerwin R. W. Partial agonism and schizophrenia. J. Psychiatry. 2005;186(1):7-10.
CrossRef - Tamir S., Eizenberg M., Somjen D., Stern N. Estrogenic and antiproliferative properties of GLA from licorice in human breast cancer cells estrogenic and antiproliferative properties of GLA from licorice in human breast cancer cells. J Cancer Res. 2000;60(20):5704–9.
- Wang P., Mclnnes C., Zhu B. T. Structural characterization of the binding interactions of various endogenous estrogen metabolites with human estrogen receptor α and β subtypes: A molecular modeling study. PLoS One. 2013;8(9):e74615.
CrossRef - Fang H., Tong W., Shi L. M., Blair R., Perkins R., Branham W., Hass B. S., Xie Q., Dial S. L., Moland C. L., Sheehan D. M. Structure-activity relationships for a large diverse set of natural, synthetic, and environmental estrogens. Chem Res Toxicol. 2001;14(3):280-94.
CrossRef - Armstrong J. General, Organic, and Biochemistry: An Applied Approach, 1st edn. Massachusetts: Cengage Learning, 2011; pp. 484.
- Rajagopal S., Vishveshwara S. Short hydrogen bonds in proteins. FEBS J. 2005;272(8):1819-32.
CrossRef

This work is licensed under a Creative Commons Attribution 4.0 International License.


