

Manuscript accepted on : 02 March 2017
Published online on: --
Plagiarism Check: Yes
Mona S. Alwhibi
Department of Botany and Microbiology, Faculty of Science, King Saud University, P.O.Box 2455, Riyadh 11451, Saudi Arabia.
Corresponding Author E-mail: MALWHIBI@KSU.EDU.SA
DOI : http://dx.doi.org/10.13005/bbra/2425

ABSTRACT: Using remote sensing system i.e. Landsat Thematic Mapper (TM) and Enhanced Thematic Mapper Plus (ETM+), dense distribution of mangrove forest was found on Red sea coast between Ras – Al turfa in north and Bab – Al mandab in south. Avicennia marina was the only species found on the coast however satellite images revealed the presence of Rhizophora mucronata at the Farasan Archipelago and Kamaran Island. Comparison between GIS (Geographic Information System) analysis of the satellite images of the area for the years 2010 and 2014 showed gradual decrease of mangrove stands along the coast. During 2010, the total area covered by the mangrove forests was around 2442 hectares while in 2014 it was declined to 2141 hectares, of which 97 hectares of the mangroves stands were declined at the Saudi coast of Red sea while 204 hectares of mangrove stands were wiped out at the coastline touching Yemen. Field studies of the area showed that in the lapse of fifteen years, approximately 301 hectares of mangrove stands destroyed because of urbanization, industrialization, cattle grazing, particularly by camels and lack of awareness among locals.
KEYWORDS: Enhanced Thematic Mapper Plus; Landsat Thematic Mapper; Mangrove stands; Red sea coast
Download this article as:| Copy the following to cite this article: Alwhibi M. S. Density and Distribution of Mangrove Stands Between Ras – Al Turfa and Bab-Al Mandab using Remote Sensing System. Biosci Biotech Res Asia 2017;14(1). |
| Copy the following to cite this URL: Alwhibi M. S. Density and Distribution of Mangrove Stands Between Ras – Al Turfa and Bab-Al Mandab using Remote Sensing System. Biosci Biotech Res Asia 2017;14(1). Available from: https://www.biotech-asia.org/?p=22372 |
Introduction
Remote sensing is the acquisition of information about an object or phenomenon taking place on Earth without making physical contact with it by using electromagnetic radiations through aerial sensor technologies to detect and identify the objects on earth.1,2 The importance of Remote sensing the show after all kinds: aerial photographs and satellite radar views, etc., and provide a wealth of information on the ground. They help to continuous surveillance of land and resources and Algorithms classification,3 remote sensing Landsat (name indicating land + satellite) provides continuous space based records of Earth’s land using sensors like Thematic Mapper (TM) and Enhanced Thematic Mapper plus (ETM+) in the form of images Global Land Cover Facility, 2013.4 The landsat satellites has enabled the study of forests, food production, water and land use, ecosystems, geology etc. the long data records allows the scientists to evaluate the dynamic changes caused by both natural processes and human practices Landsat science,2013.5 Red sea is a seawater inlet of Indian Ocean, lying between Asia and Africa. Saudi Arabia and Yemen lies on the eastern shore of Red sea. Saudi Arabia has coastline of 2,640 kilometers, approximately 1800 kilometers along the Gulf of Aqaba and Red sea and the remainder along the Persian Gulf.6 Mangroves are distributed in over 118 countries and territories covering almost an area of 53,190 square miles.7 Mangroves are a diverse group of vegetation which is adapted to grow in saline conditions, having pneumatophores which help in respiration. Mangroves are very important. They prevent the shoreline from erosion due to storms, stabilizing coastal foreshores, sediment filtration, and carbon fixation and contributing to primary productivity8,9,10,11,12; Mangroves provides habitat for cryptic biota such as mosquito larvae and fungi. Mangrove wood is resistant to rot and insects making its extremely valuable. The mangrove forests must maintain to offset emissions C environment to increase the stock of carbon and at the regional level.13 Many coastal and indigenous communities rely on the wood as timber for construction material as well as for fuel. These communities also collect medicinal plants from mangrove ecosystems and use mangrove leaves as animal fodder.14 Avicennia marina is the most dominant species of mangroves found on Saudi coast of Red sea; however patches of Rhizophora mucronata also exists.15 According to arunkumar et al., (2010)15 human activities has greatly reduced the mangrove plantation in Saudi Arabia. Barratt et al., (1987)16 reported the destruction of mangroves in Yemen due to sand drifts. Price, (1987)17; Mandura et al., (1987 & 1988)18,19; Mandura & Khafaji, (1993)20 reported camel grazing as one of the most important reasons for the decline of mangrove forests on along the red sea coast. Mandura & Khafaji (1993)20 also reported industrialization as the cause of mangroves destruction. Previously, Arunkumar et al., (2010)15; Kuenzer et al., (2011)21; Qari & Basyoni (2003)22; etc. has used the remote sensing system, Landsat Thematic Mapper and Enhanced Thematic Mapper Plus for the study of mangroves and used aerial photography (taken through helicopter) to supplement the information of mangroves distribution at Farasan archipelago. The purpose of the current study was to check the geographical distribution of mangroves for the years 2010 and 2014, along the coastline between Ras – Al Turfa and Bab – Al Mandab using remote sensing system and finding out the factors and causes of decline of mangrove stands along the coast through field study.
Materials and Methods
Selection of Study Area
The area between Ras Al-turfa in the north and Bab Al-mandab in the south, which is about 857 km in length, was selected for study. Ras Al-turfa was located at the Southern region of Saudi Arabia while Bab Al-mandab was located the Yemeni coast of Red sea. Ras Al-turfa lies at the latitude of 17˚ 6΄ 35˝ N and at longitude of 42˚ 23΄ 24˝ E while Bab Al-mandab lies at the latitude of 12˚ 41΄ 23˝ N and at longitude of 43˚ 41΄ 23˝ E.
Data Acquisition
Collection of Data Through Remote Sensing System
Using Landsat Thematic Mapper (TM) and Enhanced Thematic Mapper Plus (ETM+), data was collected in the form of images. Electromagnetic Radiation sensor of TM and ETM+ had recorded different wavelengths of visible and infrared light of sun spectrum. Six bands (three visible bands 1, 2, and 3 and three of infrared wavelength bands 4, 5 and 7) obtained through the Landsat sensor was used to enhance spectral data for land features and vegetation mapping of the study area.
Maps and Images
The images of the area between Ras-Al-Turfa and Bab-Al-Mandab were obtained by Landsat for the years 2010 and 2014. The area covered by the four scenes were, path 166/row 50, path 166/row 51, path 167/row 48 and path 167/row 49 and each scene consist of four sub-scenes. Data acquired by the Landsat sensors were recorded on tiff files. Four tiff files of Landsat scenes covered the areas to south of Red Sea from Jazan to Bab-Al-Mandab including the Farasan Islands, and the Kamaran Island. All images data in the study were registered with the Universal Transverse Mercator (UTM), zone 39, 38 and rectified with the World Geodetic System WGS84. Base maps at a scale 1:10000 and 1:50000 were obtained from Landsat images bands 4, 3, 1 (red, green, blue) and 7, 4, 5 (red, green, blue).
Image Processing
The Landsat images were processed using ERDAS IMAGINE 8.7 image processing software. The images were imported into ERDAS using layer stack importing format. Two steps were taken to process the data. In the first step, the images were imported in to Erdas-imagine’s standard image format(Img). Since the images were in single bands, they were staked together using the layer stack technique to form a floating scene. A subset of the images was obtained from the floating scene to identify the study area and displayed as false color composite using a band combination of red as band 4, green as band 3, and blue as band 1. The images were later classified using an unsupervised classification. Polygons on computer screen were digitalized using (ESRI) Arc Map (GIS9) software programs. The identification and recognition of mangrove stands and land features were based on a number of well-defined interpretation criteria.
Collection of Data through Field Study
Field trips were conducted for the collection of data on ground. The area was observed thoroughly and data was recorded manually for the growth of mangrove’s stands, its distribution, classification and identification of its species in the area and other visual factors for the decline of the mangroves forest. Short nine field trips were conducted in particular to the areas of Khor Al-gandal in Farasan, Al-Kabir Island and Ras Al-turfa. These trips were conducted after locating the nine spots by GPS (Geographic Information System); sediment samples were collected from the suggested spots, studied and analyzed.
Result
The area which was about 857 km in length, was located at the coast of Red sea with Ras Al-turfa in the north and Bab Al-mandab in the south, was studied with the help of satellite images (Fig 1 and 12) and nine short field strips were made after GIS spotting (Fig 2). Satellite images for the years 2010 and 2014; revealed that the mangroves growth, in the areas of Khor Abu Saba up to Al-Midaya and Yemini coast stretching up to Ad-Dewaymah on the Saudi border, was high. Kamaran Island, Farasan Archipelago, Khor Al-gandal, Khor Farasan, Al-Gabor, Solin, Shura and Dajil Islands were having dense vegetation of mangroves. However, the area of Ras Al-turfa in Saudi Arabia and southern part of Yemen’s Red sea coast, from Al-Hodeida to Bab Al-mandab the growth was sporadic (Fig 4, 5,6,7,8, 9, 10 and 11). Comparison of satellite images for the years 2010 and 2014 revealed that mangroves stand has decreased throughout the Red sea coast in varying degrees. The total area covered by mangroves forest in 2010 was 2442 hectares which was decreased to 2141 hectares in 2014. Out of total loss of 301 hectares in fifteen years, 97 hectares of mangroves forest was lost on Saudi coast of Red sea while 204 hectares of mangroves forest was lost on Yemini coast of Red sea (See Tables 1 & 2). The whole coast of Red sea in general was occupied by monospecific population of mangrove’s species Avicennia marina, however satellite images and field studies indicated the presence of another species of mangroves that is, Rhizophora mucronata in the areas of Farasan Kabir and Kamaran islands. Visual observation of the field area indicated that urbanization, industrialization and grazing by cattle specially camels, were the main factors of decline. The unawareness to the importance of mangroves by the local folks was also an important factor. Cutting down of mangrove trees for timber, house hold activities, for the construction of sea ports and harbors, resulted in heavy loss of forest in some particular areas. In short, human activities during 2010 to 2014, has resulted in the decline of mangroves stand in the area.
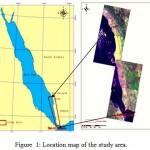 |
Figure 1: Location map of the study area.
|
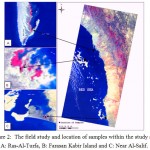 |
Figure 2: The field study and location of samples within the study area. A: Ras-Al-Turfa, B: Farasan Kabir Island and C: Near Al-Salif.
|
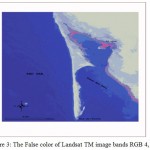 |
Figure 3: The False color of Landsat TM image bands RGB 4, 3, 1.
|
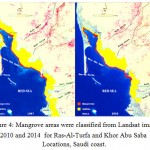 |
Figure 4: Mangrove areas were classified from Landsat images 2010 and 2014 for Ras-Al-Turfa and Khor Abu Saba Locations, Saudi coast.
|
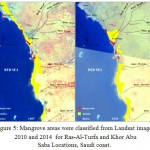 |
Figure 5: Mangrove areas were classified from Landsat images 2010 and 2014 for Ras-Al-Turfa and Khor Abu Saba Locations, Saudi coast.
|
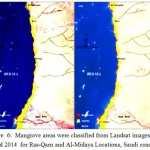 |
Figure 6: Mangrove areas were classified from Landsat images 2010 and 2014 for Ras-Qarn and Al-Midaya Locations, Saudi coast.
|
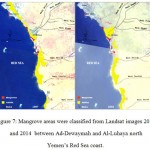 |
Figure 7: Mangrove areas were classified from Landsat images 2010 and 2014 between Ad-Dewaymah and Al-Luhaya north Yemen’s Red Sea coast.
|
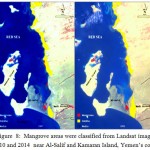 |
Figure 8: Mangrove areas were classified from Landsat images 2010 and 2014 near Al-Salif and Kamaran Island, Yemen’s coast.
|
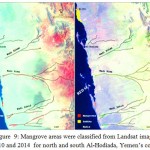 |
Figure 9: Mangrove areas were classified from Landsat images 2010 and 2014 for north and south Al-Hodiada, Yemen’s coast.
|
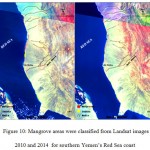 |
Figure 10: Mangrove areas were classified from Landsat images 2010 and 2014 for southern Yemen’s Red Sea coast
|
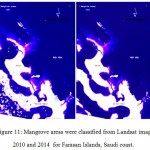 |
Figure 11: Mangrove areas were classified from Landsat images 2010 and 2014 for Farasan Islands, Saudi coast.
|
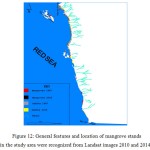 |
Figure 12: General features and location of mangrove stands in the study area were recognized from Landsat images 2010 and 2014.
|
Table 1: Comparison of Mangrove stands (in hectares) between 2010 & 2014 for Saudi Arabia
| Name of coast area | Study area in hectares | Loss of area | |
| 1987 | 2002 | % | |
| Ras-Al Turfa | 34.5 | 25 | -27.5 |
| Khor Abu Saba | 682.5 | 644 | -5.6 |
| Ras-Qarn | 38 | 19 | -50 |
| Al-Midaya | 274 | 244 | -10.9 |
| Total | 1029 | 932 | |
Table 2: Comparison of Mangrove stands (in hectares) between 2010 & 2014 for Yemen
| Name of coast area | Study area in hectares | Loss of area | |
| 2010 | 2014 | % | |
| Ad-Dewaymah | 126 | 121 | -3.9 |
| Midi | 89 | 69 | -22 |
| Habl | 68 | 50 | -26 |
| Habl /Buhays | 169 | 153 | -9.5 |
| Buhays | 36 | 26 | -27 |
| Buhays / Al-Luhaya | 93 | 87 | -6.5 |
| Al-Luhaya | 206 | 184 | -10.6 |
| Al-Luhaya / Al-Salif | 285 | 229 | -19.6 |
| North Al-Hodiada | 69 | 50 | -27.5 |
| Al-Hodiada/ Bab- Al Mandab | 272 | 240 | -11.7 |
Discussion
Keeping in view the satellite images and field work, it can be concluded that the distribution of mangroves along the red sea coast between Ras Al-turfa and Bab Al-mandab remained constant for both 2010 and 2014 however, comparison between the years indicated decrease in the vegetation. Mangroves are extremely important for sea shores, but human activities have greatly disturbed the flora of sea shore. Such man-induced stresses to the mangroves plantation have also been reported by Lugo and Snedaker (1974)23 from South Florida, where canalization and drainage had reduced mangrove vegetation. Since 2010 Saudi Arabia as well as Yemen has witnessed infrastructural progress, sea ports and harbors have been built, the area has been cultivated. Barratt et al., (1987)16 reported patches of A. marina were present on the entire length of Yemen’s Red sea coast however sand drifting has destructed the plantation at some places. Field study of Yemeni coast has revealed that the trees of mangroves were used for construction of houses while at some places trees were properly cleared for the purpose of construction. Camels also reared on the mangroves in these areas causing a great damage to the vegetation. Such results were also reported by Mandura & Khafaji (1993)20 etc. Proper steps must be taken to avoid the mangroves forest of Red sea coast from further destruction and decline. Cultivation of new plants under proper organization and planning should be done to restore the lost forest. Local folks should be educated to prevent camel grazing and cutting down of trees. Mangroves are extremely important and help the coast in maintaining its stability and also provide a home as well as breeding place to many aquatic organisms and shrimps etc.
Acknowledgement
The authors would like to extend their sincere appreciation to the Deanship of Scientific Research at King Saud University for its funding the study through the Research group Project no RG -1435-086.
References
- Schowengerdt R. A. Remote sensing: models and methods for image processing Academic Press. (3rd ed). 2007;75-126.
CrossRef - Schott J. R. Remote sensing the image chain approach. Oxford University Press. (2nd ed). 2007;153-191.
- Giri C. Observation and Monitoring of Mangrove Forests Using Remote Sensing: Opportunities and Challenges. Remote Sens. 2016;783(8):1-8.
- Global Land Cover Facility Land sat Imagery. http://glcf.umd.edu/data/landsat/. 2013.
- Landsat Science, NASA http://landsat.gsfc.nasa.gov/. 2013.
- Anonymous Library of congress- federal research division. Country profile-Saudi Arabia. 2006:1-28.
- Giri and Muhlhausen J. Mangrove forest distributions and dynamics in Madagascar (1975–2005). Sensors. 2008;8:2104–2117.
CrossRef - Alongi D. M., Boto K. G.,Tirendi F. Effect of exported mangrove litter on bacterial productivity and dissolved organic carbon fluxes in adjacent tropical near shore sediments. Marine Ecology Progress Series.1989;56:133-144.
CrossRef - Alongi D. M., Pfitzner J., Trott L. A., Tirendi F., Dixon P., Klumpp D. W. Rapid sediment accumulation and microbial mineralization in forests of the mangrove Kandelia candel in the Jiulongjiang Estuary, China. Estuarine, Coastal and Shelf Science. 2005;63:605-618.
CrossRef - Alongi D. M., McKinnon A. D. The cycling and fate of terrestrially-derived sediments and nutrients in the coastal zone of the Great Barrier Reef shelf. Marine Pollution Bulletin. 2005;51:239–252.
CrossRef - Boto K. G., Wellington J. T.,Robertson A. I. Nutrients Status of Mangrove Systems and some possible effects of extraneous inputs. 1988;33-38.
- Robertson A. I., Alongi D. M., Boto K. G.,Robertson A. I & Alongi D. M (eds). Food chains and carbon fluxes. In. Tropical Mangrove Ecosystems. Coastal and Estuarine Studies, American Geophysical Union, Washington, DC. 1992;41:293-326.
CrossRef - Tuea T. N.,Dungb V. L., Nhuanc T. M., Omoria K. Carbon storage of a tropical mangrove forest in Mui Ca Mau National Park, Vietnam. Catena. 2014;121:119-126.
CrossRef - Rath A. B. Mangrove importance. WWF global. 2013. http://wwf.panda.org/about_our_earth/blue_planet/coasts/mangroves/mangrove_importance/.
- Arunkumar, Khan, M., Muqtader., A. Distribution of Mangroves along the Red Sea Coast of the Arabian Peninsula: Part-I: the Northern Coast of Western Saudi Arabia. e-Journal Earth Science India. 2010;3(1):28-42.
- Barratt L., Shepherd A. D., Ormond R., McDowell R. Yemen Arab Republic Marine Conservation Survey, Distribution of habitats, species along the YAR coastline, unpublished report, International Union for Conservation of Nature and Natural Resources. 1987;1.
- Price A. R., Medley P. A., McDowall R. J., Shepherd A. R. D., Hogarth P. J., Ormond R. F. Aspects of mangal ecology along the Red Sea coast of Saudi Arabia. J. of Natur. History. 1987;21:449-464.
CrossRef - Mandura A. S., Saifullah S. M., Khafaji A. K. Mangrove Ecosystem of Southern Red Sea Coast of Saudi Arabia. Saudi .Biol. Soc. 1987;10:165-193.
- Mandura A. S., Khafaji A. K., Saifullah S. M.,(eds) Leith H and Al Masoom H. Ecology of a mangrove stand of a central Red Sea Coast Area: Ras Hatiba (Saudi Arabia). Saudi. Biol. Soc. 1988;11:85-112.
- Mandura A. S., Khafaji A. K. Human impact on the mangrove of Khor Farasan Island, Southern Red Sea Coast of Saudi Arabia. In: Towards the rational use of high salinity tolerant plants. 1993;1:353-361.
- Kuenzer C., Bluemel A., Gebhardt S., Quoc T. V., Dech S. Remote sensing of mangrove ecosystems: A review. Remote Sens. 2011;3:878–928.
CrossRef - Qari M. H .T., Basyoni M. H. Using Landsat-TM Images in Mapping Al-Majnonah Sabkha Distribution along the Red Sea Coast, Southeast of Al-Lith, Kingdom of Saudi Arabia. JKAU: Earth Sci. 2003;14:47-56.
- Lugo A. E., Snedaker S. C. The Ecology of Mangroves.Annual Review of Ecology and Systematics. 1974;5:39-64.
CrossRef

This work is licensed under a Creative Commons Attribution 4.0 International License.


