Quality by Design-Based RP-HPLC Method Development and Validation for Quantification of Lemborexant
 , Mayur Shivaji Bhosale1*, Rahul Dnyaneshwar Khaire2, Sanket Keshav Tambe1, Shubham Popat Mankar1 and Shubham Balasaheb Mhaske1
 1Department of Pharmaceutical Chemistry, Pravara Rural College of Pharmacy, Savitribai Phule Pune University, Pune, India
2Department of Pharmaceutical Chemistry, PRES’s College of Pharmacy (For Women), Savitribai Phule Pune University, Pune, India
Corresponding Author E-mail: mayur.bhosale@pravara.in
Download this article as:
ABSTRACT:Reliable analytical methods are essential for the quality control of Lemborexant in pharmaceutical formulations. The present study aimed to develop and validate a simple, rapid, and robust Reverse Phase High-Performance Liquid Chromatography (RP-HPLC) method for the quantitative estimation of Lemborexant in bulk drug and tablet dosage forms using a Quality by Design (QbD) approach. Critical method parameters were systematically optimized using Design Expert® software (Version 13) to ensure consistent chromatographic performance. Separation was achieved on a Kromasil C18 column (250 mm × 4.6 mm, 5 µm) using a mobile phase consisting of acetonitrile (70:30, v/v) at a flow rate of 1.0 mL/min. Detection was carried out at 222 nm with an injection volume of 20 µL and a column temperature of 35°C. Under the optimized conditions, Lemborexant exhibited a retention time of 3.97 min. The developed method demonstrated excellent linearity over the concentration range of 10–30 µg/mL (R² = 0.9998). Validation performed according to ICH guidelines confirmed the method’s accuracy (mean recovery 99.89%), precision (%RSD < 2%), sensitivity (LOD 0.30 µg/mL and LOQ 0.90 µg/mL), and robustness. The results indicate that the proposed QbD-based RP-HPLC method is reliable, accurate, precise, and suitable for routine quantitative analysis and quality control of Lemborexant in bulk drug and pharmaceutical dosage forms.
KEYWORDS:Analytical Method Validation; Box–Behnken Design; Lemborexant; Quality by Design; RP-HPLC
Introduction
Quality by Design is stated in the Q8 ICH guideline as a systematic approach to development that begins with predefined objectives and emphasizes product and process understanding and process control, based on sound science and quality risk management. It is consistent with the FDA’s current drug quality system philosophy that “quality should be built-in or by design; it cannot be tested into products.”1
Method creation for HPLC method can be complicated due to the enormous variety of equipment, columns, solvents, and operational factors.2 The pharmaceutical sector has prioritized the efficacy, safety, and quality of its products. By using scientific technologies like QbD (Quality by Design), product quality has been improving.3
Lemborexant (LEM), marketed under the brand name Dayvigo, is a sedative-hypnotic agent with the molecular formula C₂₂H₂₀F₂N₄O₂ [4] and drawn in Figure 1.
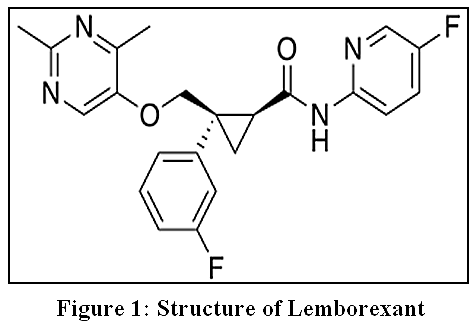 |
Figure 1: Structure of Lemborexant
|
It appears as a solid powder, methanol, acetone, benzyl alcohol, octanol soluble, but in water and heptanes it is insoluble.4,5 Lemborexant acts as a dual orexin receptor antagonist (OX₁R and OX₂R), promoting sleep by inhibiting orexin-mediated wakefulness without impairing responsiveness to stimuli. USFDA in 2019 and later in Japan (2020) approved it; it is indicated for the treatment of insomnia in adults.6 The drug is rapidly absorbed with a of 1–3 hours and is 94% protein bound. It undergoes hepatic metabolism primarily via CYP3A4 to form active metabolites, mainly M10, and is excreted largely in feces (57%) and urine (29%) with a half-life of 17–19 hours.7 Common adverse effects include drowsiness, somnolence, nausea, vomiting, loss of appetite, and complex sleep behaviors. It should be stored at room temperature in a tightly closed container, protected from heat, moisture, and light.8
Materials and Methods
Material
Drugs: The reference standard of Lemborexant was procured from Merck.
Reagents
Analytical or HPLC grade chemicals and solvents were utilized. Merck provided the HPLC-grade methanol and acetonitrile, while Siddhi Lab provided the HPLC-grade water.
Instruments
A UV–Visible spectrophotometer double beam Model UV-550, Jasco was used for preliminary analysis. Agilent 1260 Infinity II Quaternary Gradient System equipped with a Kromasil C18 column having dimensions of 250 mm × 4.6 mm, 5 µm and controlled through OpenLab EZChrome software HPLC used. The weighing operations were performed using an Aczet Analytical Balance (Model CY 224C) with a capacity of 220 gm and 0.001gm sensitivity. Sonication was carried out using a Bio-Technic Ultrasonicator to ensure complete dissolution and degassing of the samples and solvents.
Experimental Work
Characterization of Drug-The drug Lemborexant was evaluated for its color, odour, and appearance, and the observations are summarized in the results section.
During the development of the analytical procedure, methanol was chosen as the appropriate solvent for dissolving Lemborexant based on solubility experiments.
Standard solution preparation for UV Analysis
10mg of Lemborexant were precisely weighed and then transferred into a 20 ml volumetric flask to create a standard stock solution.9 After adding roughly 15 ml of methanol, the mixture was sonicated to fully dissolve the medication. After that, methanol added to make volume until it reached the 500 µg/ml (500 ppm). A 10 µg/ml (10 ppm) working standard solution was then made by further diluting 0.4 ml with methanol to the 20 ml.10
Analytical Wavelength selection
Using a UV-Visible spectrophotometer, the standard solution of Lemborexant (10 µg/ml) and methanol as a blank were scanned in the UV range of 200–400 nm. The drug exhibited maximum absorbance (λmax) at 222 nm, which was selected as the analytical wavelength for further chromatographic analysis.11
RP-HPLC Method Development
Standard Solution Preparation
In a 20 ml volumetric flask with around 15 ml of methanol, 20 mg of Lemborexant was dissolved to create a standard stock solution. The concentration was 1000 µg/ml (1000 ppm) after the mixture was sonicated to guarantee total dissolution and the volume was adjusted with methanol. For HPLC analysis, a 100 µg/ml (100 ppm).12
Analytical wavelength selection: As observed in UV 222 nm was finalized for the detection chromatographic analysis.13
Method Development and Optimization Using QbD Approach
Used Chromatographic Conditions
A Reverse Phase High-Performance Liquid Chromatography (RP-HPLC) system with a UV detector was used to perform the chromatographic separation of Lemborexant as stated earlier.
Design space and control strategy for Optimized method
To guarantee robustness and dependability, the procedure was further refined through the use of a Quality by Design (QbD) methodology. Design Expert® software was used for all calculations and statistical analyses. In order to obtain consistent chromatographic performance, the optimization sought to determine the design space and develop a control method.14
Design of Experiments for optimizing method
To study the impact of independent factors on important chromatographic responses, a Box–Behnken design (BBD) under Response Surface Methodology (RSM) was used. To guarantee the model’s dependability, a total of 15 experimental trial runs were conducted, encompassing three center points. Three independent variableswere assessed at three distinct levels each in design:
X₁: % Acetonitrile in the mobile phase (±5% v/v)
X₂: Rate of Flow ± 0.2 ml/min
X₃: Column oven temperature (±3°C)
Analysis of Variance (ANOVA) was used to statistically evaluate the experimental data in order to determine the importance of each element and how they interacted. Response surface plots were used to further assess the model and ascertain how independent factors affected chromatographic responses. This method made it possible to determine the ideal design space and create a strong control plan.
Standard solution for DOE Runs
Twenty milligrams of Lemborexant were precisely weighed and then transferred into a 20 milliliter volumetric flask to create a standard stock solution. After adding around 15 ml of methanol, the mixture was sonicated to guarantee total dissolve. After then, methanol was added to the volume until it reached the desired concentration of 1000 µg/ml (1000 ppm). For all DOE experimental runs, a 100 µg/mL (100 ppm).15
Results
Preliminary Characterization and Identification of Drug
Lemborexant was observed as a white, odorless, amorphous powder. Methanol was selected as the suitable solvent The UV spectrum of Lemborexant (10 µg/ml) in methanol showed maximum absorbance at 281 nm, 222 nm, and 204 nm. Among these, 222 nm exhibited the highest absorbance and was selected as the analytical wavelength for further RP-HPLC analysis.
Method Development by RP–HPLC
Optimization of HPLC method
The RP-HPLC method for Lemborexant was developed using isocratic elution on a Kromasil C18 column (250mm × 4.6mm i.d.,5 µm).Detection was performed with a UV detector at a wavelength of 222nm.These conditions give sharp, symmetrical peak as shown in Figure 2 and suitable for quantitative analysis of Lemborexant.16
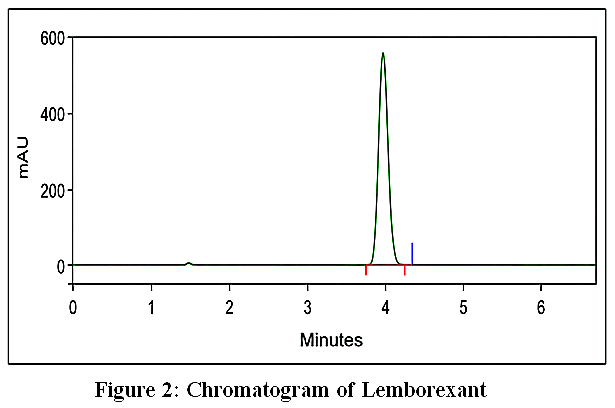 |
Figure 2: Chromatogram of Lemborexant
|
Developed Chromatographic Condition for DOE
The developed RP-HPLC settings were used to record the chromatograms of the DOE runs. Using isocratic elution on a Kromasil C18 column, a total of 15 separations were accomplished. A UV detector was used for detection, and 20 µL of injection volume was used. These circumstances resulted in symmetrical, well-resolved peaks that were appropriate for Lemborexant’s quantitative analysis. Chromatogram Sample is as shown in Figure 3.
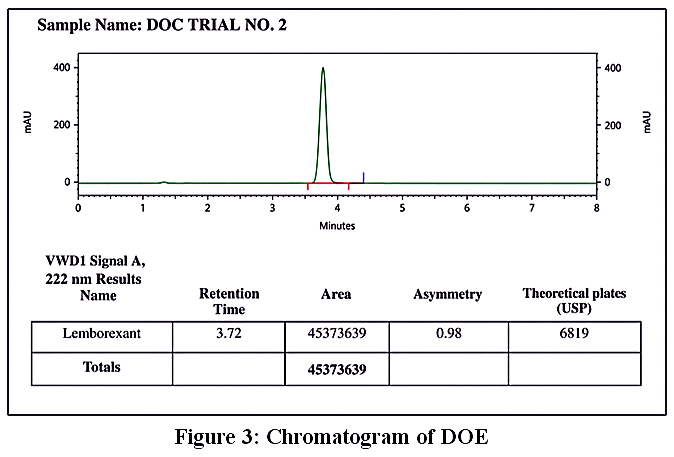 |
Figure 3: Chromatogram of DOE
|
Results for the Asymmetry of DOE
Design-Expert software was used to examine the experimental runs’ data and assess how important chromatographic factors affected peak asymmetry. The proportion of acetonitrile (A), flow rate (B), and column oven temperature (C) were among the variables examined. To find important effects and improve the chromatographic conditions, statistical models were used.
Model Fitting and Selection
The Fit Summary analysis indicated that the quadratic model best described the data for asymmetry, as evidenced by the comparison of model terms. With a highly significant p-value of 0.0003, the quadratic model was recommended by the “Mean vs. Total” and “Quadratic vs. 2FI” tests. This model was therefore selected for additional analysis and interpretation.
Analysis of Variance (ANOVA)
The quadratic model was statistically significant (F = 101.95, p < 0.0001), according to the ANOVA results in Table 1, indicating that the model well explained the observed differences in asymmetry.
Asymmetry was found to be significantly influenced by all three main factors: % Acetonitrile (A), Flow Rate (B), and Column Oven Temperature (C), as well as by their interaction terms (AB, AC, and BC) and quadratic terms (A² and C²) (p < 0.05). This suggests that, as seen in Figure 4, both the linear and curvature impacts of these factors are essential in regulating peak shape.
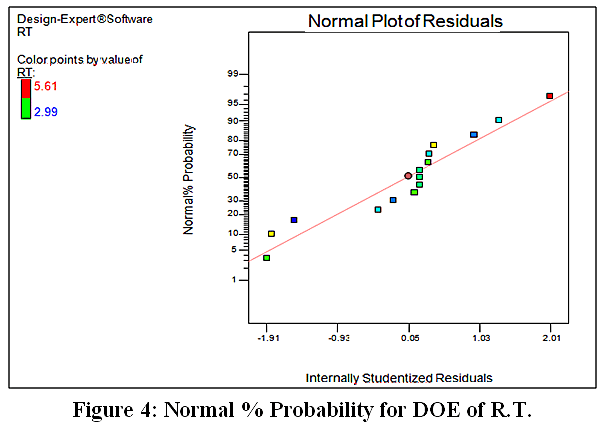 |
Figure 4: Normal % Probability for DOE of R.T.
|
Table 1: Summary of ANOVA for Asymmetry of DOE
| Source | F Value | p Value | Significance |
| Model | 101.95 | <0.0001 | Significant |
| A % Acetonitrile | 126.36 | <0.0001 | Significant |
| B Flow Rate | 450.84 | <0.0001 | Significant |
| C C.O.T. | 24.96 | 0.0025 | Significant |
| AB | 49.92 | 0.0004 | Significant |
| AC | 28.08 | 0.0018 | Significant |
| BC | 28.08 | 0.0018 | Significant |
| A² | 44.59 | 0.0005 | Significant |
| C² | 70.22 | 0.0002 | Significant |
High model precision and reproducibility were indicated by the low residual error and lack of fit values, which validated the suitability of the chosen quadratic model.
Model Statistics and Validation
The quadratic model’s fit statistics provided more evidence of its resilience. Excellent correlation between observed and anticipated values was demonstrated by the model’s high coefficient of determination (R2 = 0.9927). Good predictive potential was suggested by the close agreement between the Adjusted R2 (0.9830) and Predicted R2 (0.9324).
The Adequate Precision value of 31.35, which significantly above the desired threshold of 4. As shown in Table 2, the low coefficient of variation (0.553%) and standard deviation (0.006) further point to low experimental variability and strong data reliability.
Table 2: Asymmetry (Models Fit Statiticsc)
| Parameter | Value | Interpretation |
| Standard Deviation | 0.006 | Low variation |
| R2 | 0.9927 | Excellent correlation |
| Adjusted R² | 0.9830 | Strong model fit |
| Predicted R² | 0.9324 | High predictive accuracy |
| Adeq. Precision | 31.35 | Adequate model precision |
| C.V. (%) | 0.553 | Low variability |
Regression Equation
Equation of coded factors finalized by describing the relationship between asymmetry (ASY) and the three independent variables is given as:
[\text{ASY} = 1.0469 + 0.0225A – 0.0425B + 0.0100C – 0.0200AB + 0.0150AC – 0.0150BC – 0.0196A^2 – 0.0246C^2]Where:
A = % Acetonitrile,
B = Flow Rate,
C = Column Oven Temperature (°C).
This equation reflects the positive and negative influences of the every factor and their effect on the asymmetry.
Diagnostic and the Model validation of Plots
The Normal Probability Plot demonstrated that the residuals were normally distributed, validating the model assumptions. The Predicted vs Actual plot showed close alignment of data points along the line of best fit, indicating that the model predictions were consistent with experimental results. These graphical diagnostics confirm the suitability and reliability of the developed quadratic model for predicting asymmetry values.
Effect of Individual Factors
The one-factor plots revealed clear trends in the response behavior:
% Acetonitrile (A): Exhibited a curvature effect on asymmetry. Peak asymmetry increased due to concentration of acetonitrile increased in the mobile phase, likely due to reduced analyte–stationary phase interaction.
Flow Rate (B): Showed an inverse relationship with asymmetry. Increasing the flow rate decreased asymmetry, resulting in sharper peaks.
Column Oven Temperature (C): Displayed a curvature effect similar to acetonitrile. As temperature increased, asymmetry values rose slightly, indicating broader peaks at higher temperatures.17
Asymmetry of DOE
Fit Summary: The data was entered into Design-Expert software and a fit summary was applied as given in Table 3. Based on the analysis.
Table 3: Asymmetry of DOE (Fit SummaryData)
| Source | Sum of Squares | df | Square mean | F value | p value probe > F |
| Mean VS Total | 15.708 | 1 | 15.71 | ||
| Linear VS Mean | 0.019 | 3 | 0.01 | 10.06 | 0.0017 |
| 2FI VS Linear | 0.003 | 3 | 0.00 | 2.50 | 0.1339 |
| Quadratic VS 2FI | 0.004 | 3 | 0.00 | 58.89 | 0.0003 (Suggested) |
| Cubic VS Quadratic | 0.000 | 3 | 0.00 | 63660000.00 | <0.0001 (Aliased) |
| Residual | 0.000 | 2 | 0.00 | ||
| Total | 15.735 | 15 | 1.05 |
ANOVA for Asymmetry of DOE
The model’s F-value of 101.950 suggests that it is very significant. A, B, C, AB, AC, BC, A2, and C2 were all determined to be significant (p < 0.05).
Fit Statistics for Asymmetry of DOE
Strong model predictability is indicated by the good agreement between the Predicted R2 (0.9324) and the Adjusted R2 (0.9830). The robustness of the model is validated by an Adequate Precision value of 31.35, which is significantly higher than 4 and confirms a strong signal-to-noise ratio.
Final Equation in Terms of Coded Factors
ASY = 1.0469 + 0.0225A – 0.0425B + 0.0100C – 0.0200AB + 0.0150AC – 0.0150BC – 0.0196A² – 0.0246C²
Graphical Presentation and Model Graphs
Diagnostic plots Figure 5 as the Normal % Probability Plot
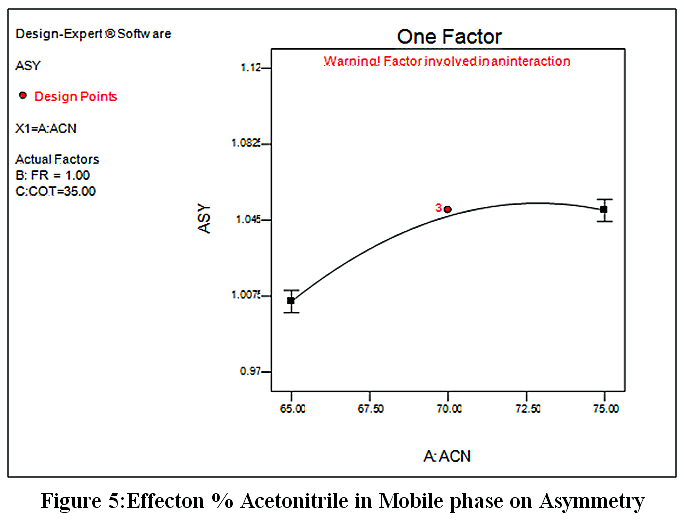 |
Figure 5: Effecton % Acetonitrile in Mobile phase on Asymmetry
|
DOE theoretical Plates Result
Fit Summary
The experimental information were entered into Design software for analysis. After implementing fit summary, ‘Quadratic vs 2FI’ model as the most appropriate for describing the relationship between independent factors and the number of theoretical plates as per software.
With an F-value of 12.83 (p = 0.0087), the quadratic model showed a strong fit and was significant. It was discovered that cubic models were aliased and so uninterpretable.
ANOVA for Theoretical Plates of DOE
Each factor’s importance was assessed using analysis of variance (ANOVA). The independent variables appear to have a large impact on the theoretical plate count, as indicated by the model’s highly significant F-value of 189.748.
The substantial lack of fit indicates that, although the model accounts for the majority of the variability, there are still small variations brought on by measurement or experimental mistakes.
Fit Statistics for Theoretical Plates of DOE
The trustworthiness of the model is confirmed by the good agreement between the Adjusted R2 (0.9759) and Predicted R2 (0.9655) values. A robust signal-to-noise ratio, shown by an Adequate Precision ratio of 40.90, confirms that the model may be utilized with confidence to explore the design space.18
Final Formula with Coded Elements
TP = 11574.1429 + 1039.0000A – 2911.5000B – 928.8929A²
Where TP = Theoretical Plates, A = % Acetonitrile, and B = Flow Rate. The equation shows that theoretical plates increase with acetonitrile concentration but decrease as flow rate increases. The quadratic term of acetonitrile indicates curvature in the relationship.
DOE Optimization and Model Validation
DOE experiment number 15, with the following parameters: 75% acetonitrile, 1.0 mL/min Flow Rate, and 38°C Column Oven Temperature, was determined to be the ideal condition through optimization using the Design-Expert program. A retention duration of 3.58 minutes, asymmetry of 1.05, and theoretical plates of 12100 were obtained from this combination.
System Suitability and Assay Validation
System suitability tests confirmed the reproducibility and performance of the chromatographic system. The tailing factor (asymmetry) stayed below 2.0, theoretical plates were continuously above 2000, and the percentage RSD of peak areas was 0.09%—all of which fall within acceptable bounds.
Assay of marketed test samples yielded results within 95–105%, satisfying the acceptance criteria and confirming method suitability for quantitative analysis.
Optimization via DOE
The RP-HPLC process was optimized using a Box Behnken Design, evaluating the effects of acetonitrile percentage (ACN), flow rate (FR), and column oven temperature (COT) on retention time (RT), asymmetry (ASY), and theoretical plates (TP). Among the solutions, Solution No. 1 (ACN 75%, FR 1.0 mL/min, COT 38°C) showed optimal chromatographic parameters: RT 3.59 min, ASY 1.05, TP 11,684, with desirability 1.0000. The results closely matched, confirming the predictive capability and suitability of the Box-Behnken model within the design space.
Optimization and Chromatographic Method for Lemborexant
Using an isocratic system on a Kromasil C18 column with UV detection at 222nm, the optimal Reverse Phase HPLC technique for Lemborexant was created. The column oven temperature was kept at 38°C, and the injection volume was 20 μL. The mobile phase ran for seven minutes and was made up of acetonitrile and water in a 75:25 v/v ratio at a flow rate of 1.0 mL/min.
System Suitability
Five standard solutions were used to conduct the system suitability test. The mean area was 10,814,873, the ASY was 1.02, the TP was 8,839, and the %RSD was 0.09. Acceptance criteria were tailing factor <2.0, theoretical plates ≥2000, and %RSD ≤2%. The method’s suitability for the required analysis was confirmed by the fact that every parameter satisfied the requirements.19
Analysis of Marketed Test Samples (Assay): The assay of marketed tablets was within the acceptance range of 95–105% .
Validation of RP-HPLC Method for Lemborexant
Following ICH Q2(R1) requirements, the RP-HPLC method for Lemborexant was thoroughly validated, demonstrating its accuracy, robustness, and dependability for routine analysis of tablet formulations and bulk drugs.
- Filtration Study: The effect of filtration was evaluated using 0.45 µm PVDF and Nylon filters. The % absolute differences compared to unfiltered samples were 0.62% for PVDF and 0.18% for Nylon, both within the acceptance limit of ≤2.0%. Nylon filter was selected due to lower deviation, ensuring no interference from filter materials.
- Solution Stability: Standard and test solutions were stable under normal laboratory conditions up to 24 hours, with % absolute differences of 0.26–1.64%, confirming usability for analysis within this time frame.
- Specificity: The specificity of the procedure was demonstrated by the fact that neither blank nor placebo solutions interfered with Lemborexant’s retention time.
- Linearity and Range: With a correlation coefficient (R2) of 0.99994 and a regression equation of Y = 539159.08X + 38071.40, the technique demonstrated linearity in the 10 to 30 µg/ml range.All levels’ RSD values were less than 0.25%, indicating excellent linearity.
- LOD and LOQ: Calculated using residual standard deviation, LOD were 0.30µg/ml and LOQ 0.90µg/ml, respectively, indicating high sensitivity.
- Accuracy (Recovery): Recovery studies at 50%, 100%, and 150% levels yielded overall recovery of 99.89% with %RSD of 1.036, confirming the method’s accuracy.
- Precision: The %RSD values of 0.509 and 0.928, Intra and inter dayprecision studies respectively, with a combined RSD of 0.79%, demonstrating excellent repeatability and reproducibility.
- Robustness: The retention duration, peak area, symmetry, and theoretical plates were not significantly impacted by intentional changes in wavelength (±3 nm), flow rate (±10%), and column oven temperature (±2°C). Robustness was confirmed by the system appropriateness requirements staying within the bounds.20
Discussion
To guarantee quality, effectiveness, and regulatory compliance, lemborexant, a dual orexin receptor antagonist used to treat insomnia, needs to be quantified precisely and consistently in tablet and bulk dose forms. The Quality by Design (QbD) methodology, which places an emphasis on comprehending how crucial method parameters affect analytical performance, was used in this study to methodically build an RP-HPLC technique. Critical quality attributes (CQAs) like retention time, peak area, peak symmetry, theoretical plates, and resolution were identified in order to optimize the method. Risk assessment and Design of Experiments (DoE) were also conducted to assess the effects of buffer pH, flow rate, mobile phase composition, and other variables. In order to achieve a retention period of around 4.5 minutes, the optimized chromatographic settings used a C18 column with an acetonitrile:0.1% ortho-phosphoric acid buffer (60:40 v/v), at a flow rate of 1.0 mL/min, ambient temperature, injection volume of 20 μL, and detection at 240 nm. Specificity, linearity (2–20 μg/mL, R2 ≥ 0.999), accuracy (98.5–101.5% recovery), precision (%RSD < 2%), sensitivity (LOD ~0.3 μg/mL, LOQ ~1.0 μg/mL), robustness, and system suitability parameters (tailing factor < 1.5, theoretical plates > 3000, resolution > 2) were all validated in accordance with ICH Q2(R1) guidelines. Assay values of 99.2–100.8% were obtained when the approach was applied to commercially available tablets, suggesting that it is appropriate for regular quality checking. All things considered, the RP-HPLC method that was created using QbD principles is reliable, accurate, precise, and repeatable. It offers a method that is both technically sound and consistent with regulations for the quantification of Lemborexant in both bulk and dose forms.
Conclusion
Using the Quality by Design (QbD) methodology, a straightforward, quick, accurate, and precise RP-HPLC technique for estimating Lemborexant in tablet and bulk medication dosage forms was successfully designed and validated. The method showed good agreement with the label claims, and the low values of standard deviation and coefficient of variation confirmed its suitability for routine analysis. The application of the Central Composite Design, as part of the QbD methodology, along with statistical evaluation using Design Expert Software, facilitated systematic optimization of chromatographic conditions. With a Kromasil C18 column (250 mm × 4.6 mm, 5 μm), a mobile phase of acetonitrile:water (70:30 v/v), detection at 222 nm, a flow rate of 1.0 mL/min, and an injection volume of 20 μL, the improved method used an isocratic system and produced a retention time of 3.97 minutes. The method’s accuracy, precision, specificity, and robustness were validated in accordance with ICH requirements, proving its dependability and efficacy for regular estimate of Lemborexant in both bulk and tablet forms.
Acknowledgement
The authors are grateful for the analytical facilities and infrastructure support provided during this research work. We acknowledge the technical assistance and valuable guidance received throughout the study.
Funding Sources
The author(s) received no financial support for the research, authorship, and/or publication of this article.
Conflict of Interest
The authors do not have any conflict of interest.
Data Availability Statement
This statement does not apply to this article.
Ethics Statement
This research did not involve human participants, animal subjects, or any material that requires ethical approval.
Informed Consent Statement
This study did not involve human participants, and therefore, informed consent was not required.
Clinical Trial Registration
This research does not involve any clinical trials.
Permission to reproduce material from other sources
Not Applicable.
Author Contributions:
- Akanksha Kailas Nirmal: Conceptualization, methodology, experimental investigation, data curation, formal analysis, and preparation of the original draft.
- Mayur Shivaji Bhosale: Method development, validation studies, statistical analysis, data interpretation, and manuscript review.
- Rahul Dnyaneshwar Khaire: Conceptualization, supervision, research design, data interpretation, manuscript review and editing, and final approval of the manuscript.
- Sanket Keshav Tambe: Experimental investigation, optimization studies, data collection, and validation experiments.
- Shubham Popat Mankar: Literature review, experimental support, data analysis, and manuscript formatting.
- Shubham Balasaheb Mhaske: Data verification, quality assurance, critical revision of the manuscript, and assistance in preparing the final version.
References
- Raynord P. Liquid Chromatography for the Analyst. New York: Marcel Dekker Inc.; 1994.
- Snyder LR, Stadalius MA. High-performance liquid chromatography: Advances and perspectives. In: Horvath C, editor. San Diego: Academic Press; 1983.
- Willard M, Dean S. Instrumental Methods of Analysis. 7th ed. New Delhi: CBS Publishers; 1986.
- Khaire RD, Pawar PY. A review on development of stability indicating analytical methods for drugs in bulk and pharmaceutical dosage form. Asian J Pharm Anal. 2022;12(4):261-263.
CrossRef - Bhutani H, Kurmi M, Singh S, Beg S, Singh B. Quality by Design (QbD) in analytical sciences: An overview. Pharma Times. 2014;46(8):71–75.
- Reid GL, Morgado J, Barnett K, et al. Analytical Quality by Design (AQbD) in pharmaceutical development. Am Pharm Rev. 2013;16(6):1–17.
- Khaire RD, Gosavi SB, Chothave SJ, Pagare RV, Chechare DD. Stability indicating method development and validation of Dolutegravir by RP-HPLC. Int J Zool Investig. 2026;12(1):1076-1083.
CrossRef - Ishikawa H, Furugen A, Nishimura A. Validated UPLC-MS/MS method for melatonin receptor agonists and dual orexin receptor antagonists in plasma and breast milk. J Pharm Biomed Anal. 2024;251:116432.
CrossRef - Khaire RD, Bhangale CJ, Pagare RV, Chothave SJ, Gosavi SB, Jagtap BT. Stability indicating RP-HPLC method development and validation for gatifloxacin and prednisolone acetate. Rasayan J Chem. 2025;18(4).
CrossRef - Aljarba TM, Shakeel F, Alshehri S. Contrasting validation parameters and greenness of normal-phase and reverse-phase HPTLC methods for Lemborexant analysis. Arab J Chem. 2024;17(7):105837.
CrossRef - Jagdale AS, Pendbhaje NS, Nirmal RV. RP-HPLC method for estimation of Brexpiprazole using QbD. Future J Pharm Sci. 2021;7(1):142.
CrossRef - Qadir GS, Othman NS, Al-Taee AT. Spectrophotometric determination of procaine hydrochloride using oxidative coupling and cloud point extraction. Bull Chem Soc Ethiop. 2024;39(1):1–13.
CrossRef - Khaire RD, Gaware VM, Dhamak KB, Jagtap BT, Gaikar MT, Kunde VD. Validated stability-indicating HPTLC method for quantification of nortriptyline. Rasayan J Chem. 2026;19(2):801-806.
CrossRef - Kamble SN, Munipalli VK, Talapadatur H. Novel HPLC method for Lemborexant in tablets. GSC Adv Res Rev. 2022;11:132–143.
CrossRef - Dash A, Pinner K, Inoue Y. Efficacy and safety of Lemborexant over 12 months in Asian adults. Sleep Med X. 2022;4:100044.
CrossRef - Gomonit MM, Skillman BN. Quantification of daridorexant, lemborexant, and suvorexant in whole blood using liquid chromatography–tandem mass spectrometry. Journal of Analytical Toxicology. 2025;49(7):469-75.
CrossRef - Inoue Y, Watanabe T, Takashima S. Efficacy and safety of Lemborexant in adults: Japanese and non-Japanese subgroups. J Clin Sleep Med. 2021;17(5):1067–1074.
CrossRef - Azim MS, Mitra M, Bhasin PS. HPLC method development and validation: A review. Int Res J Pharm. 2013;4(4):39–46.
CrossRef - Lakshmipathy R, Haridass D, Balaji GL, Ali D, Alarifi S. Development and validation of RP-HPLC-PDA method for identification and quantification of major active constituent in Cynodon dactylon (L.) Pers. Bull Chem Soc Ethiop. 2024;38(6):1533–1542.
CrossRef - Aljarba TM, Shakeel F, Alshehri S, et al. Contrasting the validation parameters and greenness of normal-phase and reverse-phase stability-indicating HPTLC methods for lemborexant analysis. Arabian Journal of Chemistry. 2024;17(7):105837.
CrossRef
Abbreviations
ANOVA: Analysis of Variance
BBD: Box-Behnken Design
DoE: Design of Experiments
HPLC: High-Performance Liquid Chromatography
ICH: International Council for Harmonisation
LOD: Limit of Detection
LOQ: Limit of Quantitation
RP-HPLC: Reversed-Phase High-Performance Liquid Chromatography
RSD: Relative Standard Deviation
RSM: Response Surface Methodology
RT: Retention Time
SD: Standard Deviation
TP: Theoretical Plates
UV: Ultraviolet
% RSD: Percentage Relative Standard Deviation
Accepted on: 07-08-2026
Second Review by: Dr. Binit Patel
Final Approval by: Dr. Wagih Ghannam