
Liquisolid Compact-Based Strategy for Augmented Solubility and Dissolution Profile of Dolutegravir Sodium
 , Mayuri Nazirkar, Kiran Thorat and Ubed Kothali
 Department of Pharmaceutics, Smt. Kashibai Navale College of Pharmacy, Pune, India.
Corresponding Author Email: drarpanarpatil@gmail.com
DOI : http://dx.doi.org/10.13005/bbra/3472
Download this article as:
![]()
Dolutegravir (DTG), classified as an integrase strand transfer inhibitor received regulatory approval in 2013, prevents immunodeficiency and reduces transmission risk. DTG demonstrates high permeability but limited solubility in aqueous medium. The present investigation designed to improve its solubility and rate of dissolution by formulating as liquisolid compact for oral route. Capmul MCM:Tween 20 (1:1) is used as a non-volatile liquid vehicle based on DTG solubility whereas based on liquid retention factor Neusilin UFL2 as carrier material and Aerosil 300 as coating material were selected.. The effect of % drug concentration in non-volatile solvent and ratio of carrier:coating on solubility and various dissolution parameters (Q10, T50 and Q60) were systemically optimized through 32 full-factorial design. Polynomial equations and surface response graphs served to illustrate the influence of independent variables. In-vitro DTG release was superior from liquisolid compact tablets than pure drug as reflected from Mean Dissolution Time, Mean Dissolution Rate and Dissolution Efficiency values due to improved contact angle, wetting and drug surface area. FTIR results showed no drug-excipient interaction, while DSC and PXRD suggested loss of DTG crystallinity, indicating molecular dispersion of DTG. The liquisolid approach proved promising in promoting solubility and dissolution characteristics of Dolutegravir, a Biopharmaceutical Classification System (BCS) class II drug.
KEYWORDS:Aerosil 300; Dolutegravir; Dissolution rate; Dissolution parameters; Liquisolid compact; Neusilin UFL2
Introduction
Solubility and rate of drug molecule dissolution define a medication’s bioavailability, which in turn determines how effective it is as a therapeutic agent. Solubility plays a pivotal role in ensuring sufficient systemic availability of drug needed to elicit a therapeutic effect. As a result of their restricted solubility within the GI contents, poorly water-soluble drugs are inherently released slowly. For BCS Class II and IV drugs enhancing rate of solubilisation remains a major challenge, as drug absorption is largely governed by how quickly the drug dissolves. Superior dissolution profile, consequently leads to improved absorption and bioavailability. Abundant chemical entities which hold the potential to be valuable are never rendered available to the public owing to their inadequate oral bioavailability, particularly is caused by insufficient dissolution.1 Numerous techniques for increasing solubility have been developed in the past few decades, such as pharmaceutical dispersion, prodrug methodology, solubilisation using micelles, use of hydrophilic carriers for complexation, chemical modification, particle size reduction, drug-polyelectrolyte complexes and crystal modification.2-4
For increasing solubility and dissolution rates, the liquisolid compact technique (a powder solution approach) seems to be the most promising. The liquisolid compact approach has proven effective in modifying solubility attributes of drugs with poor aqueous solubility and thus, increasing drug’s rate of dissolution. To create a free-flowing, non-adherant compressible powder mixture, drug particles are initially dissolved or dispersed in non-volatile solvent which is then added to appropriate carrier and coating material component. Drug particles become trapped in the internal matrix of the excipients when they are combined with coating and carrier excipients, whether they are suspended or dissolved.5,6
Furthermore, many small-molecule drug candidates generated through chemical synthesis, biocatalysis, or other biotechnology processes are poorly water-soluble and lipophilic. Liquisolid compacts provide a simple, scalable, and cost-effective way to enhance their dissolution and bioavailability, making them suitable for early-stage formulation. For fine chemicals and secondary metabolites produced via biosynthetic routes, liquisolid systems allow effective oral formulation without relying on complex nanotechnologies. This approach is especially valuable for transitioning compounds from in-vitro testing to in-vivo animal studies.7,8
Dolutegravir (DTG), a very therapeutically effective inhibitor of HIV integrase strand transfer, is recommended as initial antiretroviral therapy line for HIV. Unification of viral DNA with host cell DNA is one of the key phases in the HIV lifecycle, is impeded by DTG, which also stops the virus from growing inside the host. DTG after oral administration is absorbed rapidly and extensively metabolised via glucuronidation by the phase II enzymes.9,10
Quality by Design (QbD), is a methodical framework for designing and developing of pharmaceutical drug products with predetermined goals offering improved comprehension of the product and associated processes with a little expenditure of time, money and efforts. QbD is applied before the optimization to find out Quality target product profile (QTPP), Critical Material Attributes (CMA), Critical Quality Attributes (CQA) and Critical Process Parameters (CPP), Design space and also involves Risk assessments (RA). An integral element of QbD is Design of Experiments (DoE) since it facilitates the establishment of a cause-and-effect link between independent and dependent attributes by changing two variables at a time.11 In contrast to conventional experimental design, which varies a single variable at a time, DoE allows data collection with fewer runs, changes two or more variables at a time and shows the interaction between two excipients by using contour plots.12 During process development, it is important to recognize the variations among CQAs (Dependent Variables) and CMAs (Independent Variables). Most common risk assessment tools, e.g., FMEA (Failure Mode and Effective Analysis) and Ishikawa fishbone diagrams, are utilized to assess the degree of qualitative risk related to raw material, design space and process variables which can have an impact on a particular CQA.13
This study was undertaken with the aim to formulate liquisolid powder admixture of Dolutegravir sodium with improved flowability and compressibility by combining wet granulation and liquisolid techniques, aiming to enhance its solubility and dissolution profile.
Materials and Methods
Materials
Dolutegravir Sodium was procured as a generous gift sample from Cipla, Mumbai. Capmul MCM C8 EP/NF (Abitec, Mumbai), Tween 20 (Croda, Mumbai), Magnesium aluminometasilicate (Neusilin UFL2, Neusilin US2; Gangwal Chemicals Pvt. Ltd., Mumbai), Dibasic calcium phosphate anhydrous (Fujicalin SG; Gangwal Chemicals, Mumbai) Colloidal silica (Aerosil 300, Aerosil 200; Evonik, Germany), Mesoporous silica (Parteck SLC 500; Merck, India), were obtained as gift and were used as received. Analytical grade chemicals and excipients were used throughout the study.
Selection of non-volatile solvent based on solubility study DTG:
An excess quantity of DTG was introduced into fixed volume non-volatile solvent to prepare saturated solution. The mixture was vortexed for 10 min to promote uniform dispersion of drug within vehicle. The non-volatile solvents selected were propylene glycol, Capmul MCM C8 EP/ NF, Capmul PG 8-70 NF, Labrasol, Transcutol HP, Tween 80, Tween 20, Capryol 90, PEG 4000, Captex 200P, Glycerin & Plurol Oleque CC497. To reach equilibrium, the solvent-drug mixtures were maintained at 25 oC in a shaker incubator overnight. The dispersions were centrifuged to separate undissolved drug as sediment at 3500 rpm for 15-20 min. The supernatants were diluted with methanol and analyzed for dissolved drug concentration by using UV-spectrophotometer (JASCO, V-630, Japan) at 264 nm.
Carrier material and coating material screening using optimal flowable liquid retention capacity:
The flowable liquid-retention potential (ϕ-number) represents the highest amount of liquid a powder can retain while still exhibiting acceptable flow properties. Furthermore, adequate compactibility refers to the ability of a powder to form uniform cylindrical tablets exhibiting compressive strengths in the range of 5–6 kg/cm², while preventing any occurrence of liquid expulsion during compression. Upon saturation of inner matrix with liquid comprising drug, any remaining liquid forms a layer on external surface of the powder material, this surplus liquid is absorbed through introducing “coating material,” yielding completely non-cohesive, free-flowing and compressible powder.
Flowable Liquid Retention Potential/Capacity (ФCa and ФC0), Excipient ratio (R or Ca/Co) and Liquid Load Factor (Lf) were calculated using a computational framework described by Spireas and coworkers.5,14 Briefly, the maximum liquid-holding capacity(Ф-value) of every excipient used (Neusilin US2, Neusilin UFL2, Parteck SLC, Avicel pH 102, Fujicalin SG, Aerosil 200, Aerosil 300) for the selected liquid system (Capmul MCM:Tween 20 in 1:1 ratio) wase assessed based on the angle of repose measurement.
Formulation and optimization of Dolutegravir loaded liquidsolid compacts (DTG)
The requisite amount of the DTG was added to Capmul MCM:Tween 20 mixture (1:1) as non-volatile co-solvent to form liquid medication. This prepared liquid medication was uniformly added to and distributed with the required amount of carrier placed and mixed in glass mortar-pestle for a minute at one rps (rotation per second) followed by addition of coating materials. The uniform layer of the liquid/powder admixture was distributed across the mortar surface and then permitted to stand for nearly five minutes, allowing the drug solution to permeate and become incorporated into the powder’s internal structure. The processed material is carefully collected and stored in dry place or in desiccators till further processing. The developed liquisolid compacts were evaluated for solubility and powder characteristics.
As per the Fishbone (Ishikawa) concept, critical quality attributes were identified for the development of liquisolid compact targeting enhancement of solubility and dissolution performance. Solubility, Q10 (percent of DTG release within 10 min), T50 (time to release 50 % drug) and Q60 (percent of drug release at 60 min) were selected as Critical Quality Attributes (CQAs). Effect of % drug loading (in non-volatile solvent) and Carrier:Coating Ratio (Ca:Co, R) as independent factors were evaluated on CQAs as dependent variables. Furthermore, risk assessment of independent factors was estimated using 32 factorial design (Table 1) through multiple regression analysis and 3D-surface response plots.
Table 1: 32 factorial design with coded levels and actual values for 2-factors at 3-levels with dependent variables with their expected outcomes.
| Factor (Independent Variables)X | Levels | ||||
| -1 | 0 | +1 | |||
| % Drug concentration (X1) | 10 % | 20 % | 30 % | ||
| Carrier : Coating ratio (X2) | 10:1 | 15:1 | 20:1 | ||
| Dependent variables (Y) | |||||
| Y1 | Solubility (mg/ml) | Maximum | |||
| Y2 | Q10: DTG release at 10 min (%) | Higher | |||
| Y3 | T50: Time required to release 50% DTG (min) | Minimum | |||
| Y4 | Q60: Amount of DTG release at 60 min (%) | Close to 100 % | |||
To convert liquisolid compact powder into tablet, excipients such as diluent, super-disintegrating agent, lubricant and glidant were added followed by evaluation for pre-compression parameters like angle of repose (θ), bulk density, tapped density, Carr’s index and Hausner’s ratio for determining the flow properties of the liquisolid compact. Further, the liquisolid crystal was formulated as a tablet and further evaluated for thickness, hardness, friability, weight variation test, disintegration test, contact angle measurement, wetting time and in-vitro dissolution study.
Saturation solubility of DTG- liquidolid compacts
Solubility of the developed DTG-loaded liquisolid compacts were assessed by shake-flask method.15,16 Briefly, to flask with 10 ml of water excess of formulation was added and shaken in incubator shaken at 37 oC to achieve equilibrium. Then, the mixture was centrifuged for 20 min at 3500 rpm and upper clear liquid after appropriate dilutions was analyzed as dissolved drug by UV-Visible spectrophotometer at 264 nm.
Scanning Electron Microscopy (SEM)
SEM is very useful in determining morphology and surface properties of liquisolid compact. Samples of pure DTG, physical mixture and DTG-liquisolid compact (DTG-3) were coated with a gold-palladium layer using sputter coater (VG. Microtech, UK) and monitored under SEM (Cambridge Instrument, Steroscan 120, UK) ran with an accelerated voltage of 10 kV.
Fourier Transform Infrared Spectroscopy (FTIR)
FTIR spectra of a pure DTG, dry physical mixture and optimized DTG-3 liquisolid compact were obtained to examine DTG and excipient chemical compatibility. Roughly five mg of sample was uniformly blended with 100 mg IR-grade KBr (potassium bromide) and compressed at 12,000 psi pressure for 3 min under vacuum to obtain a disk/pellet. This pellet was placed in sample holder of PerkinElmer IR spectrophotometer for spectral acquisition over the range of 4000–400 cm⁻1. 17
Differential Scanning Calorimetry (DSC)
DSC examinations were performed using a calibrated Shimadzu DSC-60 (Shimadzu, Kyoto, Japan) instrument. DSC thermograms of pure DTG, physical mixture and DTG-3 liquisolid preparations were obtained. Five miligrams of each sample material was enclosed in standard aluminium pans separately and were thermally scanned over the range of 25 oC–400 oC, with heating performed at 10 ∘C/min under nitrogen flow of 20 mL/min. Identical empty pans served as reference. 17
X-ray powder diffraction (XRPD)
The polymorphic features of a pharmaceutical can influence its dissolution rate, bioavailability, and overall therapeutic efficacy. As a result, studying the polymorphic properties of the drug in liquisolid formulations using XRD is crucial. X-ray diffractograms of pure DTG, physical mixture and DTG-3 liquisolid preparation were acquired through XRD instrument. With a voltage of 40 kV and an electric current of 30 mA, the scanning range was adjusted from 5 to 60° on 2θ scale at a rate of 5 degrees per minute. 17
In-vitro drug release study
The DTG dissolution from liquisolid tablets was analysed in relation to dissolution of the drug from Pure DTG tablets using a USP Type II paddle apparatus. The study employed 0.01 M phosphate buffer (900 ml, pH 6.8) with 0.25% w/v sodium dodecyl sulfate at 37 ± 0.5°C and stirred at 50 rpm.18 Five milliliter aliquots were taken at regular intervals of 15, 30, 45, and 60 minutes and replenished with an equal volume of fresh medium. These samples were filtered using a 0.45-micrometer filter and their absorbance measured at 264 nm with a UV–Visible spectrophotometer.
Results
Solubility in various non-volatile solvents
Figure 1a records saturation solubility data of DTG in several non-volatile solvents.
As depicted, in comparison to other non-volatile solvents evaluated, a solubility study revealed that DTG was highly soluble in Capmul MCM (25 mg/ml) (Figure 1a). In spite of Capmul MCM demonstrating higher solubility for DTG, a 1:1 combination of Capmul MCM and Tween 20 is used as non-volatile solvent.
Selection of Carrier (Ca; Q) and Coating (Co; q) material based on optimal flowable liquid-retention potential/capacity
Carrier materials are chosen for their large and porous particles, aimed at enhancing compressibility, while coating materials, selected for their fine and highly adsorptive nature, contribute to improved flowability.19
Each gram of Neusilin US2, Neusilin UFL2, Fujicalin SG, Avicel PH 102, Parteck SLC 500, Aerosil 200 and Aerosil 300 retained 1.053, 1.4742, 0.2106, 0.4212, 0.9477, 1.2636 and 1.5795 ml of Capmul MCM:Tween 20 combination (1:1), respectively while maintaining suitable flowing properties (Figure 1b). Neusilin UFL2 and Aerosil 300 were preferred as carrier and coating material due to their high liquid loading ability which is beneficial for holding more amount of liquid and in turn more drug.
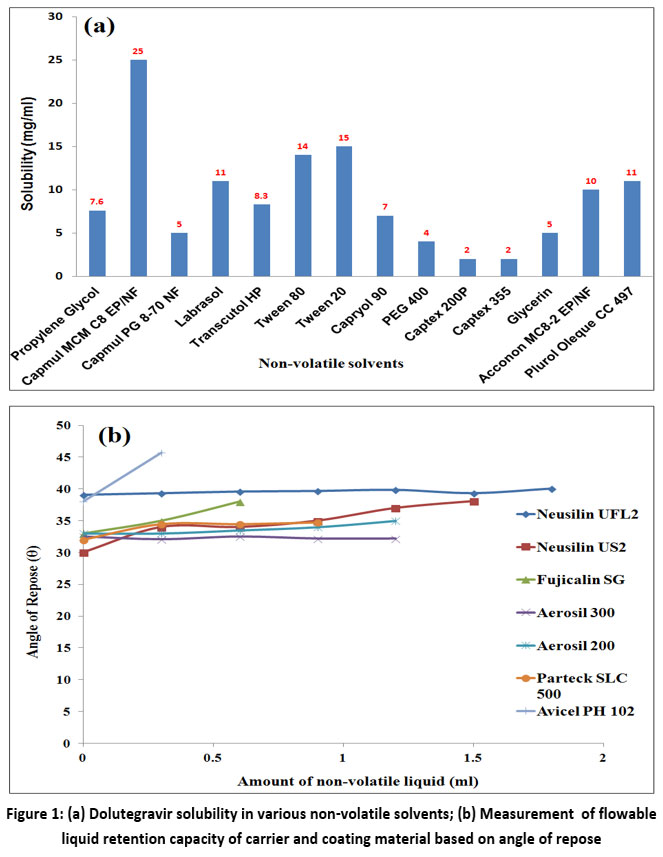 |
Figure 1: (a) Dolutegravir solubility in various non-volatile solvents; (b) Measurement of flowable liquid retention capacity of carrier and coating material based on angle of repose. |
DTG Liquisolid Compact optimization with 32 full-factorial design
Effect of DTG concentration in liquid vehicle (X1, %) and Neusilin UFL2:Aerosil 300 as Carrier:Coating (X2, Ca:Co) each at three levels studied using 32 full-factorial design. Statistical analysis of the performance of developed batches is done using Design Expert 13 (trial verion). Effect of drug concentration in Capmul MCM:Tween 20 (1:1) as non-volatile solvent is studied at 10, 20 and 30 % whereas Ca:Co ratio (R-value) investigated was 10:1, 15:1 and 20:1. Effect of selected independent variables is studied on solubility (mg/ml, Y1), amount of DTG release at 10 min (%, Y2), time required to release 50 % DTG (min, Y3) and amount of DTG release at 60 min (%, Y4). Various DTG liquisolid compact batches prepared using 10 mg of Dolutegravir and the responses obtained are depicted in Table 2 & 3, respectively. Table 4 depicts models, fit statistics and ANOVA for dependent variables obtained for developed DTG liquisolid compact batches.
Table 2: Dolutegravir liquisolid compact batches developed using 32 factorial design
| Batch No. | Capmul MCM : Tween 20 (mg) | X2: Drug Concentration Cd (%) | X2: Ca:Co Ratio (R) | Loading factor (Lf) | Neusilin UFL2 (Q) (mg) | Aerosil 300 (q) (mg) | Final weight (mg) | ||
| Coded | Actual | Coded | Actual | ||||||
| DTG-1 | 105 | -1 | 10 | -1 | 10:1 | 1.3899 | 75.54 | 7.554 | 188.09 |
| DTG-2 | 105 | -1 | 10 | 0 | 15:1 | 1.3478 | 77.9 | 5.193 | 188.09 |
| DTG-3 | 105 | -1 | 10 | 1 | 20:1 | 1.3267 | 79.14 | 3.957 | 188.09 |
| DTG-4 | 52.5 | 0 | 20 | -1 | 10:1 | 1.3899 | 37.77 | 3.777 | 94.05 |
| DTG-5 | 52.5 | 0 | 20 | 0 | 15:1 | 1.3478 | 38.95 | 2.596 | 94.05 |
| DTG-6 | 52.5 | 0 | 20 | 1 | 20:1 | 1.3267 | 39.57 | 1.9785 | 94.05 |
| DTG-7 | 35 | 1 | 30 | -1 | 10:1 | 1.3899 | 25.18 | 2.518 | 62.69 |
| DTG-8 | 35 | 1 | 30 | 0 | 15:1 | 1.3478 | 25.96 | 1.730 | 62.69 |
| DTG-9 | 35 | 1 | 30 | 1 | 20:1 | 1.3267 | 26.38 | 1.319 | 62.69 |
* All batches contained 10 mg of Dolutegravir
Table 3: Responses obtained for Solubility (Y1), Q10 (Y2), T50 (Y3) and Q60 (Y4)
| Batch no. | X1:Drug loading (%) | X2: RCa:Co ratio | Y1: Solubility (mg/ml) | Y2: Q10 (%) | Y3: T50(min) | Y3: Q60 (%) |
| DTG-1 | 10 | 10 | 0.91 | 24.52 | 27.62 | 98.47 |
| DTG-2 | 10 | 15 | 2.26 | 36.77 | 26.13 | 99.82 |
| DTG-3 | 10 | 20 | 2.92 | 45.17 | 21.09 | 101.78 |
| DTG-4 | 20 | 10 | 1.13 | 28.08 | 28.02 | 94.29 |
| DTG-5 | 20 | 15 | 2.54 | 36.47 | 26.08 | 96.82 |
| DTG-6 | 20 | 20 | 2.83 | 51.22 | 22.22 | 97.41 |
| DTG-7 | 30 | 10 | 0.655 | 27.93 | 28.28 | 91.80 |
| DTG-8 | 30 | 15 | 1.638 | 34.34 | 28.99 | 92.47 |
| DTG-9 | 30 | 20 | 1.823 | 49.17 | 24.2 | 93.08 |
Q10: Percent of drug release within 10min; T50: Time to release 50% drug; Q60: Percent of drug release at 60min
Effect on Solubility (Y1)
The solubility of Pure DTG, as measured experimentally was 0.10 mg/ml. For all the nine factorial batches solubility varied in the range of 0.655 to 2.92 mg/mL with mean solubility of 2.46 mg/mL (Table 3). All liquisolid batches demonstrated higher solubility when compared with pure drug solubility in water, minimum 6.55-times increase in solubility was observed. The responses obtained are subjected to statistical analysis using Design Expert ver. 13 (trial verion) software to assess the influence of each independent variable on selected outcomes and are reported in Figure 2a as 3D surface response graphs. Based on solubility, DTG-3 batch was further selected for development of final tablet and evaluation.
Effect on amount of DTG release at the end of 10 min (Q10, Y2)
Q10 is the amount of DTG released at the end of 10min which is required to attain requisite plasma concentration of drug. The Q10 for DTG liquisolid tablets were observed in the range of 24.52 to 51.22 % with average of 37.06 % drug released (Table 3).
Effect on time required for 50 % DTG release (T50, Y3)
The T50 for the DTG liquisolid compressed tablets were found in the range of 21.09 to 28.99 min with average T50 value of 26.66 min (Table 3). Faster drug release is reflected from lower T50 values. The DoE shows that valid quadratic model was best fitted for dependent response Y3 with p-value of <0.0084, R2 of 0.9815 and predicted R2 of 0.8320 were in logical agreement.
Effect on amount of drug release at the end of 60 min (Q60, Y4)
The Q60 values were found to be in the range of 91.08 to 101.78 % with average release of 96.22 % for all factorial DTG LC tablets (Table 3). The DOE shows that linear model was best fitted for dependent response Y4 with model p-value of <0.0001 demonstrating significant effect of selected variables on Q60 (R2=0.9800 and adjusted R2=0.9734).
Solid-state characterization
Scanning Electron Microscopy (SEM)
The surface morphology and texture of the liquisolid compact were examined using SEM. Figure 3A showed that DTG possessed a high degree of crystallinity characterized by multiple planar surfaces. The drug crystals exhibited heterogeneous size and shape, predominantly cuboidal and rod-shaped forms. In contrast, SEM images of the liquisolid system indicated the total loss of DTG crystals, suggesting that the drug was uniformly and completely dispersed within the liquisolid matrix.
Fourier Transform Infrared Spectroscopy (FTIR)
The FTIR spectrum of DTG (Figure 3B) revealed characteristic peaks at 3068 cm⁻¹ and 3047 cm⁻¹ for N-H stretching; at 2918 cm⁻¹ and 2874 cm⁻¹ corresponding to C–H stretching, along with a prominent peak at 1641 cm⁻¹ indicating C=O stretching vibrations, along with a peak at 1592 for aromatic C=C and N-H bending. Additional peaks were also observed at 1362 cm⁻¹ (aliphatic C–H bending), 1101 cm⁻¹ (C–O–C stretching), and 854 cm⁻¹ (C=O bending). FTIR spectrum for DTG showed well-defined characteristic multiple peaks between 1600-1000 similar to any ordered crystalline organic drug. Peaks at wave numbers of 3445 cm⁻¹ for adsorbed water, intense peak near 1000 cm-1 for Si-O from Neusilin UFL2 and/or Aerosil 30 were observed in FTIR spectrum for physical mixture. Other DTG characteristic peaks were still visible but with lowered intensity. FTIR spectrum for DTG-3 showed further weakened or broadened bands compared to physical mixture. The O–H/N–H region at 3430 cm⁻¹ is broader which indicates stronger hydrogen-bonding or interaction with surface silanols of Neusilin/Aerosil. Also, fingerprint peaks of DTG in the 1200–1600 cm⁻¹ region are attenuated or merged, and the silica band (~1100 cm⁻¹) becomes proportionally more prominent.
Differential Scanning Calorimetry (DSC)
Figure 3C shows the thermal behavior of unprocessed DTG, which exhibited a prominent fusion endotherm at 351 °C with heat of fusion (ΔH) of 32.9mJ/g reflecting its melting transition for crystalline DTG. DSC thermogram of the physical mixture similarly displayed clear thermal melting event of DTG at 358.8 °C (ΔH= 9.73mJ/g), with no significant shift or change in peak intensity, indicating that simple blending with Neusilin UFL2 and Aerosil 300 did not alter crystallinity of the drug. Conversely, DTG-3 liquisolid formulation showed the total loss of characteristic melting peak, demonstrating complete solubilization, uniform molecular dispersion within the liquisolid matrix and possibly conversion into amorphous form. Additionally, two peaks were observed in physical mixture and DTG-3 liquisolid compact. Peaks at 53.0 °C (ΔH=5.46 J/mg) and at 213.3 °C (ΔH=8.49 J/mg) were observed in physical mixture whereas as in DTG-3 liquisolid compact, endotherms at 62.4 °C (ΔH=4.70 J/mg) and 247.3 °C (ΔH=6.08 J/mg) were noticed.
Powder X-ray diffraction analysis (PXRD)
The XRPD analysis presented in Figure 3D illustrates the physical state of DTG before and after incorporation into the liquisolid system. Pure DTG exhibited multiple sharp and intense diffraction peaks between 10–40° 2θ, with prominent reflections at 11.88°, 14.08°, 15.39°, 16.59°, 17.81°, 18.76°, 19.41°, 21.99°, 25.95°, 28.15°, and 30.13°, confirming crystalline nature of DTG. The XRPD pattern of the physical mixture retained these characteristic peaks, indicating the continued presence of crystalline DTG and showing that simple mixing with Neusilin UFL2 and Aerosil 300 did not alter the drug’s crystallinity. In contrast, the XRPD diffractogram of the DTG-3 liquisolid formulation displayed a complete disappearance of the distinct DTG diffraction peaks and showed a diffuse halo pattern characteristic of an amorphous phase.
Development of DTG-liquisolid compact tablets
To the liquisolid compact admixture microcrystalline cellulose (diluents), lactose (diluents), sodium starch glycolate (superdisintegrant) and magnesium stearate (lubricant) were added followed by direct compression to obtain tablets. This liquisolid powder blend for each formulation was analyzed for precompression parameters including the angle of repose, bulk density, true density, Carr’s index, Hausner’s ratio, and drug content.
The angle of repose reflects cohesion or internal friction among the particles; a low value indicates non-cohesive powder, while a high value signifies cohesive powder. The prepared formulations exhibited angles of repose ranging from approximately 26° to 28°, indicating good and acceptable flow properties of liquisolid powder.
The powder bulk density and tapped density was observed to be 0.3797g/ml to 0.569g/ml and 0.461g/ml to 0.716g/ml, respectively. The Carr’s index (CI), or the ratio of bulk density to tapped density analyzes the flow characteristics and compressibility of liquisolid formulations which ranged from 13.53% to 20.53%. Additionally, the Hausner’s ratio for all formulations varied from 1.156 to 1.258, further indicating favorable flow characteristics of the powder blend.
Drug content
The drug content (%) of all formulations ranged from 95.75% to 98.69%, confirming uniformity in drug distribution. These findings demonstrated that all formulations met the specified acceptance criteria according to the IP standards; (Limit: not less than 85 % and not more than 115 %).
Post-compression characterization of liquisolid tablets
All liquisolid tablets were white, biconvex with uniform round shape and thickness varied from 2.45 to 5.2 mm. The weight variation analysis ensures the uniformity of tablet and the observations of weight variation show that the developed tablets comply with the IP limits.
To ensure fast and constant drug release which assures optimum bioavailability and therapeutic efficacy, rapid disintegration is necessary for immediate release formulation. The disintegration times of all the liquisolid tablets ranged from 1 min to 7 min 15 sec.
Wetting time and Contact angle measurement
The internal structures of the tablet influence its wetting behavior, while the water attracting property powder excipients as well impacts wetting time. The wetting time of DTG-3 liquisolid tablet was reduced by half time (2 min 36 sec) relative to the conventional tablet (4 min 30 sec) containing pure DTG (Figures 4A). Measurement of contact angle were performed on liquisolid and conventional tablets using saturated solution of drug in distilled water (Figures 4B).5 The contact angle of liquisolid tablet (12.28 ±0.35 o) was found to be significantly less than conventional tablet (29.36 ±0.48 o) (p<0.001).
In-vitro drug release study
All liquisolid tablet formulations (DTG-1 to DTG-9) showed improved dissolution profiles compared with pure DTG, as illustrated in Figure 5. Among them, DTG-3 demonstrated the highest drug release, reaching 101.78% within 60 minutes, while the pure DTG tablet released only 41.90% in the same time frame.
A decrease in solubilisation rate was observed as the drug concentration in Capmul MCM:Tween 20 mixture increased. Additionally, R-value modified dissolution behavior. Formulation DTG-3, with a higher R-value of 20:1, achieved 101.78% drug release at 1 hour, whereas DTG-7, with an R-value of 10:1, showed lower release (91.79%).
For DTG-3, the MDT, MDR, and DE values were 20.60 min, 0.39 %/min, and 65.66%, respectively. In contrast, the pure DTG tablet exhibited an MDT of 26.77 min, an MDR of 0.16 %/min, and a DE of 55.38%. These results confirm the markedly enhanced dissolution behavior of DTG-3.
Discussion
Drug solubility in non-volatile solvent is a crucial component for liquisolid approaches. Greater solubility of the drug in the liquid vehicle can improve its dissolution rate, as it allows for greater molecular distribution of the drug and a higher surface area available for interaction with dissolution medium. A higher fraction of molecularly dispersed drug results in faster dissolution rate. Capmul MCM (Glyceryl Monocaprylate) is medium chain mono- and diglycerides and most commonly used as carrier, solubilizers and emulsifiers with hydrophilic lipophilic balance of 4.7.19,20 It is used to produce stable emulsions, to modify viscosity, as a penetration enhancer and to enhance bioavailability.21 Initial liquisolid compact batches were developed using Capmul MCM as a non-volatile solvent. However, saturation solubility of those liquisolids in water revealed that all the prepared formulations resulted into solubility less than solubility of pure DTG in water. This observation could be attributed to highest solubility of DTG in Capmul MCM failed to release the drug in water. Also, Capmul MCM being highly viscous compared to water failed to form uniform dispersion with water.
Further, Tween 20 (Polyoxyethylene sorbitan monolaurate), hydrophilic non-ionic surfactant with HLB of 16.7, used in pharmaceuticals as solubilizer and o/w emulsifier demonstrated the second highest solubility of DTG (15 mg/ml).22 The weight of tablet and drug dissolving characteristics are significantly influenced by drug’s solubility in a non-volatile solvent. Higher solubility of the drug in non-volatile vehicles selected leads to requirement of smaller quantities of carrier and coating materials, ultimately enabling the attainment of a lower tablet weight.23 Hence, if liquisolid batches were formulated solely with Tween 20 as solvent, it would have led to an increase in tablet weight. To avoid this outcome, a blend of Capmul MCM and Tween 20 (1:1) was employed in the study. Furthermore, Capmul acts as a lipophilic solvent with strong ability to dissolve poorly water-soluble drug due to its amphiphilic glyceride structure whereas Tween 20 provides hydrophilic surfactant action, enhancing drug wettability and facilitating micellar solubilisation.
Carrier (Ca; Q) material and Coating (Co; q) material selection based on optimal flowable liquid-retention potential
The most appropriate carrier and coating material are mainly determined by their flowable liquid retention capacity (Φ). The excipients’ Φ-value, required to compute Lf, is derived using the angle of repose. The carrier material ΦCA-value and coating material ΦCO-value determines the optimum amounts of carrier and coating materials critical to transform a particular volume of liquid drug into a dry, free flowing and readily compressible liquisolid preparation.14
As a carrier, Neusilin UFL2 has greater absorption capacity as it is available in powder form than Neusilin US2 which is in granular form and other carriers. Furthermore, Aerosil 300 has more absorption capacity than Aerosil 200 and therefore selected as coating. Neusilin® is a synthetic, amorphous magnesium aluminometasilicate. This multifunctional excipient finds application both in direct compression and wet granulation techniques for the preparation of solid oral dosage forms. It is majorly employed to improve the performance attributes of powders, granules, tablets and capsules. Neusilin® has been an integral part of the pharmaceutical industry in Japan for over fifty years, featured in more than 500 pharmaceutical preparations. Globally recognized by formulators, it is used in formulations that include water-insoluble APIs including antibiotics, oily actives, herbal ingredients and vitamins. Additionally, Neusilin® serves as an effective adsorbent for self-micro emulsifying and solid dispersion drug delivery systems. To obtain smaller tablets of liquisolid compacts, high Φ -value for carrier and coating material are prerequisite. These values are employed during the formulation of DTG liquisolid tablets.21,24
In the presented work using Capmul MCM:Tween 20 as non-volatile solvent, Neusilin UFL2 and Aerosil 300 were selected as carrier (Q) and coating (q) material, respectively. Neusilin UFL2 and Aerosil 300 despite infusing 1.8 ml and 1.5 ml of non-volatile solvent, respectively could maintain favorable flow characteristics. Neusilin UFL2 showed great potential to load the non-volatile solvent while maintaining good flow properties and helped to reduce the total tablet weight.
Optimization of DTG Liquisolid Compact using 32 full-factorial design
Influence on Solubility (Y1)
Solubility and dissolution are the critical factors for Biopharmaceutics Classification System (BCS) Class II and IV drugs in limiting bioavailability. Since BCS II drugs exhibit low solubility but high permeability, their absorption is primarily constrained by their dissolution in gastrointestinal fluids whereas bioavailability of BCS IV is minimal due to both solubility and permeability. Enhancing both solubility and dissolution rates augments the drug amount reaching the absorption site, thereby improving systemic bioavailability and therapeutic outcomes.
As depicted, effect of selected independent variables fits quadratic model for solubility with p-value of 0.0042 suggesting valid model. The quadratic regression model demonstrated remarkable predictability, as indicated by R2 value of 0.9962 and predicted R2 of 0.9667 (Table 4).
Table 4: Model, Fit statistics and ANOVA for dependent variables
| Dependent variables | Model and p-value | R2 | Adjusted R2 | Predicted R2 | Model terms | Coefficient | p-value |
| Y1: Solubility(mg/ml) | Quadratic0.0042 | 0.9962 | 0.9898 | 0.9667 | Intercept | 2.46 | 0.0008 |
| X1 | – 0.3298 | 0.0025 | |||||
| X2 | + 0.8148 | 0.0002 | |||||
| X1X2 | – 0.2110 | 0.0156 | |||||
| X12 | – 0.4645 | 0.0045 | |||||
| X22 | – 0.4345 | 0.0054 | |||||
| Y2:Q10 (%) | Linear<0.0001 | 0.9548 | 0.9398 | 0.9038 | Intercept | 37.06 | <0.0001 |
| X1 | + 0.8467 | 0.4135 | |||||
| X2 | + 10.82 | <0.0001 | |||||
| Y3:T50 (min) | Quadratic0.0084 | 0.9815 | 0.9507 | 0.8320 | Intercept | 26.66 | 0.0084 |
| X1 | + 1.11 | 0.0222 | |||||
| X2 | – 2.73 | 0.0017 | |||||
| X1X2 | + 0.6125 | 0.1426 | |||||
| X12 | + 0.6177 | 0.2572 | |||||
| X22 | – 1.83 | 0.0251 | |||||
| Y4:Q60 (%) | Linear<0.0001 | 0.9800 | 0.9734 | 0.9488 | Intercept | 96.22 | <0.0001 |
| X1 | – 3.79 | <0.0001 | |||||
| X2 | + 1.29 | 0.0015 |
The negative sign for the coefficients of X1 (main effect), X1X2 (interaction effect), X12 and X22 (quadratic effects) shows the significant negative effect on solubility while X2 (main effects) shows significant positive effect on solubility (p<0.05). As the concentration of drug (X1) is increased, solubility is decreased because the relative amount of solvent available to solubilize each drug molecule decreases which reduces the overall solubilisation efficiency of the system. As the Ca:Co ratio (X2) is increased surface area available for drug to be adsorbed increased allowing better interaction among DTG and dissolution medium facilitating augmented and faster wetting of particles at higher Neusilin UFL2:Aerosil 300 ratios (R values) resulting in higher solubility. Improvement in the drug’s solubility due to enhanced wettability also resulted in higher dissolution rate.
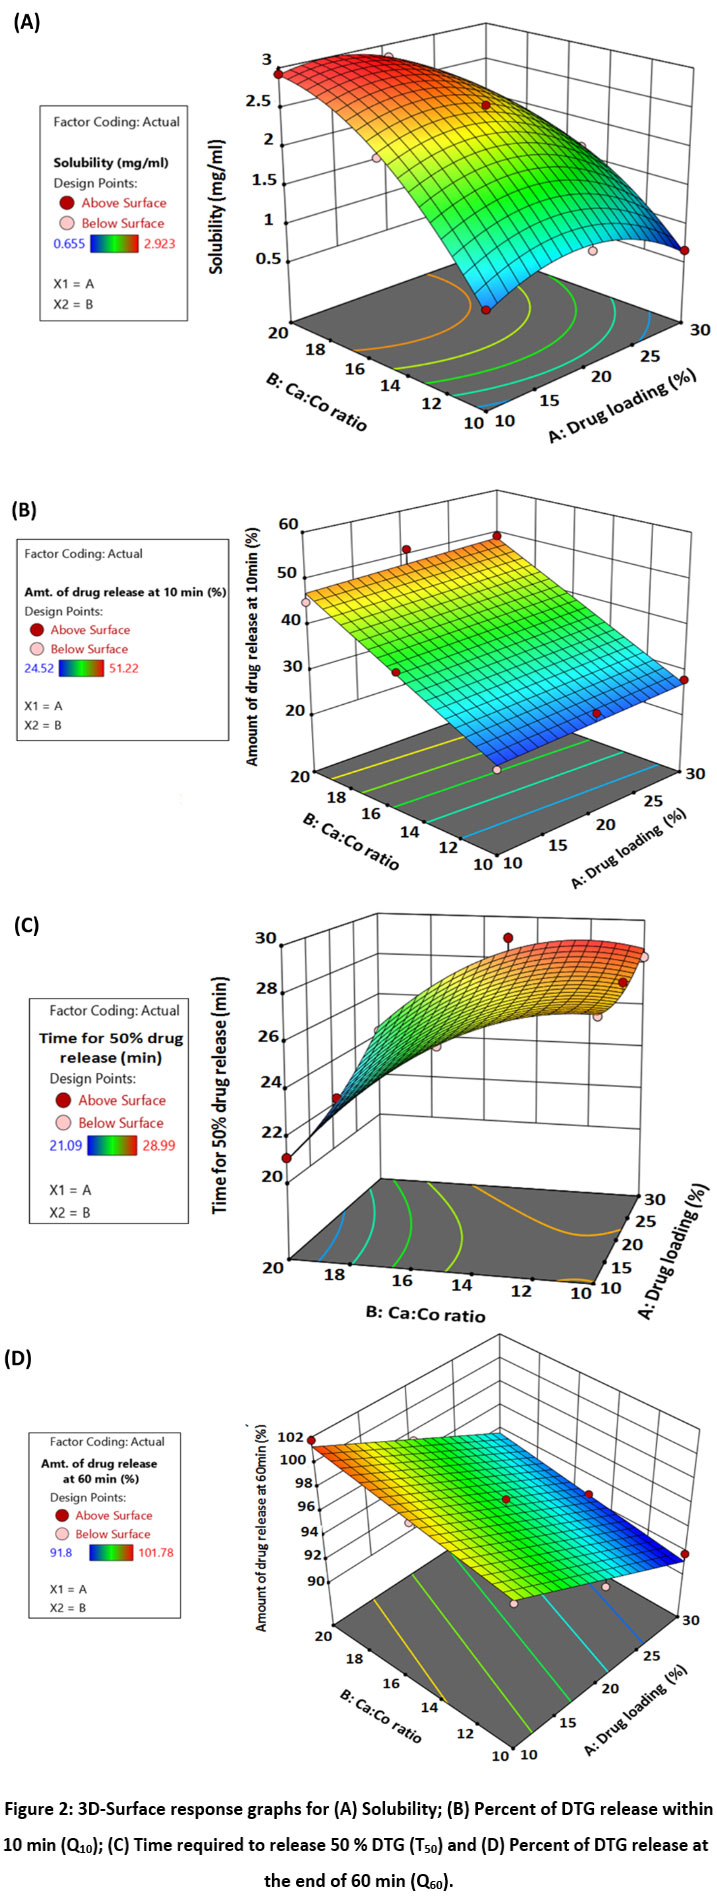 |
Figure 2: 3D-Surface response graphs for (A) Solubility; (B) Percent of DTG release within 10 min (Q10); (C) Time required to release 50 % DTG (T50) and (D) Percent of DTG release at the end of 60 min (Q60). |
Effect on amount of drug release at the end of 10 min (Q10, Y2)
Effect of selected independent variables on Q10 follows linear model with p value of <0.0001, R2 value of 0.9548 and predicted R2 of 0.9038 suggesting excellent predictability. As seen in Table 4 and Figure 2b, positive effect of X1 on Q10 is insignificant (p>0.05) whereas X2 depicted significant effect (p<0.05). As DTG loading in non-volatile solvent increases, drug release in initial 10 min was higher resulting in higher and faster drug release. The positive effect of X1 can be correlated to amount of super-disintegrating agent, sodium starch glycolate (SSG) added and disintegrating time (DT, data not given). Each liquisolid tablet batch contain fix concentration of SSG (5 %), however, the amount of SSG varied. Batch with 30 % drug loading, liquisolid system required less Neusilin UFL2 and Aerosil 300 to convert liquid drug solution into free-flowing dry powder form compared to 10 % and 20 % drug loading. This ultimately increases the amount of SSG in that batch leading to faster disintegration.
Similarly, as Ca:Co ratio increased, Q10 also increased which could be arising from higher surface area available for DTG dissolution and improved wetting properties demonstrating significantly higher drug release at Q10. A close similarity was found in Q10 studies carried out by Fahmy and Kassem25, describing superior amounts of drug dissolution achieved in initial 10 min from Famotidine liquisolid compressed tablets than the conventional directly compressed Famotidine tablets.
Effect on time required for 50% drug release (T50, Y3)
As depicted in Table 4 and surface response graph (Figure 2c), the positive coefficients of terms X1, X1X2, X12 depicts positive effect on T50, however, X1X2 and X12 effect was non-significant (p>0.05). The significant negative coefficient for X2, X22 depicts the favorable decreasing effect on T50. An increase in T₅₀ value with increase in % drug loading can be correlated to decreasing effect on solubility as explained earlier. Moreover, the dissolution process slowed down at the saturation point and may result in drug precipitation from the system. Increase in surface area, and wettability led to decrease in t50 when Ca:Co ratio was increased. The greater surface area and wettability facilitate a faster interaction with the dissolution medium, resulting in greater dissolution rate and thus reduced T₅₀.
Effect on amount of drug release at the end of 60min (Q60, Y4)
As depicted in Table 4, X1 and X2 demonstrated significant negative (p<0.0001) and positive impact (p=0.0015) on Q60, respectively. Decreasing effect of drug loading can be correlated with its negative effect of it on solubility, resulting in Q60 values. Similarly, positive effect of Ca:Co ratio on Q60 can be explained with the help of its positive effect on solubility (Figure 2d). Increasing the Ca:Co ratio enhanced drug dissolution by improving dispersion and wetting properties, reducing agglomeration, and increasing porosity. The greater availability of carrier material, drug was dispersed molecularly better, exposing a larger surface area to the dissolution medium. This improved wetting and reduced clumping, combined with a more porous structure, allow for faster and more efficient drug dissolution.
Solid-state characterization:
Scanning Electron Microscopy (SEM)
The absence of visible DTG crystals in the liquisolid compact confirms that the drug transitioned from its crystalline form to a molecularly dispersed or amorphous state within the carrier system. Such transformation is known to enhance the surface area available for dissolution and promote improved wettability. Consequently, the molecular dispersion of DTG in the liquisolid system is likely responsible for the notable increase in its solubility and dissolution rate, ultimately contributing to enhanced biopharmaceutical performance.
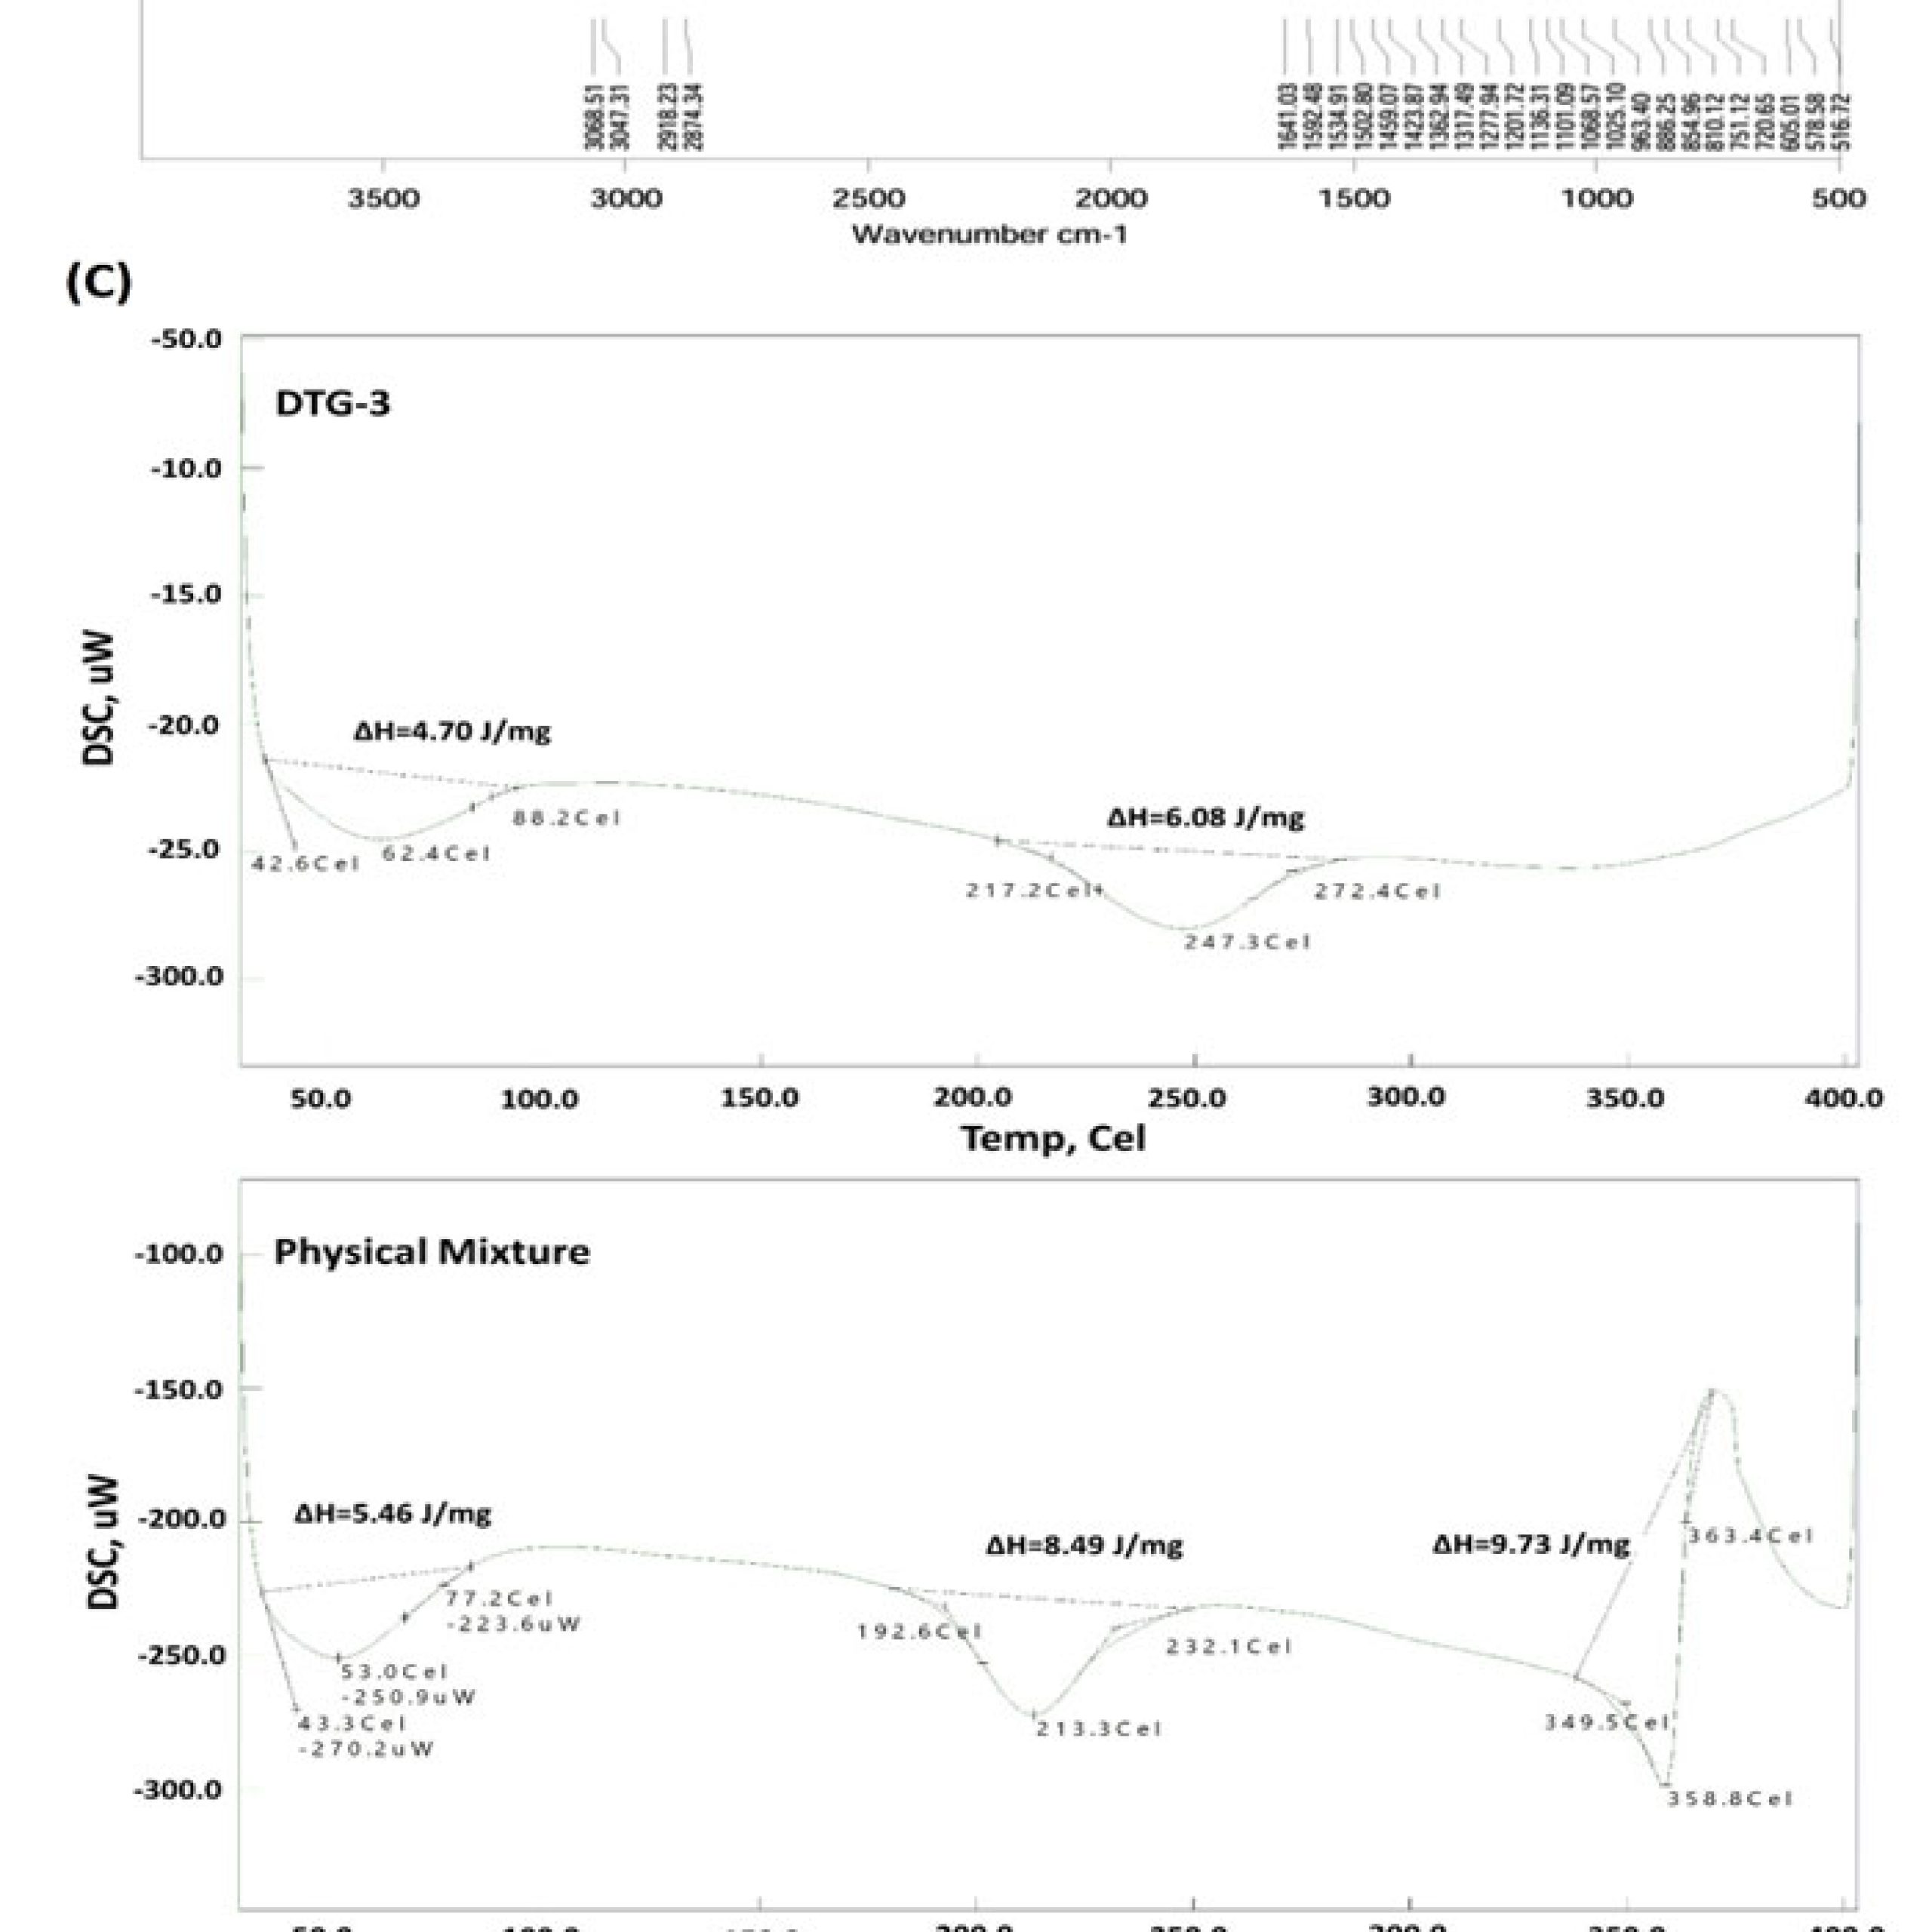 |
Figure 3: (A) Scanning Electron Microscopy (SEM); (B) Fourier Transform Infrared Spectroscopy (FTIR); (C) Differential Scanning Calorimetry (DSC) |
Fourier Transform Infrared Spectroscopy (FTIR)
Preservation of the major DTG peaks in both the physical mixture and DTG-3 liquisolid formulation indicates that no chemical interactions occur between the drug and the excipients
Lack of peak shifts, broadening, or new functional group signatures suggests that DTG remains chemically stable within the liquisolid matrix. Decreased intensity and band broadening especially in O–H/N–H and fingerprint regions point to hydrogen bonding and adsorption of DTG onto Neusilin/Aerosil surfaces with loss of long-range order. This indicates that the formulation process did not induce any structural modifications in the drug, supporting its compatibility with the selected excipients.
Differential Scanning Calorimetry (DSC)
As depicted in Figure 3C, distinct thermal event suggests that DTG existed in a well-ordered solid form with crystalline characteristics. The unchanged melting endotherm in the physical mixture confirms the absence of drug–excipient interactions during simple blending, indicating that the porous carriers did not adsorb or entrap the drug in its crystalline solid state. However, the complete loss of the DTG melting peak in the liquisolid system signifies a transition of DTG into an amorphous or molecularly dispersed form. This transformation is consistent with enhanced wetting and larger surface-area exposure of DTG, which collectively contribute to the improved dissolution performance observed in the liquisolid formulation.
Appearance of additional peaks at 53.0 oC and 62.4 oC in physical mixture and DTG-3, respectively indicated desorption of adsorbed moisture. Borad endotherms at lower temperatures of 213.3 oC (physical mixture) and 247.3 oC (DTG-3) can be attributed tofusion of amorphous fraction of DTG.
Powder X-ray diffraction analysis (PXRD)
The preservation of DTG’s sharp diffraction peaks in the physical mixture confirms that blending with the amorphous carriers alone is insufficient to cause drug adsorption or entrapment within their porous structures. However, the transition to a halo pattern in the liquisolid formulation clearly indicates that DTG is converted from a crystalline to an amorphous or molecularly dispersed form. This transformation likely results from solubilisation of DTG in the non-volatile solvent, followed by absorption and adsorption onto the porous network of Neusilin UFL2 and Aerosil 300. Such amorphization and molecular dispersion increase the drug’s surface availability, which likely contributes to enhanced dissolution rate observed in liquisolid system.
Development of DTG-liquisolid compact tablets
The angle of repose values within 26°–28° suggest that the liquisolid powder mixtures exhibited low interparticle friction and satisfactory flow behavior, suitable for direct compression. The moderate bulk and tapped density values imply adequate packing ability of the powder blends. Carr’s index (<21%) and Hausner’s ratio (between 1.1 and 1.25) further confirm good compressibility and flow properties, indicating that the incorporation of excipients such as microcrystalline cellulose and lactose effectively supported the handling and processing of the liquisolid powders. These pre-compression characteristics collectively demonstrate that the formulations possessed the necessary flow and packing attributes required for successful tablet manufacturing.
Post-compression characterization of liquisolid tablets
Hardness and friability result demonstrates sufficient tablet robustness and adequate tolerance to mechanical stress during handling, packaging, and transportation.
As disintegration time values did not exceed 15 min, this confirms that the formulations complied with the disintegration criteria outlined by the Indian Pharmacopoeia.
Wetting time and Contact angle measurement
Significant reduction in wetting time can be attributed to dispersion of DTG in the water-miscible vehicle which also acts as cosolvent resulting in enhanced wetting properties of drug. Furthermore, the drug concentrate is evenly distributed and adsorbed onto the surface of coating material leading to tremendous increase in surface area which contributes to enhanced wetting ability of developed tablet. Conventional tablets have limited surface area as hydrophobic drug particles are merely mixed with the tablet excipients.26
The low contact angle obtained can be attributed to present of the surfactants, Capmul MCM and Tween 20 in the system which expedites drug particles wetting by minimising surface tension between wetting liquid and tablet surface.27
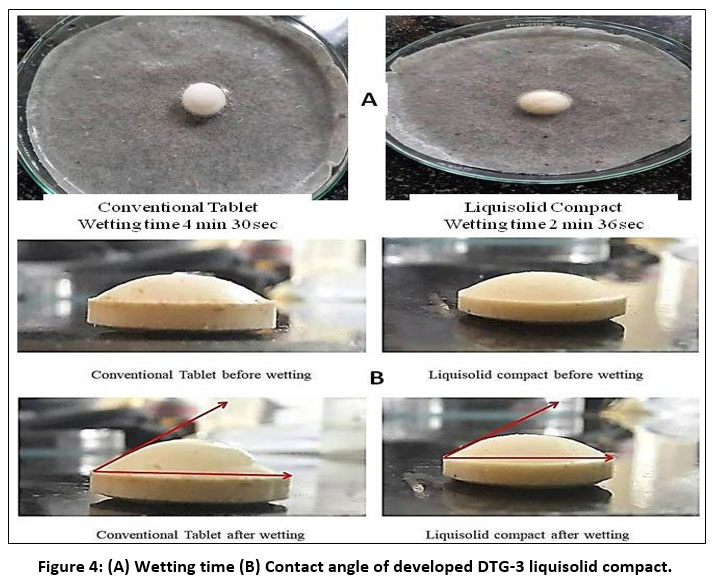 |
Figure 4: (A) Wetting time (B) Contact angle of developed DTG-3 liquisolid compact. |
In-vitro drug release study
The enhanced dissolution behaviour of the liquisolid system is due to molecular-level dispersion of DTG in the non-volatile solvent system, which enhances drug wettability and increases surface availability for dissolution. Higher drug concentrations in the liquid vehicle may reduce the proportion of molecularly dispersed drug, lowering dissolution efficiency.
The influence of R-value implies that increasing amount of carrier relative to the coating material improves drug release by enhancing adsorption efficiency and providing larger porous surfaces for rapid solvent penetration. The enhanced release observed for DTG-3 suggests that an optimal excipient ratio promotes faster diffusion of the solubilized drug from the carrier particles, ultimately improving dissolution compared with both lower R-value formulations and the pure drug tablet.
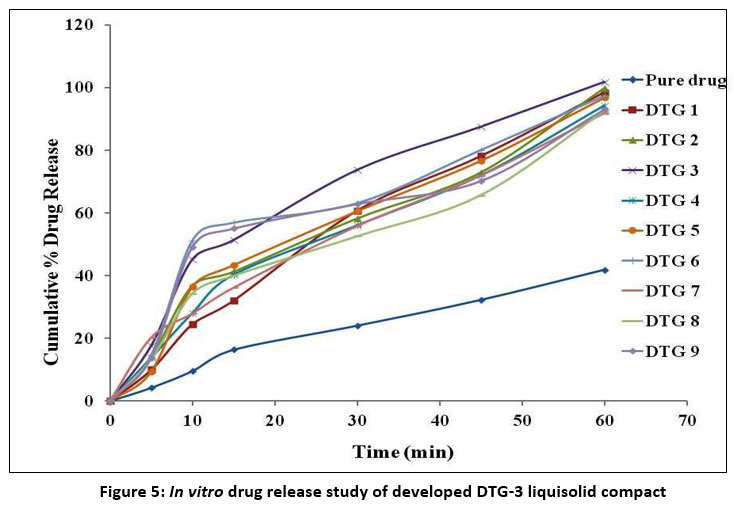 |
Figure 5: In vitro drug release study of developed DTG-3 liquisolid compact. |
The reduced MDT and increased MDR of the liquisolid formulation indicate a faster dissolution process, attributable to improved wettability and increased surface area resulting from molecular dispersion of DTG in the liquid vehicle. The higher DE value further highlights the efficient release of drug into the dissolution medium. Collectively, these parameters demonstrate that the liquisolid technique significantly enhances solubility-driven dissolution performance compared with the conventional tablet.
Conclusion
The study successfully developed and evaluated a liquisolid compact of DTG using a Capmul MCM C8 EP/NF:Tween 20 (1:1) as liquid vehicle, significantly enhancing the drug’s solubility and dissolution rate. With a 10% drug concentration and a 20:1 ratio of Neusilin UFL2 to Aerosil 300, the formulation achieved a 17.47-fold increase in solubility and a 101.78 % drug release within 60 minutes. This demonstrates that the liquisolid technique effectively improves the solubility, dissolution rate of APIs with limited aqueous solubility like Dolutegravir through enhanced wetting properties and molecular dispersion, making it a promising method for solubility enhancement.
Acknowledgment
Authors would like to thank Cipla, Abitech, Croda and Gangwal Chemicals Pvt. Ltd., Mumbai for providing generous gift samples of Dolutegravir sodium, non-volatile solvents and Neusilin for academic research.
Funding Sources
The author(s) received no financial support for the research, authorship, and/or publication of this article.
Conflict of Interest
The authors do not have any conflict of interest.
Data Availability Statement
This statement does not apply to this article.
Ethics Statement
This research did not involve human participants, animal subjects, or any material that requires ethical approval.
Informed Consent Statement
This study did not involve human participants, and therefore, informed consent was not required.
Clinical Trial Registration
This research does not involve any clinical trials.
Permission to reproduce material from other sources
Not Applicable
Author Contributions
Arpana Patil: Conceptualization, Visualization, Supervision, Project Administration
Mayuri Nazirkar: Writing – Review & Editing, Supervision
Kiran Thorat: Data Collection, Analysis, Writing-Original Draft
Ubed Kothali: Writing – Review & Editing
References
- Stielow M, Witczyńska A, Kubryń N, Fijałkowski Ł, Nowaczyk J, Nowaczyk A. The bioavailability of drugs-the current state of knowledge. Molecules. 2023;28:8038. http://doi.org/10.3390/molecules28248038.
CrossRef - Bhalani DV, Nutan B, Kumar A, Singh Chandel AK. Bioavailability enhancement techniques for poorly aqueous soluble drugs and therapeutics. Biomedicines. 2022;10:2055. https://www.mdpi.com/2227-9059/10/9/2055.
CrossRef - Wong SM, Kellaway IW, Murdan S. Enhancement of the dissolution rate and oral absorption of a poorly water soluble drug by formation of surfactant-containing microparticles. Int J Pharm. 2006;317(1):61-68. https://doi.org/10.1016/j.ijpharm.2006.03.001.
CrossRef - Talele S, Kajale P, Bhil S, Patil R, Gaikwad A, Borse L. Formulation of drug-polyelectrolyte complex for enhancement of solubility of Hydrochlorthiazide. Biotech Res Asia. 2023;20(4);1291-1302. http://dx.doi.org/10.13005/bbra/3176.
CrossRef - Spireas S, Bolton SM. Liquisolid systems and methods of preparing same., United Staes Patent US5800834A, 1998.
- Hussain Y, Cui J, Dormocara A, Khan H. The most recent advances in liquisolid technology: Perspectives in the pharmaceutical industry. Pharma Sci Adv. 2024;2:100038. https://doi.org/10.1016/j.pscia.2024.100038.
CrossRef - Wu K, Kwon SH, Zhou X, et al. Overcoming challenges in small-molecule drug bioavailability: a review of key factors and approaches. Int J Mol Sci. 2024;25(23):13121. https://doi.org/10.3390/ijms252313121.
CrossRef - Simić S, Zukić E, Schmermund L, Faber K, Winkler CK, Kroutil W. Shortening synthetic routes to small molecule active pharmaceutical ingredients employing biocatalytic methods. Chem Rev. 2022;122(1):1052-1126. https://doi.org/10.1021/acs.chemrev.1c00574.
CrossRef - Kandel C, Walmsley S. Dolutegravir; a review of the pharmacology, efficacy, and safety in the treatment of HIV. Drug Des Devel Ther. 2015;9:3547-3555. https://doi.org/10.2147/DDDT.S84850.
CrossRef - Katlama C, Murphy R. Dolutegravir for the treatment of HIV. Expert Opin Investig Drugs. 2012;21(4):523-530. https://doi.org/10.1517/13543784.2012.661713.
CrossRef - Javed MN, Alam MS, Waziri A, Pottoo FH, Yadav AK, Hasnain MS, et al. QbD applications for the development of nanopharmaceutical products. In: Beg S, Hasnain MS (eds) Pharmaceutical quality by design. Academic, New York, pp 229–253. https://doi.org/10.1016/B978-0-12-815799-2.00013-7.
CrossRef - Mishra V, Thakur S, Patil A, Shukla A. Quality by design (QbD) approaches in current pharmaceutical set-up. Expert Opin Drug Deliv. 2018;15(8):737-758. https://doi.org/10.1080/17425247.2018. 1504768.
CrossRef - Adam S, Suzzi D, Radeke C, Khinast JG. An integrated Quality by Design (QbD) approach towards design space definition of a blending unit operation by Discrete Element Method (DEM) simulation. Eur J Pharm Sci. 2011;42:106–115. https://doi.org/10.1016/j.ejps.2010.10.013.
CrossRef - Spireas S, Jarowski CI, Rohera BD. Powdered solution technology: principles and mechanism. Pharm Res. 1992;9:1351–1358. https://doi.org/10.1023/A:1015877905988.
CrossRef - Jaydip B, Dhaval M, Soniwala MM, Chavda J. Formulation and optimization of liquisolid compact for enhancing dissolution properties of efavirenz by using DoE approach. Saudi Pharm J. 2020;28:737–745. https://doi.org/10.1016/j.jsps.2020.04.016.
CrossRef - Apley M, Crist GB, Fellner V, Gonzalez MA, Hunter RP, Martinez MN, et al. Determination of thermodynamic solubility of active pharmaceutical ingredients for veterinary species: A new USP general chapter. Dissolution Technol. 2017;24:36–39. http://doi.org/10.14227/DT240117P36.
CrossRef - Yadav PS, Hajare AA, Patil KS. Design and development of Fujicalin-based axitinib liquisolid compacts for improved dissolution and bioavailability to treat renal cell carcinoma. Eur J Pharm Biopharm. 2024;204:114506. http://doi.org/10.1016/j.ejpb.2024.114506
CrossRef - https://www.accessdata.fda.gov/scripts/cder/dissolution/dsp_SearchResults.cfm. (Accessed on 26 September 2024).
- Bunchongprasert K, Shao J. Cytotoxicity and permeability enhancement of Capmul®MCM in nanoemulsion formulation. Int J Pharm. 2019;561:289–295.https://doi.org/10.1016/j.ijpharm. 2019.03.010.
CrossRef - Li S, Madan P, Lin S. Application of Capmul MCM and caprylic acid for the development of danazol-loaded SEDDS. Pharm Dev Technol. 2015;20:886–896. https://doi.org/10.3109/10837450. 2014.943408.
CrossRef - https://www.pharmaexcipients.com/product/capmul-mcm/. (Accessed on 4 October 2024)
- Sayyad FJ, Tulsankar SL, Kolap UB. Design and development of liquisolid compact of candesartan cilexetil to enhance dissolution. J Pharm Res. 2013;7:381–388. https://doi.org/10.1016/j.jopr.2013.05.012.
CrossRef - Lu M, Xing H, Jiang J, Chen X, Yang T, Wang D. et al. Liquisolid technique and its applications in pharmaceutics. Asian J Pharm Sci. 2017;12:115–123. https://doi.org/10.1016/j.ajps.2016.09.007.
CrossRef - https://www.fujichemical.co.jp/english/medical/medicine/neusilin/neusilin_brochure.pdf. (Accessed on 4 October 2024)
- Fahmy R, Kassem M. Enhancement of famotidine dissolution rate through liquisolid tablets formulation: In vitro and in vivo evaluation. Eur J Pharm Biopharm. 2008;69:993–1003. https://doi.org/10.1016/j.ejpb.2008.02.017.
CrossRef - Patel DS, Pipaliya RM, Surti N. Liquisolid tablets for dissolution enhancement of a hypolipidemic drug. Ind J Pharm Sci. 2015;77:290–298.
CrossRef - Burra S, Yamsani M, Vobalaboina V. The liquisolid technique: An overview. Braz J Pharm Sci. 2011;47:475–482. https://doi.org/10.1590/S1984-82502011000300005.
CrossRef
Abbreviations List
BCS: Biopharmaceutical Classification System; Ca: Carrier material; CI: Compressibility Index; CMA: Critical Material Attributes; Co: Coating material; CPP: Critical Process Parameters; CQA: Critical Quality Attributes; DE: Dissolution; Efficiency; DoE: Design of Experiment; DSC: Differential Scanning Calorimetry; DT: Disintegrating Time; DTG: Dolutegravir sodium; FMEA: Failure Mode and Effective Analysis; FTIR: Fourier Transform Infrared Spectroscopy; Lf: Liquid load factor; MDR: Mean Dissolution Rate; MDT: Mean Dissolution Time; mg: Milligram; min: Minutes; ml: milliliter; Q10: Amount of drug release at 10 min; Q60: Amount of drug release at 60 min; QbD: Quality by Design; QTPP: Quality Target Product Profile; RA: Risk Assessments; rps: Rotations per second; SEM: Scanning Electron Microscopy; SSG: Sodium Starch Glycolate; T50: Time required to release 50 % drug; XRPD: X-ray Powder Diffraction
Accepted on: 12-12-2025
Second Review by: Dr. Ramya Sri
Final Approval by: Dr. Eugene A. Silow


