
A Review on Current Status of Riverine Pollution in India
 , Ahmad Ali, Nimisha Patel and Hina Alim*
 Corresponding Author E-mail: hina.alim@lifesciences.mu.ac.in
DOI : http://dx.doi.org/10.13005/bbra/2893
Download this article as:
![]()
Water is one of the essential resources needed on Earth for the survival of humans. The Indian people consider rivers such as Ganga, Yamuna, and Sabarmati sacred, while the Mithi river had bio-diversified importance. Drinking and taking bath in the sacred rivers is a common practice.These rivers cover a total distance of 4272 kilometres. But the water quality of these rivers is compromised by the presence of various contaminants such as pesticides, heavy metals, organic waste, chemical waste, and direct discharge of sewage.The pollution levels have risen as a result of the chemical industry's output of 30984 metric tonnes in 2019-2020. Over the years, the agriculture sector has used 3,50,000 Mt of DDT.The water has become unfit for any human consumption, thus posing a possible threat of diseases outbreak. These rivers pass through the major urban cities of India like Delhi, major economic cities of Uttar Pradesh state, Ahmedabad, and Mumbai. There is a risk of certain lethal diseases due to the direct exposure of humans and other life forms to toxic chemicals and heavy metals through polluted river water. The objective of this study is to examine the causes of water contamination in major Indian rivers and their potential risk on human health.
KEYWORDS:Heavy Metals; Industrialization; Physicochemical Parameter; Urbanization; Water Pollution
Introduction
Water is aprecious liquid and very essential for every life form present on earth. It is a colourless, odourless, tasteless chemical molecule but the added minerals, nutrients; organic and inorganic compounds come either naturally or by human activity that gives water colour, odour, and taste. Water in its natural pure form does not contain any energy and organic and inorganic matter dissolved in it. One water molecule consists of two hydrogen atoms and a single oxygen atom 1.The water molecules are involved in various biological, biochemical, and chemical reactions in the ecosystem and integrated with every ecosystem. Human, animals, plants and other organisms or microorganisms utilize the water for various purposes such as photosynthesis, transport of food materials, reproduction, drinking, washing, cooking, and various domestic and industrial reasons.
Water molecules are formed naturally by the water cycle and are found in various, different forms like liquid, gaseous and solid forms. These molecules are present on earth in natural resources like rivers, lakes, oceans, seas, ponds, streams, groundwater, etc. 70% of the world total area is covered by water of which 97% area are covered by ocean and seas and the remaining 3% area are of freshwater; two-third of this freshwater is found in solid state in glaciers and the remaining freshwater found as ground and surface water 2. Freshwater resources like rivers, lakes, streams, ponds, and groundwater are the main source of water used by humans for various purposes. Water is precious and very important liquid for every life form present on earth. The importance of clean and good quality water was known from ancient times. The humans from Nomadic Stone Age wandered around river basins for water and food. From ancient times humans have utilized water for various purposes like washing, drinking, cleaning, rearing animals and also for agricultural usage, etc. The greatest human civilizations were formed near freshwater resources and around river basins. The entire major ancient rivers like the Nile river, Indus river, Tigris river, etc. had played an important role in the formation and development of all the greatest ancient civilizations. Mostly all ancient civilizations such as Egyptian civilization was formed near the Nile river in Africa, Mohenjo Daro civilization was formed near the Indus river in south Asia, etc. were build up near the river basin3. Rivers have also played an important role in the development of modern society.
In every country, most of the industries and commercial areas are located near the water bodies mostly near the river, ocean, etc, for easy availability of water because a very large amount of water is required for domestic and industrial purposes. There are various industries such as manufacturing plants, processing plants, food industries, nuclear power plants, mining sector, paper industries, dairy industries, chemical and fertilizer manufacturing plants, etc. that utilizea very large amount of water and release highly polluted and contaminated water directly into the water bodies. The main source of water pollution is industrial activity, during the last few decades the industrial wastewater is the main source of water pollutants in water resources. The contamination and pollution of water bodies generate various adverse effects on the aquatic environment and also on human health. There are various combinations and compositions of pollutants and contamination generated by different kinds of industrial and human activities. Each type of industry produces a specific kind of pollutants and effluents. The manufacturing industries effluents contain large amounts of organic, inorganic pollutants and also heavy metals, hazardous compounds. Manufacturing industries like fertilizer, chemicals, medicine, etc. discharge waste that contains a high amount of phosphate, sulphur, heavy metal, toxic chemicals, etc. The mining sector wastewater is high in arsenic, lead, mercury, toxic chemicals and gas, etc. and these sectors are the major sources of groundwater contamination. The petrochemical industry discharges waste that contains a high amount of hydrocarbon and their by-products. The food processing plant and agriculturally based industries contain a high number of suspended solids, organic compound and chemicals like fertilizer, herbicide, pesticide, etc. 4
Environmental destruction often happens due to human activities. These human activities normally include domestic, industrial and agricultural activity but industrial activity is more destructive than others. The rapid industrialisation and urbanisation in specific areas are responsible for the growth of megacities. It causes harmful effects on the surrounding natural environment. This development has caused stress on the natural environment of the cities. Rapid industrialisation leads to mass rural-urban migration. These migrants from villages or towns migrate towards the megacities for a better opportunity to improve their livelihood. These developments create pressure on natural systems mainly on freshwater bodies because freshwater bodies are very essential for the development of any city. For sustainable development, city management and administration should prevent and minimize pollution and any activities from the domestic or industrial sector that harms the natural ecosystem of that area. All over the world, mostly in developing and poor countries, it is estimated that more than a billion people have no access to safe drinking water. In India, mainly Maharashtra is the industrial hub included several densely populated cities which contain more than a few types of manufacturing and processing industries. They require a large amount of water. These waters come from rivers, lakes, and ponds and also from groundwater resources. Industrial and commercial activity utilized water and discharges their wastewater directly into the natural water bodies 5. Most of the Indian rivers are treated like an open drain where citizens and industries discharge their wastewater, effluent, sometimes garbage, plastic, etc. directly into the river without proper or sufficient treatment. Every organism utilizes the water in various forms and thousands of organisms live in the water. Hence, the water quality standard directly affects the both aquatic and environmental health of the organisms and also the health of human society. In the past few centuries, urbanization of humans and industrialization for the development has directly affected the natural resources and natural environment. In India, the water quality of about 70% of total river water was polluted due to high contaminants and pollutants, according to the World health organisation (WHO),Central Pollution Control Board(CPCB), Bureau of Indian Standards (BIS), Indian Council of Medical Research (ICMR) and many river water quality is too bad for agricultural and human use and harmful for animal consumption6, 7. Therefore, the polluted river and water bodies harm aquatic as well as terrestrial ecosystems and also affect the hygiene of the people that live and depend on the river water.
Physiochemical parameters such as total hardness, total alkalinity, DO, BOD, COD, salinity, etc.give information regarding the amount of pollution in the concerned water body. Each parameter has a certain standard range of quality set by different international and national organisations, such as the World Health Organization 8. If the reading parameters found exceeded the limits relative to the normal reading, then the sample of water is considered to be contaminated water.
Water Quality Standards for Inland Waters
Various national and international agencies have set standards for water quality. If the quality of Water River or any other water body is according to these parameters then it safe for drinking and human consumption. The national agency ICMR9 and international agency U.S. Public Health Service Drinking Water Standards (USPHS) 10 and WHO have set standards for quality of inland water. As water is the irreplaceable liquid for day-to-day life, so it is important to ensure the proper adequate quantity and standard level water quality supply for domestic as well as agricultural use 11. This proper supply of water for domestic and industrial use, ensures the proper growth and development of human society.
The various domestic and industrial activities like the discharge of effluents, wastewater, sewage, garbage, etc. are directly or without proper wastewater treatment dumped into the rivers. This has adverse effects on the physiochemical properties of river waters. The most affecting physiochemical properties of river water are chemical oxygen demand (COD), biochemical oxygen demand (BOD), dissolved oxygen (DO), alkalinity, salinity, total hardness, pH, etc.(Table 1). These physiochemical properties are responsible for the water quality and health of aquatic ecosystems 12. Farmers have no choice but to use untreated polluted river water for farming activities such as irrigational purposes. The improper management of water and unequal distribution of water globally reduces the availability of the good quality water for domestic and industrial purposes 13.
Table 1: Water quality parameters and their Permissible limit14
| Water quality parameters | Indian Council of Medical Research (ICMR) | U.S. Public Health Service Drinking Water Standards (USPHS) | World health organisation (WHO) |
| Temperature 0C
|
– | – | – |
| pH | 6.5-9.2 | 6.0-8.5 | 7.0-8.5 |
| Dissolved oxygen (DO) | – | >4.0 | – |
| Biochemical oxygen demand (BOD) | – | – | – |
| chemical oxygen demand (COD) | – | – | – |
| Alkalinity CaCo3 | 81-120
|
– | – |
| Nitrate | 20.0 | 10.0 | 45.0 |
| Phosphate | – | 0.1 | – |
| Sulphate | 200 | 250 | 200 |
| Total hardness
CaCo3 |
300 | 500 | 100 |
| Total solids | – | 500 | 500 |
(Source – Dwivedi, 2017)
Rivers or other water bodies are looked at as the cheapest and easiest way to dispose waste generated by industries. But this disposal of wastewater into the river creates adverse effects on aquatic life and also on human health and aquatic life 15.Today in the world both developing and developed nations, are facing the issue of waste disposal. Disposing wastewater from domestic and industrial sources creates a big challenge 16.
Every natural water body can remove pollutants from the wastewater to a certain extent. They may use the chemical, physical, and biological reaction to purify and degrade pollutants, also with the help of naturally occurring aquatic animals and plants every water system is capable to degrade pollutants. However, this natural purification system of water bodies is effective up to a certain extent and a large amount of pollutants cannot be managed by the water bodies naturally. Growth and development of industries and various human activities such as deforestation, global warming, etc., and also increasing population are causing changes in the water cycle and the environmental water cycle balance. In the many states of India, safe, clean, and good quality water for drinking and cooking is available in very small amounts especially in Rajasthan, Maharashtra. All over India clean and safe water is available for an only small fraction of the population. The remaining population of India is using polluted or chlorinated drinking water, which causes several types of health problems 17.
Major sources and effects of Water Pollution
Due to the adverse and destructive effects of water pollution, it has now become an important global phenomenon. There are various sources of water pollution. Based on the source of water pollution it is classified into point and non-point sources. Point sources are referred to as industrial, domestic sewage plants and known sources which discharge wastes directly into the water bodies while non point sources refer to those sources which indirectly discharge their pollutant into the water bodies such as agricultural runoff, air pollutant discharge through rain or air impurities settling process, etc. Identifying and remediate the non-point sources of pollution is very difficult and costly 18.Industrial growth over the years has caused a growth in various chemical productions (Table 2). This has also caused an upsurge in waste generation from these chemical industries.
Table 2: Chemical production in India (thousand metric tons)19
| Group | 2015-16
Metric tons |
2016-17
Metric tons |
2017-18
Metric tons |
2018-19
Metric tons |
2019-20
Metric tons |
2020-21
(April2020toSep.2020) Metric tons |
| AlkaliChemicals | 6802 | 7009 | 7631 | 8043 | 8457 | 3369 |
| InorganicChemicals | 1002 | 1053 | 1058 | 1064 | 1063 | 364 |
| OrganicChemicals | 1589 | 1638 | 1799 | 1884 | 1847 | 816 |
| Pesticides | 188 | 214 | 213 | 217 | 192 | 101 |
| Dyes&Pigments | 304 | 320 | 367 | 382 | 384 | 114 |
| TotalBasicMajor
Chemicals |
9884 | 10234 | 11069 | 11589 | 11943 | 4763 |
| SyntheticFibers | 3558 | 3599 | 3625 | 3601 | 3893 | 974 |
| Polymers | 8839 | 9163 | 9276 | 10040 | 12404 | 5606 |
| Elastomers(S.Rubber) | 242 | 285 | 308 | 351 | 358 | 156 |
| Synth. DetergentIntermediates | 566 | 664 | 743 | 687 | 715 | 347 |
| PerformancePlastics | 1700 | 1799 | 1719 | 1589 | 1672 | 656 |
| TotalBasicMajor
Petrochemicals |
14905 | 15510 | 15670 | 16269 | 19041 | 7739 |
| TotalBasicMajorChemicals andPetrochemicals | 24788 | 25744 | 26739 | 27858 | 30984 | 12502 |
(Source – GOI, Annual report 2020-21)
As industrialization and urbanization progressed, exploitation of these natural resources started at an unprecedented rate. The industries require a huge quantity of water for industrial activities and the amount of water required depends upon the type of industry. The industry generates a large amount of wastewater, garbage, and effluents which either directly or indirectly goes into the river or other natural water bodies. The waste is directly being dumped into the river. The industrial effluent consists of inorganic, organic, and toxic chemicals (Table 3).
Table 3: Types of industries and their effluents 20
| Sr.No. | Types of industries | Effluents released |
| 1 | Metal, electroplating and
thermal power plant industries |
Inorganic effluents such as cadmium, chromium, iron, lead, mercury, nickel, titanium, and zinc |
| 2 | Pulp and paper mill industries | Chlorinated organics and dioxins, solid and organic waste |
| 3 | Petrochemical industry | Phenols and mineral oils |
| 4 | Tannery industry | Chromium, zinc, manganese,
copper and lead |
(Source – Dwivedi et al.,2018)
Since the problems related to water pollution created, it has now become a global phenomenon. Therefore, many scientists, researchers, and students did an abundance of literature and research on the water pollution and water quality of various water bodies. The rapidly increasing population dynamics and development of industries create huge pressure on various water bodies and also increases pollution into the water ecosystems. Human activity either at the domestic level and industrial level is responsible for the deterioration of water quality. These human activities include direct disposal of solid waste and discharge of industrial and domestic wastes, sewage and garbage disposal, agricultural runoff, disposal of dead bodies of plant and animals, etc.21 The industrial dumping of water also includes a large amount of heavy metals. These heavy metals viz., Lead (Pb), Cadmium (Cd), Copper (Cu), Chromium (Cr), Nickel (Ni), Zinc (Zn), and Arsenic (As) have various adverse effects on aquatic life as well as on human health and they interfere with the normal metabolic process. The continuous exposure to these metals results in their bioaccumulation, and the central nervous system, lungs, liver, kidneys, endocrine glands, and bones may be impaired. Heavy metal pollution of water bodies possesses serious concern to human health and following (Table 4) discusses the diseases caused by the constant exposure to heavy metal pollution.
Table 4: Heavy metalpollutants, their major source, and effects on human health22
| Heavy metal pollutants | Major source | Effects on Human Health |
| Lead | Paint, Pesticide, Batteries, Crystal Glass Preparation | Cognitive Impairment in Children, Peripheral Neuropathy in Adults, Developmental Delay |
| Copper | Electroplating, Pesticide Production, Mining | Headache, Nausea, Vomiting
Diarrhea and Kidney Malfunctioning |
| Zinc | Effluents from Electroplating
Industries, Sewage Discharge, The Immersion of Painted Idols |
Vomiting, Diarrhea, Icterus, Liver and Kidney Damage |
| Nickel | Stainless Steel Manufacturing Units, Electroplating Factory Discharge | Neurotoxic, Genotoxic, And Carcinogenic Agent, Nickel Dermatitis |
| Cadmium | Electroplating, Preparation of Cd-Ni Batteries, Control Rods, Shields within Nuclear Reactors, Television Phosphors | Kidney and Liver Damage. Renal
Dysfunction, Gastrointestinal Damage |
| Chromium | Mines, Electroplating | Gastrointestinal, Hepatic, Renal,
Neuronal Damage |
(Source – Malik et al., 2014)
Status of River pollution in India
The rivers in India have a holy as well as ecological importance. Rivers like Ganga, Yamuna, and Sabarmati are considered to be sacred. While the Mithi river is of great importance to biodiversity. All these rivers pass through the densely populated and most polluted cities in India. Over the years as there was an increase in population, urbanisation also grew to cause an increase in the amount of wastewater discharge from all of these. Thus we are reviewing the current scenario of these rivers.
Ganga River
Ganga is the longest river in India having a stretch of 2525 km, considered to have holistic and historical importance 20. Ganga River originates from Gomukh cave from Gangotri Glacier at Latitude. 30°55’N and Longitude. 79°07’E, from Garhwal Himalayas named as River Bhagirathi at an altitude of 4100 m. This glacier system is comprising mainly of Gangotri glaciers having a total length of 30.20 km and a width range of 0.20 – 2.35 km and the total covered area is around 86.32 km223. After leaving Uttar Pradesh, it enters into West Bengal territory and flowing towards the south region. It is divided into two arms below 40 km from Farakka. The left arm of the river flows to the east towards Bangladesh and the right arm of the river flows to the south towards West Bengal, called Bhagirathi. The Bhagirathi River is called Hooghly that flows towards the west and south-west direction in Kolkata. It takes a southward direction after reaching Diamond Harbour and before reaching the Bay of Bengal divided into two streams 24(Figure 1). The average annual discharge of water is 18,700 m3/s, which is the fifth highest in the world. The catchment area has a high variation inflow and the average maximum flow of the river Ganga is 468.7 _ 109 m3, which contributed the 25.2% of India’s total river freshwater resources 25. Here, the main source of river water comes from monsoon rains and the melting of snow in the Himalayas. It is considered the most sacred river and the water of the river is considered to have medicinal and antimicrobial properties 26. The Ganga river basin is one of the most populated areas of the world; so the pollution level in the river has increased drastically over the time. The water is still being used for various domestic and commercial purposes 20. The various factors are responsible for the pollution of the river and major reasons are the dumping of sewage and industrial chemical effluents without any treatment directly into the river 26. Various agricultural, religious and non-religious anthropogenic activities are also equally responsible for the river pollution 20.
 |
Figure 1: Map showing Ganga river 27 |
The sewage treatment system is still underdeveloped as major cities located around the river produce sewage in millions. Meanwhile, the treatment plants can treat only a fraction of the waste26. The normal quality parameters of water such as major ionic balance and natural bacterial flora all are affected by the release of untreated sewage. Industrial effluents release a variety of effluents in the river that has been reported to affect the aquatic life of the river as well as people dependent on it 20.
Agricultural practices such as the usage of pesticides are a major cause of riverine pollution. Major agricultural areas are located nearby the Ganga River, thus posing a threat of possible pesticide runoff. Pesticides have been withdrawn e.g. Dichlorodiphenyltrichloroethane (DDT), Aldrin and Hexachlorocyclohexane (HCH)commonly known as lindane are still being used due to low cost and are easily available 20. The Ganga is considered a holy river; various religious activities are performed throughout the year on the banks of the river 28. Devotees have been offering many things causing an increase in pollution and religious festivities such as Kumbh Mela devotees take bath in the river, thus causing increase in pollution. It also poses a threat to the devotees as the water may cause various water-borne diseases 28. The idol immersions during various festivities have led to an increase in the concentrations of heavy metals. Also, tonnes of flowers and garland waste is dumped into river 20. Due to religious attitude, dead bodies’cremation takes place on the bank of the river and ashes of the dead body are also offered to the river 26.
At present due to the prevailing situation of COVID-19 spread the lockdown has been imposed; the water quality of the Ganga River has improved slightly as tourism and industrial activities narrow down. But on the other hand, there was an upsurge in domestic sewage discharge and another study reported a decrease in turbidity levels in some stretches of the river 29.
DDT and lindane are some agrochemicals that cannot degrade easily and these agrochemicals are reaches to the river through runoff and these agrochemicals have a tendency to bioaccumulate. In the Gangetic plains of Bihar, the gradient is very low (1:13800), which made several permanent or temporary floodplain wetlands at the Basin of Ganges River, which becomes a hot spot area for vectors of several diseases such as malaria and Kala-azar.In the past few decades, chlorinated pesticides (25,000 Mt) were used in India on annual basis. DDT is the most commonly used insecticides by farmers comprise about 40% of the total used pesticides. Since 1985 India has utilized 350,000 Mt of DDT. Around 120,000 Mt of technical grade insecticides is produced in India, out of which ten states in 2011-12 consumed 20,208.57 Mt (Uttaranchal – 233.20 Mt; Uttar Pradesh – 8,527 Mt; Bihar – 655 Mt; Jharkhand-151.37 Mt; West Bengal – 3,730 Mt; Haryana – 4,050 Mt; Delhi – 45Mt; Rajasthan – 1,652 Mt; Madhya Pradesh – 850 Mt and Himachal Pradesh – 315 Mt). The main source of Persistent Organic Pollutants (POPs) into river water comes from the direct release of waste containing POPs, agricultural runoff, and depositions of POPs from the atmosphere in Ganges river basin. Dichlorodiphenyl trichloroethanes (DDTs) and HCHs are the most common POPs found in agricultural wastewater and also most commonly observed POPs found in rivers, lakes, and other surface water. Some other observed POPs found on a small scale in surface water are endosulfan, heptachlor, aldrin, dieldrin, polychlorinated biphenyl (PCB) (varied number of PCB congeners), chlordane, hexachlorobenzene, endrin, mirex and perfluorinated compounds30.
Yamuna River
The river Yamuna is the longest and second-largest tributary of the Ganga River. Near Bandar Punch, the principal starting stream of the river originates from the Yamunotri glacier (38o 59 ‘N 78o 27’ E). It is situated in the lower Himalayas in the Mussoorie range in the Uttarkashi district of Uttaranchal, which is around 6,320 meters above sea level. The catchment of the Yamuna Riverincludes various states of India. It covers parts of the states of Uttaranchal, Uttar Pradesh, Himachal Pradesh, Haryana, Rajasthan, Madhya Pradesh, and the entire state of Delhi 22(Figure 2). Yamuna River is highly polluted. More than 85% of the overall discharge of waste comes from domestic sources31. Yamuna’s main sources of pollution include untreated sewage from domestic and commercial sources, industrial waste, direct disposal of solid waste and animal dead bodies, immersion of idols, and pollution due to in-stream water uses such as hydroelectric generation and fish propagation32.
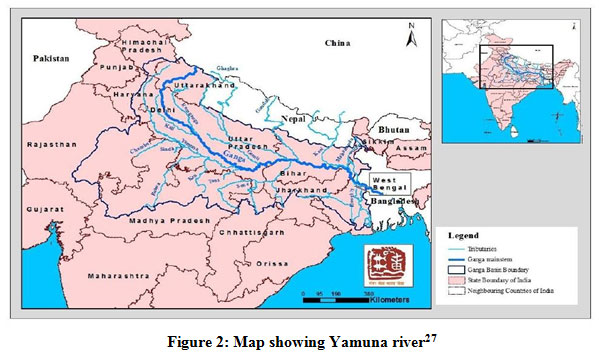 |
Figure 2: Map showing Yamuna river27 |
Due to the continuous discharge of sewage, industrial and domestic waste directly into the river for many decades, the river becomes dead and the ecological life of the river has been choked to end by pollution. The 22 Km long stretch along Delhi has no remaining aquatic life. The very low level of DO around 1 mg/l which should be more than 5mg/l and various chemical pollutants present in the river make the river an inhabitable water body for aquatic life.The river segment passing through the Delhi corridor constitutes merely 2% of the entire river length and accounts for nearly 76% of the total pollution that the river carries33. River Yamuna, in the national capital territory (NCT), commonly called Delhi, has been subjected to immense degradation and pollution due to the huge amount of domestic wastewater entering the river. BOD, DO, total and faecalcoliforms and free ammonia were found to be critical parameters for the detection of pollution34. The water quality map of the river has been prepared to show that the Delhi stretch is highly polluted due to the dumping of waste and discharge of untreated sewage and industrial effluents 35.Yamuna river has been the major source of water in Haryana, Delhi, Uttar Pradesh.
There are various human and industrial activities, releases lots of waste which directly releases into the river without proper sufficient treatment, which decreases the river water quality. Mainly urbanization and industrialisation near the Yamuna river havedeteriorated the river intoopen drainage. In the Yamuna riverHaryana releases high levels of waste and is the main contributor to the river’s pollution, but other states also pollute the river. Millions of litres of waste, sewage dumps by Delhi into the Yamuna. Delhi dumps 58% of its waste directly without proper waste treatment into the Yamuna River. Pollutants released by industrial and domestic sources contain various heavy metals. The current state of the river is of significant concern and there is an immediate need to take strict steps to ensure river cleaning and to mitigate pollution22.When the river reaches Uttar Pradesh, the river becomes invisible because the pollutants of the river generate lots of foam which are hazardous and covers the almost entire surface area of the river.
The Indian government started the Yamuna cleaning action plan in two phases and spent more than 1500 crore for making a new sewage treatment plant of more than 900 million litres capacity.According to the central pollution control board, at Agra the river pollution index reaches 50 times more BOD than the permissible limits. The central water commission announced that the Yamuna river water is not safe for domestic, irrigation, and industrial use. The water quality of Yamuna now becomes unrepairable and is also contaminating the underground water.The permissible BOD level for river water is 2 mg/l while the BOD level of Yamuna is beyond 55mg/l, which is enormously very high, and at this level the contamination level becomes irreversible making river water unsafe and unusable.
Sabarmati River
Sabarmati is one of the major rivers starting from Aravali hills ranges in Rajasthan and ends in the Arabian sea at the Gulf of Cambay. It is a major river flowing in the west region of India and traveling around 371 km, 48km of the river located in Rajasthan while the remaining 323km of river flows through Gujarat. Sabarmati Riveris located at the 762-meter elevation in Tepur village of Rajasthan States. The Sabarmati river basin has a total area of 21,674km and the highest length: width of the river is 300:150km. At the 51km length of river, it combined with Wakal bank on the left bank and after 67th km of its length, it mixed with Sei on the right-side bank and Harnav at the 103km on the left bank. Wakal, Sei, Harnav, Hathmati, Watrak are the tributaries of Sabarmati river(Figure 3).
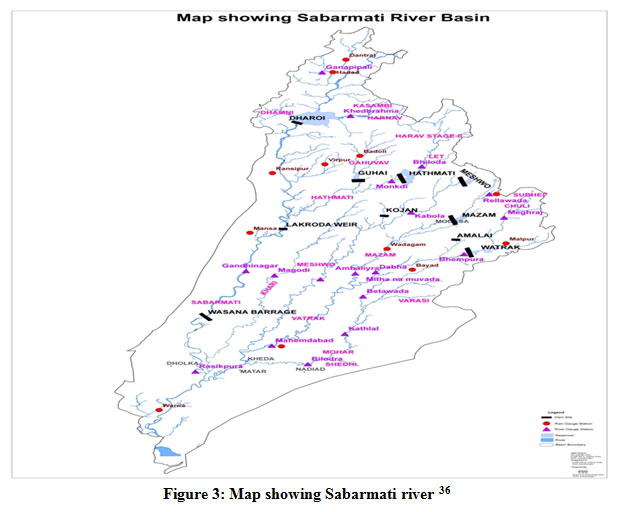 |
Figure 3: Map showing Sabarmati river 36 |
(Source – https://gujnwrws.gujarat.gov.in/showpage.aspx?contentid=1592&lang=english)
Two major cities of Gujarat are located at the basin of the river. Sabarmati river is mostly polluted by direct and untreated discharge of wastewater coming from industries. It is also one of the most polluted rivers of India and the lifeline of Gujarat states. It is the major source of water in Gujarat. Sabarmati flows from Gujarat and Rajasthan, but the highest polluted part of the river is located in the states of Gujarat. Very intensive irrigation at various parts of Gujarat has left the river dry and is still lowering the water level. River from Ahmedabad to Sabarmati Ashram and from Sabarmati Ashram to Vautha is the most polluted region of the river. These regions are highly polluted due to urbanisation and industrial activities. The thousands of industries are present from Sabarmati to Vautha, which releases millions of tons of sewage, industrial effluent, garbage, etc directly into the river. Extremely intense irrigation, direct sewage discharge,and industrial effluent into the river deteriorating the water quality of the river. The major sources of total wastewater come from domestic wastewater discharge while wastewater discharge releases from the industrial activity are comparatively lower. On-point pollution sources are also one of the major contributors to river pollution 37.
The area starting from Dharoi reservoir to Narmada escape is not highly contaminated, because the industrial activities are very low in these areas. The dry phase and pollution level of the Sabarmati Riverare due to deforestation, climatic changes, industrial effluent discharge, domestic sewage discharge, and agricultural activities. Minerals content, pollutant level, and various nutrient parameters of the river are very high in the downstream of the river as compare to upstream of the river. The demand for biochemical oxygen and chemical oxygen is very high when the river enters the Gulf of Cambay, but some parameters indicate improvement due to dilution from tidal effects at the location of Galiyana. The higher physio-chemical parameters such as chloride, total hardness, organic matter, COD, BOD, etc. the downstream of the river gives the river water an unpleasant odour and adds saltiness to the water. The lower DO level at various point of the river, affects the aquatic life and vegetation of the river. Organic matter is the major source of pollutants that promotes algal growth and various unwanted plants which depletes the DO of the river.
Physicochemical parameters(temperature, pH, salinity, DO, total dissolved solids, chloride, turbidity, phenol, BOD, and petroleum hydrocarbons), biological (phytoplankton) and microbiological (total and selective bacterial count) studies showed that the stretch of the river from the Ahmedabad-Vasana barrage to Vataman was highly contaminated mainly by municipal drainage and industry due to perennial waste discharges.A 33 environmental management plan with the adequate handling of 34 urban and industrial effluents must be enforced to not deteriorate the water quality of this river until 35 vents 37.At different river locations, Sabarmati River water samples were obtained and analysed using chemical and biological parameters such as pH, DO, BOD, COD, phosphate, conductivity, and total coliform species. In thechemical and microbiological parameter study of river water, the test results suggest that Sabarmati river water is not graded as Class-A, B, or C. Therefore, before its use for drinking and cooking purposes, disinfection, filtration, and various other processes such as the boiling process should be done39.
Mithi River
The Mithi Riveris located in the city of Mumbai. This Mithi River is seasonal, the water level of the river rises during monsoon, and overflowing lakes i.e., Powai and Vihar lakes also contribute to this river. It is 18km long which ends in the Arabian sea near the Mahim creek while it starts from the endpoint of Vihar and Powai Lake and this river passes through several parts of the cities(Figure 4).The Mithi River, situated in the industrial hub and flowing through the heart of the megacity of Mumbai, is one of the most polluted rivers in Maharashtra. The Mithi River is surrounded by densely populated residential areas, the largest slum in Asia, and industrial units on both sides. These residential and industrial areas near the Mithi River directly dischargedthe waste into the river. It affects the physiochemical properties of river water, damage the river ecosystem, deteriorate water quality of river water, garbage and plastic disposal into the river, and result in waterlogging. On 26th July 2005, heavy rains and water overflow from Mithi river caused water logging and floods around the Mumbai airport and the parts around the river i.e. nearly the whole of Mumbai.
High pollution into the river affects the river drainage capacity; hence the river is unable to drain out the rainwater which creates flood, in which many people lost their lives over the years. After that, many various governmental and non-governmental organizations are trying to reduce the pollution in the Mithi river and also taking action to control the disposal of solid wastes. Due to various reasons such as improper management, financial and technical reasons, all the suggestions and action taken to reduce the pollution were not properly implemented. Bombay Municipal Corporation (BMC) has failed to reduce the pollution of the Mithi River. The short-term survey conducted by the Maharashtra Pollution Control Board (MPCB) along with CPCB in 2004 pointed out the need for a systematic and regular monitoring of pollution level of the river for improvement in the water quality standard 40.
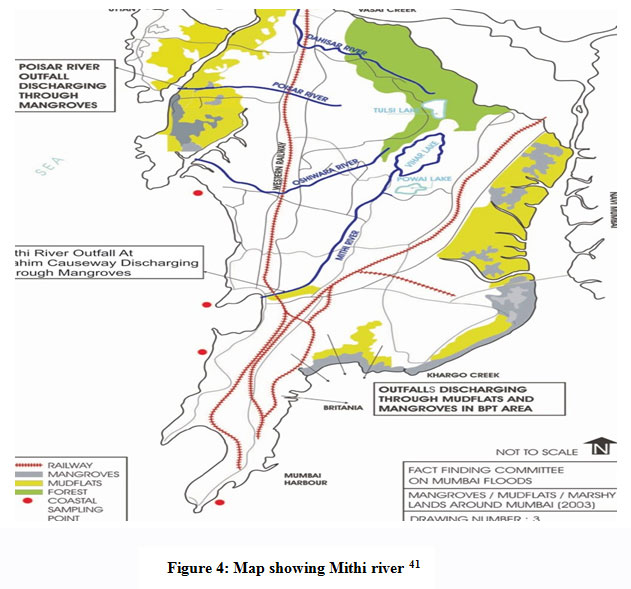 |
Figure 4: Map showing Mithi river 41 |
In Mumbai, most of the industries are located nearby rivers, lakes, and seas. Mithi River is also surrounded by thousands of industries, commercial and residential areas. This increases the water pollution level of the Mithi River and generates various severe environmental problems and pollution in the Mithi river natural environment. Release of untreated water into the river seriously affects the water quality and makes the water quality level much lower in comparison to the international water quality standard. The illegal and untreated industrial and commercial effluents have rapidly increased the river water pollution which is more than 20 times than the water standard level. It is normally found that almost every river is polluted by various human activities. Mithi river is one of the most polluted rivers which receives heavy pollution and effluents from illegal or legal industrial activities 4.
Many parts of the river are prone to flood. There are various reasons for flooding in the river. Tidal variation is the major reason behind the floods in the river. Some major factors which cause flooding problem in the river are excessive siltation process, loss of water holding capacity of the river due to unauthorised construction, increase in runoff water gradient due to development and high covering area in development, choking of drainage system due to solid waste matter mainly due to plastic, garbage dumping, poor structural construction, etc. High siltation process in the Mithi river, causes flooding issues. Mumbai Metropolitan Region Development Authority (MMRDA)has recommended the excavation of more than 12 thousand Cubic meters of silt and debris from the Mithi River.
As per the Department of Environment of Government of Maharashtra, the industrial policy on river catchment classified the Mithi river under the category of A-IV. According to this category, for any form of industry, both sides of the river are designated as a non-developmental region. But with the completely implemented emission control system between 500 meters and 1 Km, only green and orange category industries are permitted. Large industries are allowed to developed 1 Kmaway from the river on both sides with pollution control systems. But the Mithi River is surrounded by many industries, slums, and many activities along its bank due to a lack of management and other policy implementation. The river consumes massive quantities of sewage, agricultural waste, solid waste, and waste, rendering the river like an open drain. There are many illegal dwellings, and illegal industrial activities continue along the river, making the conditions of the river worse. The Mithi River serves as natural drainage for overflowing lakes and excess water coming from close areas during the monsoon. There are various illegal industrial and developmental activities happening along bank of the river such as the washing of drums of oil and chemicals, disposal of toxic and hazardous wastes directly into the river, cattle and animal shed generate animal waste. Metal and scrap dealers and also barrel or drums cleaner dump oil wastes, industrial effluent, and solid wastes in the river. The disposal of solid wastes, garbage and organic wastes reduces the flowing rate of the river and creates water logging problems at the narrow area of the river. Industrial waste damages the marine and river ecosystem and causes total loss of aquatic biodiversity of the river. As per the cleaning action plan by IIT Bombay, the report on “Development of action plan for environment for the improvement of Mithi River” suggested that the Mithi river requires sewage treatment plants at 43 points42.
Since 2002, the Indian government has been attempting to link rivers across the country. A task force has been created to review the project’s various aspects. Scientists are concerned because this could disrupt the hydrological cycle. The completion of the project may affect river morphology, sedimentation, and land fertility. Agricultural activities can be harmed, resulting in an increase in pesticide and insecticide use.43. Thus again increasing the run-off into the rivers. New factories may also emerge near the water source, releasing effluents directly into the water bodies.The effect on unpolluted or less polluted rivers is equally concerning. The water flow from highly polluted areas of the river could harm the ecology and the biodiversity of unpolluted rivers. Thus the above information could be useful for scientific planning to avoid various side effects of river linking project or other such future endeavours.The on-going projects Namami Gange Programme, YamunaActionPlan, SwachhSabarmati Maha Abhiyan, and Mithi RiverRejuvenationplan could benefit from the above data which focuses on the specific causes of the pollution. The processing of industrial chemicals and their effluents release has been correlated with possible human health effects.
Conclusion
The water quality of rivers like Ganga, Yamuna, Sabarmati, and Mithi needs to be surveyed timely. The water quality parameter of rivers is clearly below the standards of WHO and BIS. Aquatic and biodiversity near river beds are at a greater risk due to the increasing pollution load in the rivers. The amount of effluents released has increased as the production of chemicals and petrochemicals has increased over time. For a long time, a significant number of pesticides and insecticides have been used illegally. The release of effluents such as heavy metals has harmed human health.The flooding has resulted in many deaths and has become a major cause of the spread of various diseases. There is also a possibility of an outbreak as a result of the flooding.Various river-cleaning schemes aren’t working as well as they should. The information would be useful for a variety of river cleaning projects. Government agencies will be able to recognise the involvement of various anthropological factors that causes river pollution and take appropriate measures. Fishermen may use the data to identify unpolluted fishing areas.
References
- Nagarsekar A.S., Kakde U.B. A study of Physico-Chemical Parameters of Mithi River Water in Mumbai Metropolis. J. Chem.2014;5(5):24-42.
- Ranade V., Bhandari V. Industrial Wastewater Treatment, Recycling and Reuse. 2014;1-58.
CrossRef - Nagarsekar A.S., Kakde U.B. A Bacteriological Study of Mithi River Water in Mumbai Metropolis. J. Res. Biosci. Agric. Technol.2014;2(2):2347-517X.
- Patwardhan A.D. (ed): Industrial waste water treatment, 1st New Delhi: PHI learning private limited.2008; pp 1-5,266-275.
- Singare U.P., Mishra R.M., Trivedi M.P., Dagli D.V. Aquatic pollution in Mithi River of Mumbai: assessment of physio-chemical parameters. Environ. Rev, 2012; 13(4):245 – 268.
CrossRef - Jindal R., Sharma C. Studies on water quality of Sutlej River around Ludhiana with reference to physicochemical parameters. Monit. Assess. 2010; 174:417–425.
CrossRef - Ramakrishnaiah C.R., Sadashivaiah C.,Ranganna G. Assessment of water quality Index for the groundwater in Tumkur Taluk, Karnataka State. Electron. J. Chem. 2009; 6(2):523–530.
CrossRef - World Health Organization (WHO). Our planet, our health- Report of the WHO Commission on Health and Environment, Geneva, WHO. 1992; 106- 144.
- Indian Council of Medical Research (ICMR). Ministry of Health Committee on Public health Engineering Manual and Code of Practice. Manual of Water Supply. New Delhi. 1962.
- S. Public Health Service Drinking Water Standards P.H.S. Pub. 956. U.S. Department of Health, Education and Welfare, Washington D.C. 1962.
- Sahu B.K. A study of the aquatic pollution load in the river Brahmani, Ph.D. Thesis, Sambalpur University, Sambalpur. 1991
- Panda R.B., Sahu B.K., Sinha B.K., Nayak A.A. Comparative study and diurnal variation of Physiochemical Characteristics of River, Well and Pond Water at Rourkela Industrial Complex of Orissa. Ecotoxicol. Environ. Monit. 1991; 1(3):206-217.
- Ciaccio LL.(ed): Water and water pollution handbook Volume 1. United States: Marcel Dekker, Inc. 1971; 5(13):468.
- Dwivedi A.K. Groundwater Quality and Arsenic. Case. Stud. 2017; 3(4):555617.
CrossRef - Tanner C.C. Plants as ecosystem engineers in subsurface-flow treatment wetlands. Sci. Technol. 2001; 44(11-12):9-17.
CrossRef - Zimmel Y., Kirzhner F., Roitman. Use of Naturally growing aquatic plants for waste water purification. Water Res. 2004; 76:220-230.
CrossRef - Trivedi P.R. (ed): India’s Environment, New Delhi: APH Publishing Company, 2004.
- Harnova R.K. Nutrient Variation in the Urban Drainage water of Harare, Zimbabwe – assessment and regularity aspects.Diffuse Pollution conference, Dublin. 2003; 4:63-68.
- Annual Report 2020-21. Department of chemicals and petrochemicals, Ministry of chemicals and fertilizers, Government of India, New Delhi. 2021.
- Dwivedi S., Mishra S., Tripathi R.D., Ganga water pollution: A potential health threat to inhabitants of Ganga basin. Int. 2018; 117:327–338.
CrossRef - Meitei N.S., Patil P.M. Water Quality of Purna River in Puna town in Maharashtra. J. Aquat. Biol. 2004; 19:77-78.
- Malik D., Singh S., Thakur J., Singh R.K., Kaur A., Nijhawan S. Heavy Metal Pollution of the Yamuna River: Introspection.J.Curr.Microbiol.App.Sci. 2014; 3(10):856-863.
- Singh V.K., Singh K.P., Mohan D. Status of heavy metals in water and bed sediments of river Gomtiea tributary of the Ganga river, India. Monit. Assess. 2005;105:43-67.
CrossRef - Rahaman M.M. Integrated Ganges basin management: conflict and hope for regional development. Water Resour. Dev. 2009; 25:159 -173.
CrossRef - Sarkar U.K., Pathak A.K., Sinha R.K., Sivakumar R., Pandian A.K., Pandey A., Dubey V.K., Lakra W.S. Freshwater fish biodiversity in the river Ganga (India): changing pattern, threats and conservation perspectives. Fish. Biol. Fish. 2012; 22:251–272.
CrossRef - Rai B. Pollution and Conservation of Ganga River in Modern India. J. Sci. Res. 2013;3:4: 2250-3153.
- Ganga basin. National Mission for Clean Ganga. Ministry of Jal Shakti, Department of Water Resources, River Development and Ganga Rejuvenation, Government of India. Available from – https://nmcg.nic.in/location.aspx
- Vortmann M., Balsari S., Holman S.R., Greenough P.G. Water, Sanitation, and Hygiene at the World’s Largest Mass Gathering. Infect. Dis. Rep.2015;17(2):461.
CrossRef - Mousazadeh M., Paital B., Naghdali Z., Mortezania Z., Hashemi M., Karamati Niaragh E., Aghababaei M., Ghorbankhani M., Lichtfouse E., Sillanpaa M., Hashim K.S.,Emamjomeh M.M. Positive environmental effects of the coronavirus 2020 episode: a review. Dev. Sustain. 2021;1–23.
CrossRef - Aktar M.W., Sengupta D., Chowdhury A. Impact of pesticides use in agriculture: their benefits and hazards. Toxicol. 2009;2(1):1-12.
CrossRef - Central Water Commission (CWC), Yamuna Basin Organization, New Delhi, 2009.
- Central Pollution Control Board (CPCB), MOEF, Status of Sewage Treatment in India, New Delhi. 2006.
- Said S., Hussain A. Pollution mapping of Yamuna River segment passing through Delhi using high‑resolution GeoEye‑2 imagery. WaterSci. 2019; 9:46.
CrossRef - Sharma D., Kansal A. Water quality analysis of River Yamuna using water quality index in the national capital territory, India (2000–2009). Water Sci.2011;1:147–157.
CrossRef - Sharma M.P., Singal S.K., Patra S. Water Quality Profile of Yamuna River, India. Nepal. 2008; 3:1-7.
CrossRef - Sabarmati River Basin. Narmada Water Resources, Water Supply and Kalpsar Department, Water Resources Division. Gujarat Government. Available from –https://gujnwrws.gujarat.gov.in/showpage.aspx?contentid=1592&lang=english
- Gujarat Pollution Control Board (GPCB). Comprehensive Environmental Pollution Abatement Plan for Vatva Industrial Cluster. Gujarat. 2010.
- Haldar S., Mandal S.K., Thorat R.B., Goel S., Baxi K., Parmer N., Patel V., Basha S., Mody K.H. Water pollution of Sabarmati River—a Harbinger to potential Disaster. Monit. Assess. 2014;186(4): 2231-42.
- Qureshi I., Gandhi D., Zarad S., Gandhi H. A Study of physico Chemical and biological characteristics of Sabarmati river water in Ahmadabad city, Gujarat, India. Ind. Pollut. Control. 2018; 34(1):1877-1881.
- Mithi River Water Pollution and Recommendations for its Control. Klean Environmental Consultants Pvt. Ltd. Maharashta pollution control board (MPCB). 2004.
- Rivers in Mumbai. Municipal Corporation of Greater Mumbai. Disaster Management Department. Government of Maharashtra. Available from-https://dm.mcgm.gov.in/rivers-mumbai
- National Environmental Engineering Research Institute (NEERI), Current Status of Mithi River and Possible Solutions. 2011.
- Ali I. Interlinking of Indian rivers. sci. 2004; 86(4):498-499.
Accepted on: 28-04-2021
Second Review by: Dr. Wafaa Hikal
Final Approval by: Dr. Imran Ali


![]()
![]()
