An Interpretable Fuzzy Logic and Artificial Neural Network Decision Support System for Evaluating Short-Chain Fatty Acid–Associated Neuroprotection and Behavioral Decline in Alzheimer’s Disease
 , Jonathan Josué Cid-Galiot1, Alberto Alfonso Aguilar-Lasserre1* , Daniel Cuervo-Zanatta2and Cecilia Elizabeth García-Puga1
1Graduate Studies and Research Division, Instituto Tecnológico de Orizaba, Tecnológico Nacional de México, Orizaba, Veracruz, México.
2Center for Studies and Applied Technology in Health Sciences (CETACS), Córdoba-Orizaba Campus, Anáhuac Veracruz University, Veracruz, Mexico
Corresponding author’s E-mail: albertoaal@hotmail.com
Download this article as:
ABSTRACT:Alzheimer's disease (AD) is a progressive neurodegenerative disorder characterized by cognitive decline, neuroinflammation, and complex alterations involving genetic, metabolic, and environmental factors. In recent years, short-chain fatty acids (SCFAs), derived from gut microbiota fermentation, have attracted particular interest for their potential role in neuroprotective mechanisms and in modulating cognitive decline. In this study, an interpretable computational system, based on Fuzzy Logic (FL) and Artificial Neural Networks (ANN), was developed to analyze patterns of neuroprotection and behavioral loss in a murine model of AD under different dietary and microbial conditions. The Intelligent Decision Support System (IDSS) was built on previously reported experimental evidence from wild-type and transgenic mice fed a control diet, fiber supplementation, or fiber combined with antibiotics. A Mamdani-type fuzzy system was designed to estimate the level of neuroprotection based on acetate, propionate, butyrate, genotype, and diet-related variables, while an artificial neural network was trained to predict behavioral decline based on standard cognitive tests, including the T-Maze, novel object recognition, elevated cross maze, and water maze. The system's purpose was not to replace biological evidence, but rather to organize, simulate, and validate whether the same experimentally observed trend could be reproduced computationally. The results showed that fiber-associated conditions were associated with more favorable neuroprotective profiles, whereas antibiotic-associated conditions were associated with a loss of this benefit. Overall, the proposed system constitutes an interpretable, biologically meaningful tool to support preclinical research on AD and to validate neuroprotective patterns associated with the gut microbiota.
KEYWORDS:Alzheimer's disease (AD); Artificial Neural Networks (ANN); Fuzzy Logic (FL), Intelligent Decision Support System (IDSS); Murine Model, Short-Chain Fatty Acids (SCFAs)
Introduction
Alzheimer’s disease (AD) represents one of the greatest global public health challenges, with a growing prevalence driven by population aging. This neurodegenerative disorder is characterized by progressive cognitive decline, behavioral alterations, and neuronal loss, arising from multifactorial mechanisms including β-amyloid accumulation, oxidative stress, neuroinflammation, and dysregulation of the gut–brain axis.
Recent advances have highlighted the pivotal role of the gut microbiota in modulating the central nervous system (CNS) through the production of short-chain fatty acids (SCFAs)) primarily butyrate, acetate, and propionate (derived from the fermentation of soluble fiber. These metabolites have demonstrated neuroprotective effects in murine models of AD by reducing proinflammatory cytokines such as interleukin-6 (IL-6) and interleukin-1 beta (IL-1β), enhancing synaptic function, and preserving the integrity of the blood–brain barrier.1-5 However, the actions of SCFAs are not uniform: while butyrate consistently exhibits anti-inflammatory properties, propionate may induce neurotoxicity at high concentrations, particularly in transgenic models.3,6 Studies by researchers,1,7,8 show that intestinal dysbiosis and NLRP3 inflammasome activation worsen neuroinflammation and accelerate cognitive decline. More recently researchers,5,6,9 integrated genetic and behavioral variables using adaptive inference systems and fuzzy neural networks. However, most of these approaches remain largely descriptive or statistically linear. This limits their ability to model complex nonlinear biological interactions.
Within this context, fuzzy logic (FL) has emerged as an effective computational paradigm for representing complex biological systems, enabling the qualitative simulation of interactions among diet, genotype, and microbial metabolites, even under conditions of uncertainty or ambiguity.10-12 Its integration with deep learning techniques has given rise to the fuzzy deep learning approach, which enhances model accuracy and interpretability for diagnosing neurodegenerative disorders.6,13 Moreover, artificial neural networks (ANNs) have demonstrated high performance in classifying and predicting cognitive decline from behavioral and neurobiological data. Research,14-16 achieved early and accurate predictions by analyzing multimodal neuroimaging, longitudinal datasets, and clinical variables. Complementarily, ANNs detect motion patterns in murine models with nearly 90% accuracy, providing functional assessments of therapeutic interventions.1,17,20
In this framework, the present study proposes the development of a hybrid artificial intelligence system combining fuzzy logic and artificial neural networks to evaluate and predict cognitive deterioration in murine models of AD. This dual methodology aims to integrate multiple sources of experimental data to simulate expected neuroprotective responses while accurately forecasting behavioral outcomes under different experimental conditions. This approach not only advances beyond prior descriptive models but also holds the potential to serve as an intelligent decision-support tool for biomedical research focused on neurodegenerative diseases.
A citation network was constructed from the studies included in this review to characterize the intellectual architecture of the field (Fig. 1). The network demonstrates a densely interconnected foundational core (2016–2019), comprising key mechanistic studies that established the association between gut microbiota dysbiosis, systemic inflammation, and cognitive decline in AD. The subsequent consolidation phase (2019–2021) is marked by thematic expansion toward biomarker integration and clinical contextualization, while maintaining strong citation continuity with the foundational nucleus. More recent contributions (2022–2025) form a partially distinct yet conceptually anchored cluster, indicating a translational shift toward experimental validation and metabolite-based clinical correlations. Importantly, emerging studies connect preclinical mechanistic insights with human biomarker evidence, further reinforcing the microbiota–brain axis as a central framework in AD research. Overall, the network topology demonstrates a coherent progression, with the field advancing from mechanistic discovery to translational maturation. This progression highlights structural consolidation and a shift toward clinically actionable insights. These patterns establish the microbiota–brain axis as a central organizing paradigm that shapes research trajectories in AD.
Recent advances have shown that the gut microbiota modulates the central nervous system through the production of SCFAs, primarily butyrate, acetate, and propionate, derived from the fermentation of soluble fiber. These have shown neuroprotective effects in murine models of AD by reducing proinflammatory cytokines such as interleukin-6 (IL-6) and interleukin-1 beta (IL-1β), improving synaptic function, and contributing to preserving the integrity of the blood-brain barrier.1–5 However, the actions of SCFAs are not uniform: while butyrate consistently exhibits anti-inflammatory properties, propionate can induce adverse effects at high concentrations, especially in transgenic models. Similarly, researchers,3,6 and previous studies,1,7,8 have shown that gut dysbiosis and activation of the NLRP3 inflammasome can intensify neuroinflammation and accelerate cognitive decline. Researchers such as,5,6,9,24 have begun to integrate genetic and behavioral variables using adaptive inference networks and behavior networks. However, most of these approaches remain primarily descriptive or statistically linear, limiting their ability to capture complex nonlinear biological interactions.
The use of fuzzy models to represent complex biological systems enables qualitative simulation of interactions among diet, genotype, and microbial metabolites, even under conditions of uncertainty or ambiguity.10-12 Their integration with deep learning techniques has led to the approach known as fuzzy deep learning, which has improved the accuracy and interpretability in the diagnosis of neurodegenerative diseases.6,13,26 Furthermore, ANNs have shown high performance in classifying and predicting cognitive decline from behavioral and neurobiological data. Previous researchers,14-16 have achieved early and accurate predictions using multimodal neuroimaging analysis, longitudinal databases, and clinical variables. Motion detection capabilities have been demonstrated in murine models, with an accuracy of approximately 90% for the analysis of therapeutic interventions.1,17
This bilateral methodology integrates multiple sources of experimental data to simulate expected neuroprotective responses and accurately predict behavioral changes across different experimental conditions, using fiber-like structures, FLs, and ANNs. Beyond purely descriptive models, this approach has the potential to serve as an IDSS tool in preclinical marker research on neurodegenerative diseases. In particular, this system aims to provide computational validation of the experimental trend observed by researchers,3 especially regarding the beneficial effect of fiber and the loss of this benefit when the gut microbiota is altered by antibiotics. However, its similarity to current experimental processes opens the door to international validation.
To characterize the intellectual architecture of the field, a citation network was constructed from the studies included in this review (Fig. 1). The network exhibits a densely interconnected foundational core during the period 2016–2019, comprised of key mechanistic studies that established the relationship between gut dysbiosis, systemic inflammation, and cognitive decline in AD. The subsequent consolidation phase (2019–2021) is distinguished by a thematic expansion toward biomarker integration and clinical contextualization, while maintaining strong continuity with the initial core. More recent contributions (2022–2025) form a partially differentiated, though conceptually linked, group, suggesting a transition toward experimental validation and metabolite-based clinical correlations. Importantly, emerging studies are beginning to connect preclinical mechanistic findings with evidence from human biomarkers, further reinforcing the microbiota-brain axis as a central framework in AD research. Overall, the network’s topology shows a coherent evolution of the field, from mechanistic discovery to a stage of translational maturation. This progression reflects a structural consolidation and a growing focus on knowledge with potential clinical applications. These patterns allow us to recognize the microbiota-brain axis as an organizing paradigm that significantly guides current research trajectories in AD.
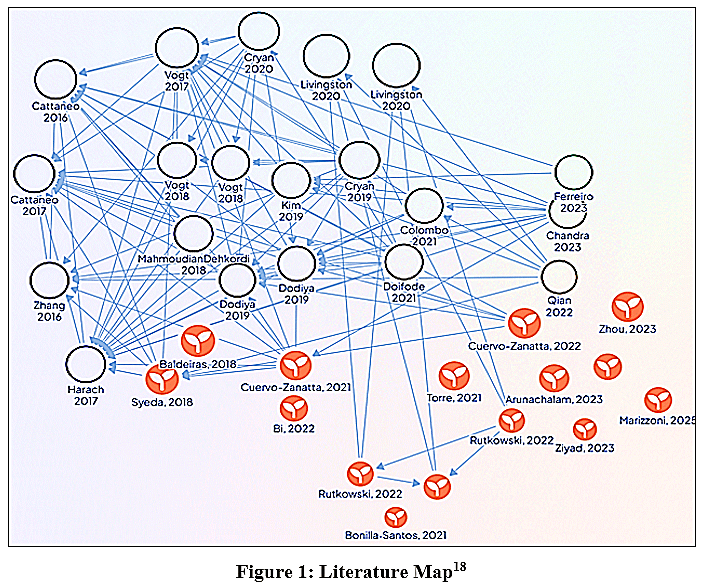 |
Figure 1: Literature Map18 Click here to View Figure |
The comparative analysis presented in Tables 1-A and 1-B highlights convergent evidence supporting the pivotal role of gut-derived SCFAs, neuroinflammation, and advanced computational intelligence in AD research. Studies in Table 1-A demonstrate that dietary fiber and microbial metabolites, particularly butyrate, consistently improve cognitive performance, decrease β-amyloid burden, and attenuate neuroinflammatory markers across murine models.1-3 These effects are abolished under microbiota depletion, reinforcing a mechanistic link between microbial bioactivity and neuroprotection. Complementarily, observational and biomarker-based analyses in humans reveal reduced circulating SCFAs in AD patients, underscoring translational relevance.5
Table 1: A Comparison of Recent Studies on SCFAs, GM, and AI in AD.
|
Application |
Technology | Key Findings |
| Dietary fiber and microbial metabolite receptors in AD.1 | 5xFAD murine model; dietary intervention |
Improved cognition; reduced β-amyloid. |
|
Mechanisms of fiber action on the microbiota–brain axis.2 |
Review of microbiota-dependent and -independent pathways. | Increased dietary fiber SCFAs, reduced inflammation. |
| Prevention of cognitive decline via dietary fiber.3 | Murine AD model; immunohistochemistry and cognitive tests. |
Improved memory; antibiotics removed benefit. |
|
SCFAs in AD.4 |
Review. | Reduced IL-6 and IL-1β. |
| SCFA signaling.19 | Review of SCFA signaling. |
Reduced neuroinflammation. |
|
Genetic–neuroimaging diagnosis of AD.6 |
Graph convolutional neural network | 94% accuracy. |
| Circulating SCFAs in AD.5 | Observational blood-biomarkers study. |
SCFAs decreased in AD. |
|
AD classification |
PiB-PET normalization and CSF Aβ. | Accuracy improved 12–18%. |
| AD detection in mice.21 | Deep learning and motion video analysis. |
89% accuracy. |
|
AD biomarkers.7 |
Systematic multimodal review. |
70% multimodal concordance. |
Table 1-B further underscores the integration of computational and neurophysiological systems to enhance diagnostic accuracy and predict disease progression. Hybrid neuro-fuzzy models, deep learning designs, and biomarker-driven algorithms consistently reach accuracies exceeding 85% in early detection, cognitive stage classification, and longitudinal forecasting.10,14,16 Experimental approaches, including pharmacological modulation and inflammasome profiling.11 Additionally demonstrate the relevance of neuroimmune pathways as treatment targets. Collectively, the evidence supports a dual research pathway in AD: modulation of the gut–brain axis as a metabolic-immune strategy, and adoption of AI-enabled, multimodal frameworks aimed at precision diagnosis and disease modeling. This cooperation positions microbiota-centered interventions and intelligent computational systems as complementary pillars in advancing early-stage therapeutic and diagnostic innovation.8
Table 1B: Computational, neuro-fuzzy, and experimental models in AD.
|
Application |
Technology / Originality | Key Findings |
| Gut–brain inflammation.8 | Murine model. |
Increased inflammatory markers. |
|
Cognitive pattern analysis.9 |
ANFIS. | 92% accuracy. |
| Dementia classification.10 | Fuzzy logic and EEG entropy. |
93% accuracy. |
|
Caffeine in AD.11 |
Murine model | Reduced β-amyloid and improved memory. |
| Cognitive decline prediction.17 | Deep learning. |
88% accuracy. |
|
AD diagnosis.13 |
Fuzzy- deep learning | 88% accuracy. |
| AD progression.12 | Mathematical model |
Reproduced > 85% of trajectories. |
|
AD classification.14 |
Deep learning. | 91% accuracy AUC > 0.90. |
| Early AD prediction.15 | Recurrent neural network. |
87% accuracy. |
|
Prediction of depression-to-AD progression.16 |
Artificial neural networks with structural equation modeling. | Combined model achieved AUC = 0.89 in clinical cohorts. |
| Proposed Bilateral Fuzzy–Neural IDSS | FL integrated with ANN simulation. |
Global R = 0.90608; MSE = 0.003487; SCFAs: acetate 45–60%, butyrate 10–20%, propionate > 25%. |
Purpose
Hybrid fuzzy-neural models outperform classical statistical approaches for predicting behavioral deterioration in AD murine models. The proposed system incorporates biological, dietary, genotypic, and behavioral data, including SCFA levels, diet type, subject genotype, and cognitive test results (T-Maze, NOR, EPM, and WM), to simulate neuroprotective responses and accurately predict behavioral deficits. This methodology is designed to generate reference scenarios for experimental planning, optimize the interpretation of neurobiological data, and support decision-making in preclinical studies of neurodegenerative diseases.
Problem statement
Dietary fiber has been shown to modulate the gut microbiota, generating SCFAs with a potential neuroprotective effect in murine models of AD, as reported in the article.3 However, the effects of these compounds vary depending on diet type, antibiotic presence, animal genotype, and the SCFA concentrations achieved, complicating the interpretation of results. This complexity poses the challenge of integrating multiple experimental and physiological variables into an intelligent analysis system that enables the estimation of expected responses and the generation of consistent reference values. Traditional statistical approaches fail to adequately capture the nonlinear interactions between variables.
In this context, an FL system allows for the simulation of rule-based scenarios, integrating variables such as diet, genotype, and SCFAs. In turn, ANNs offer a predictive tool for estimating behavioral deterioration from empirical data obtained in tests such as the T-Maze, NOR, EPM, and WM.
Therefore, the central problem identified is the lack of an integrated methodology that allows, on the one hand, the simulation of complex experimental conditions and, on the other hand, the prediction of behavioral impact in murine models of AD, thereby strengthening preclinical analysis and experimental decision-making.
Findings and Practical implications
The hybrid model developed integrated expert knowledge in biomedicine, experimental evidence, and behavioral data to comprehensively assess cognitive decline in mice with AD. Using the FL system, specific combinations of SCAFs (particularly butyrate and acetate) in the presence of a high-fiber diet and certain genotypes were identified as inducing neuroprotective responses exceeding 65%. In contrast, propionate showed adverse effects in scenarios with altered diets and transgenic genotypes.
Meanwhile, the ANN trained on behavioral test data (T-MAZE, NOR, EPM, WM) accurately predicted the percentage of behavioral loss, achieving correlation coefficients (R) greater than 0.90608 in both the validation and test sets. Sensitivity analysis revealed that spatial memory and anxiety were the dimensions with the greatest impact on predicting decline. Taken together, these findings align with the experimental trend reported by researchers,3 in which fiber was associated with a more protective environment, while alterations in the gut microbiota reduced that benefit. The IDSS proved capable of simulating diverse physiological and dietary contexts, identifying input combinations that maximize neuroprotection or, conversely, accelerate deterioration. These findings reinforce the need to adopt multivariate approaches to understand the nonlinear interactions among diet, microbiota, genotype, and behavior, and to provide useful tools for the design of future experimental studies.
Practical Implications
The proposed IDSS enables computational simulation-based optimization of dietary, metabolic, and genetic interventions in murine models of AD. By integrating fuzzy inference with ANN-based behavioral prediction, the system identifies potential windows of neuroprotection and recognizes experimental conditions with the greatest biological impact before validation in in vivo studies. From a preclinical perspective, this is relevant because it facilitates the organization and interpretation of complex scenarios in which diet, gut microbiota, genotype, and behavior interact.
Furthermore, this approach can help reduce reliance on trial-and-error experimental designs, favoring more targeted designs with stronger pathophysiological support. In this sense, the system does not replace biological experiments but rather acts as a complementary tool to support study planning and the selection of experimental conditions with a higher probability of generating neuroprotective responses or, conversely, of demonstrating greater functional impairment. This is important in the researchers’ study,3 as it enables computational validation of the trend between fiber supplementation, gut microbiota integrity, and modulation of the functional response in the murine model of AD.
Originality/Value
This study describes a paradigm-shifting bilateral computational system that unifies FL and ANNs to model age-related cognitive decline in murine systems. By validating biological trends previously observed experimentally by researchers,3 and treating diet, genotype, and short-chain fatty acids as isolated variables, the proposed architecture represents their nonlinear interactions. It also captures their dependence on biological context and their combined effects on neuroprotection and behavioral decline. In this way, the system combines the interpretability derived from rules built on expert knowledge with the predictive capacity of learning from experimental data, which can be reproduced in an intelligent modeling environment. Therefore, rather than replacing biological evidence, the system acts as a tool for computational organization, interpretation, and validation.
Modeling own experimental data “Animal management and health status was supervised by licensed veterinary care and approved by the Bioethics Committee of the Center for Research and Advanced Studies of the National Polytechnic Institute (Protocol No. 235–16), in accordance with the Mexican official standard NOM-062-ZOO-1999 and the principles set forth in the 8th edition of the National Institute of Health (NIH) guide for the care and use of laboratory animals and endorsed by the Institute for Laboratory Animal Research, the Division on Earth and Life studies and the National Research Council of the National Academies”.3 Collectively, this work reframes computational prediction in AD research from descriptive analysis to predictive systems-level intelligence.
Materials and Methods
FL and ANNs were used to develop the IDSS. The fuzzy system employed experimental data reported in the research to simulate the level of neuroprotection in mice with AD,3 integrating information on diet type, animal genotype, and SCFA concentrations (acetate, propionate, and butyrate). To model the neuroprotective effects of short-chain fatty acids (SCFAs), the relative proportions of acetate, propionate, and butyrate were calculated from fecal samples collected from mice. The absolute concentrations of these compounds were determined by gas chromatography and expressed as micrograms per gram of feces (μg/g). From these concentrations, the samples were calculated, and their contributions to the total SCFAs were estimated.
Table 2 summarizes the equations used to calculate the relative proportion of acetate, propionate, and butyrate with respect to the total SCFAs quantified in each sample. Equation (1) expresses the percentage of acetate as the ratio between its individual concentration and the total sum of SCFAs. Since acetate is the most abundant SCFA produced by the gut microbiota, its relative abundance allows identification of variations in fermentative profiles associated with diet and the genotype of the murine model. Equation (2) calculates the relative fraction of propionate within the total SCFAs, facilitating the comparison of its contribution among dietary treatments and experimental genotypes. Equation (3) determines the relative proportion of butyrate, a SCFA of particular interest due to its reported neuroprotective effect. Its quantification enables evaluation of whether specific dietary treatments or microbial profiles favor its production in the murine model of AD.
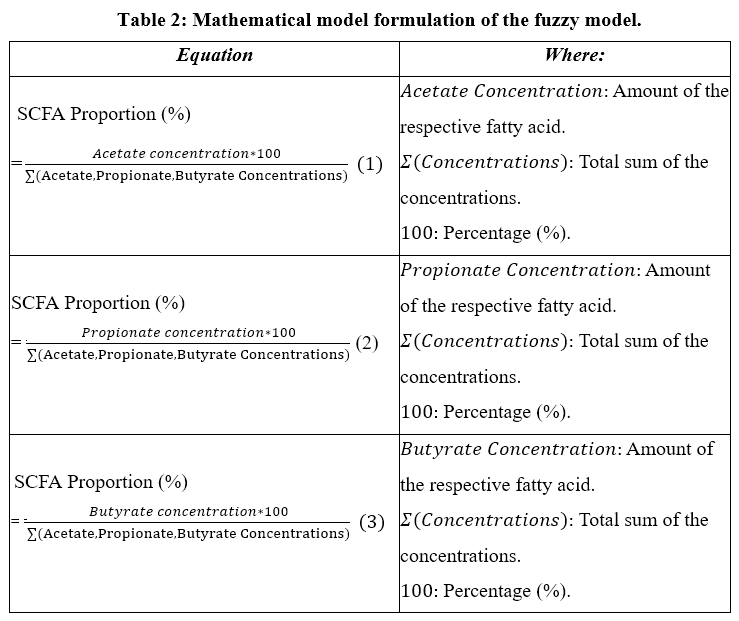 |
Table 2: Mathematical model formulation of the fuzzy model. Click here to View Table |
Table 3 summarizes a sample of the experimental sets used with 40 mice to define the input scenarios for the FL system, which processes and analyzes metabolic data collected from the different working groups, yielding 4320 metabolic observations. Set [A] (WT) includes control mice without genetic modifications or induced AD, fed a control diet. The resulting SCFA profiles represent basal intestinal production in a healthy organism and were used as a reference to establish the high neuroprotection threshold. [B] (Tg) corresponds to transgenic mice with induced AD, maintained on the same control diet. This group allowed evaluation of the effect of genotype alone on SCFA production and served as a direct comparison with the WT group. [C] (Tg + fiber) includes transgenic mice fed a fiber-enriched diet. This intervention increased SCFA production, particularly butyrate, enabling the modeling of intermediate neuroprotection scenarios. [D] (Tg + fiber + antibiotics) presents the SCFA profiles of transgenic mice treated with a high-fiber diet combined with an antibiotic cocktail. This group was key to simulating conditions of intestinal dysbiosis and reduced neuroactive metabolites, contributing to the definition of low neuroprotection scenarios. These results are consistent with previous reports associating antibiotic use and fiber deficiency with neuroimmune alterations and cognitive impairment in transgenic mouse models.3
Table 3: SCFA profiles by group: values are expressed as mean ± standard deviation.
|
Group |
Condition | n | Acetate (%) | Propionate (%) | Butyrate (%) |
| A | WT-C | 10 | 66.87 ± 15.77 | 19.98 ± 11.64 |
13.15 ± 9.51 |
|
B |
Tg-C | 10 | 68.75 ± 9.28 | 18.22 ± 8.49 | 13.03 ± 8.27 |
| C | Tg-F | 10 | 73.78 ± 7.64 | 15.99 ± 6.64 |
10.24 ± 2.86 |
|
D |
Tg-F-ABX | 10 | 68.30 ± 7.06 | 22.12 ± 8.60 |
9.58 ± 4.88 |
Combination of experimental conditions was translated into a set of inputs for the fuzzy system, using appropriate membership functions. Genotypic variables were modeled with sigmoidal functions; dietary variables with trapezoidal functions; and SCFAs with a combination of trapezoidal, Gaussian, and sigmoidal functions, depending on the semantic range. To control the experimental conditions and more accurately understand the individual effects of each component administered to the murine models, the representative chemical composition of the main elements used in the study was compiled (see Table 4 A). This characterization included dietary supplements (starch, cellulose, fructans, vitamins), SCFAs, and antibiotics used to induce intestinal dysbiosis.
Table 4 [A] Experimental compounds.
| [A] | |||
|
Variables |
Formule | Variables | Formule |
| Corn Starch | (C6 H10 O5)n +H_2 |
Tertiary Butylhydroquinone (TBHQ) | C10 H14 O2 |
|
Casein |
C81 H125 N2 O39P | Energy | Q = mcΔT |
| Maltodextrin | C6n H(10n+2) O(5n+1) |
Fructans Derived from Agave tequilana (F) |
(C6H10O5)n + (n – 1) H2O |
|
Soybean Oil |
C3 H5(OOCR)3 | Ampicillin | C16H19N3O4S |
| Sucrose | C12 H22 O11 |
Neomycina |
C23H46N6O13 |
|
Cellulose |
(C6 H10 O5)n | Metronidazole | C6H9N3O3 |
| L-Cysteine | C3H7 NO2S |
Vancomycin |
C66H75Cl2N9O24 |
|
Choline |
C9H19NO7 |
|
|
The simulations were performed in MATLAB® using the Fuzzy Logic Designer tool. Surface plots were generated from these simulations to visualize the interaction between input and output variables. These plots were fundamental in identifying combinations of experimental conditions with the greatest neuroprotective effect. The developed fuzzy system is based on fuzzy set theory and uses mathematical functions to transform quantitative variables into linguistic information with a degree of membership.22 The behavior of the Mandani mathematical model is described in Table 4 B.
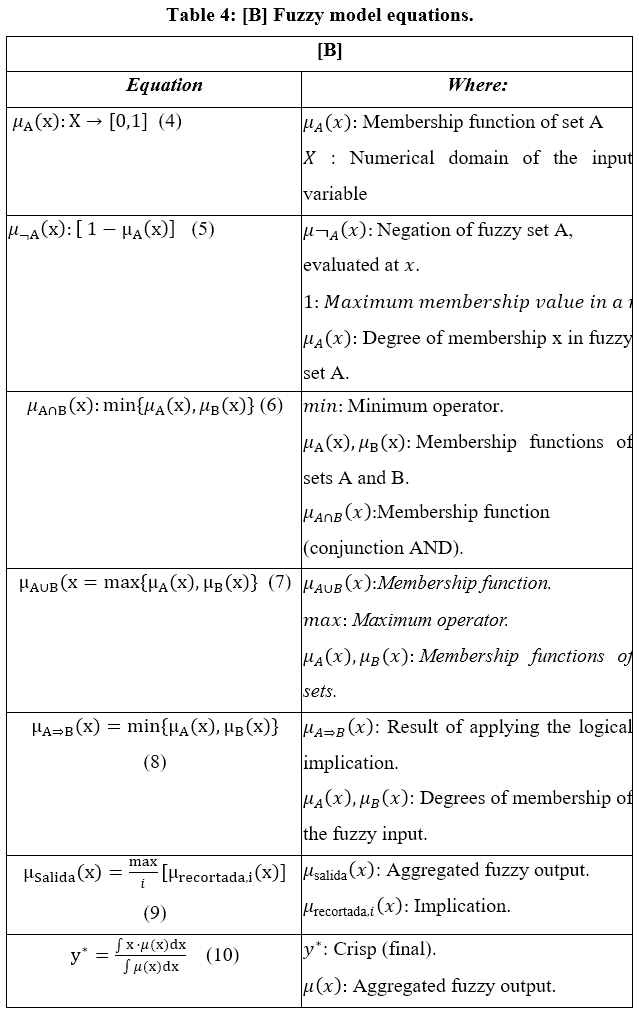 |
Table 4:[B] Fuzzy model equations. Click here to View Table |
In addition to the FL system developed to simulate experimental conditions, a neural network model was constructed to predict the percentage of behavioral change loss in mice with AD, utilizing data from 1761 laboratory behavioral test observations. The model was developed in MATLAB® using a multilayer feedforward perceptron architecture and trained with the Levenberg-Marquardt algorithm. The network was designed with a hidden layer of 10 neurons and an output layer with linear activation. The inputs used were the results of four cognitive tests that evaluate different dimensions of behavior: T-MAZE, which assesses working memory and the animal’s capacity for spontaneous switching. Under normal conditions, a mouse tends to switch between arms while exploring, showing its ability to remember which direction it previously took. Thus, a higher percentage of switching is associated with better cognitive function. NOR (Novel Object Recognition): measures recognition memory. The animal is expected to explore the novel object more; a preference toward the familiar object suggests episodic memory loss, a common feature of AD. EPM (Elevated Plus Maze, Open Arms): assesses anxiety and exploration levels. Remaining with open arms indicates less anxiety; avoiding them reflects anxious behavior, common in neurocognitive impairment. WM (Water Maze): measures long-term spatial memory. A longer latency or time to complete the task indicates impaired learning and retention (See Table 5 A).
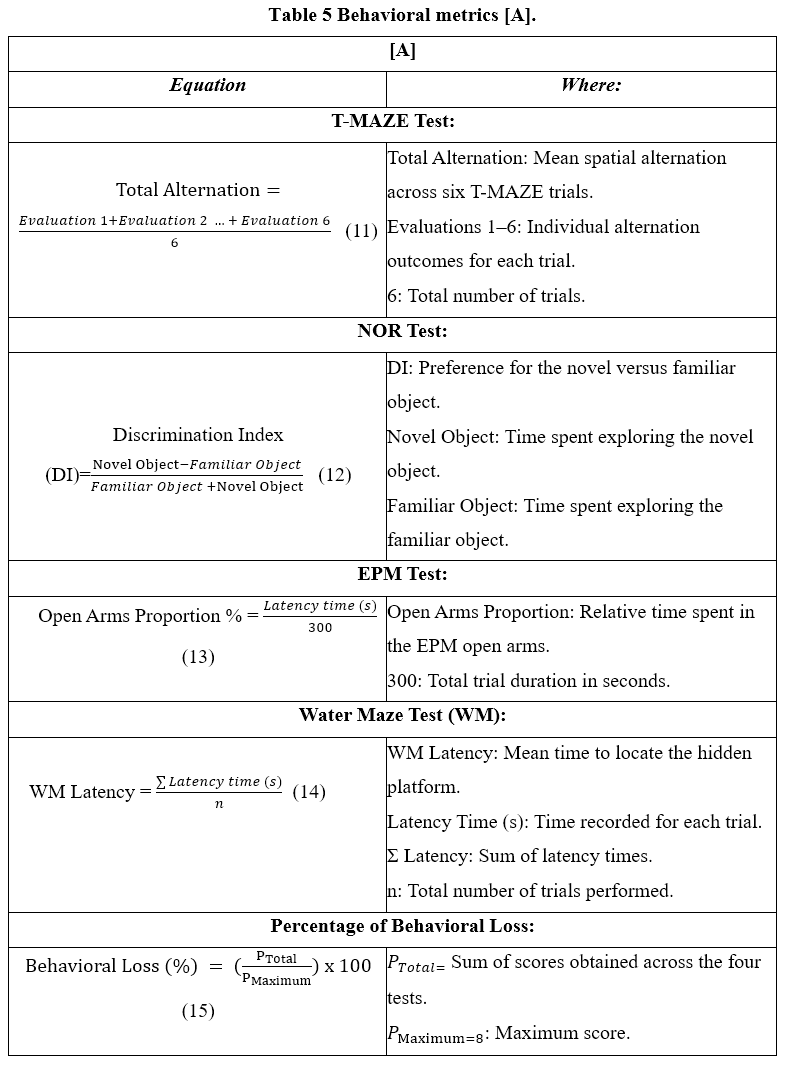 |
Table 5: Behavioral metrics [A]. Click here to View Table |
Five quantitative variables obtained from neurobehavioral tests performed on mice were considered: T-MAZE, NOR, EPM, WM, Treatment/genotype code (identifier of the experimental group), and one output variable: Loss in behavior change (%), calculated based on a metric defined by its reference behavior [B].
Table 5: Scoring criteria [B].
| [B] | |||
| Variable | Value Range | Interpretation | Assigned Score |
| T-MAZE | > 30% | Good working memory | 0 points |
| 20% – 30% | Intermediate memory | 1 points | |
| < 20% | Cognitive impairment | 2 points | |
| NOR | > 0.05 | Greater exploration of the novel object | 0 points |
| -0.05 a 0.05 | Neutral or uncertain exploration | 1 points | |
| < -0.05 | Preference for familiar object (impairment)) | 2 points | |
| EPM | > 0.40 | Low anxiety (greater exploration) | 0 points |
| 0.25 – 0.40 | Moderate anxiety | 1 points | |
| < 0.25 | High anxiety (avoidance behavior) | 2 points | |
|
WM |
< 25 s | Good spatial memory | 0 points |
| 25 – 35 s | Regular memory performance | 1 points | |
| > 35 s | Cognitive impairment | 2 points | |
Table 6 presents the mathematical foundation underlying the ANN used in this study. This development allows for a clearer understanding of how the input variables are transformed through the network layers, how the activation functions are applied, and how the weights are adjusted through backpropagation. This foundation draws on classical formulations widely accepted in the literature, particularly those proposed by researchers,23 and justifies the approach used to model and train the predictive system.
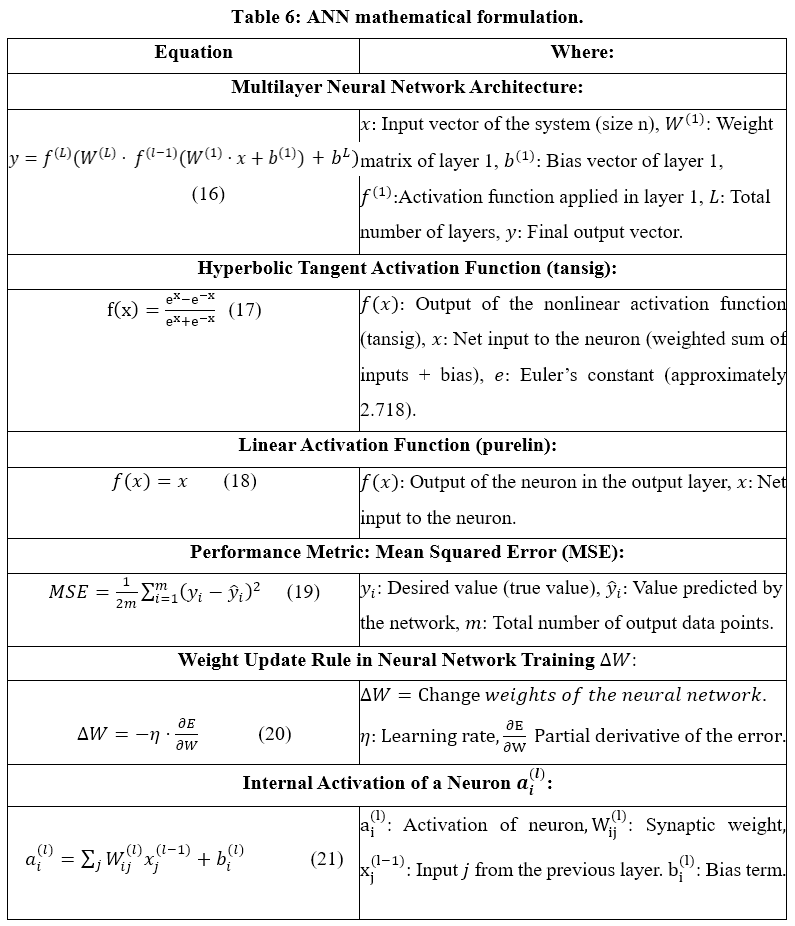 |
Table 6: ANN mathematical formulation. Click here to View Table |
The proposed methodology began with a systematic literature review and consisted of five stages: Data Analysis, Finitization and Normalization, Modeling, Testing, Validation, Results, and Reliability Testing. This structure allowed for the integration of experimental, metabolic, dietary, genotypic, and behavioral information within a rigorous, reproducible, and biologically interpretable methodological framework (see Figure 2).
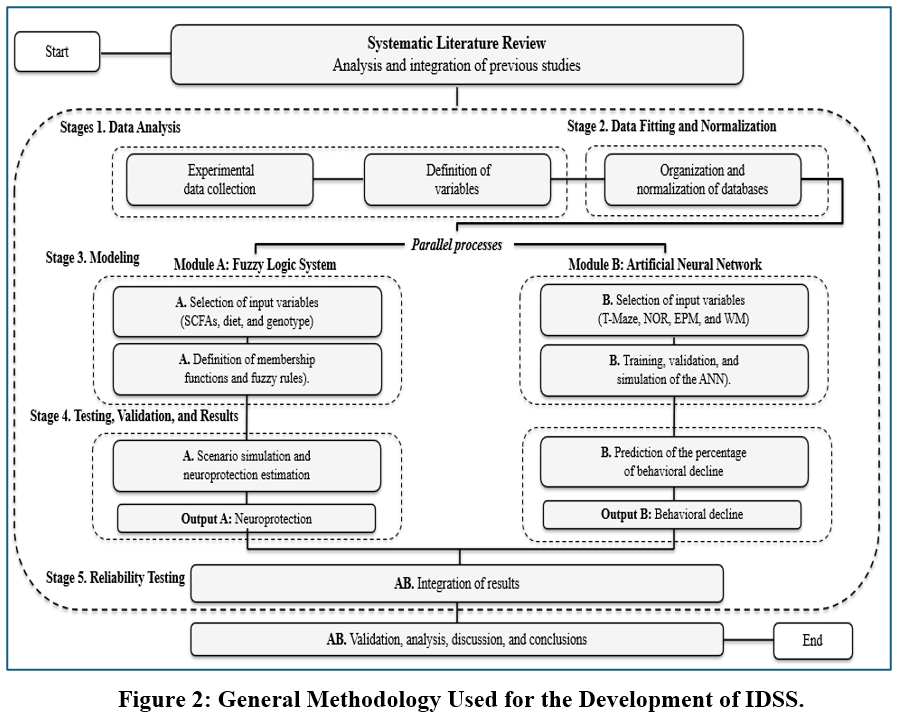 |
Figure 2: General Methodology Used for the Development of IDSS. Click here to View Figure |
Development of the IDSS
Intelligent Fuzzy Logic System
Step 1. Data Analysis.
A working session was held with specialists in Biomedicine and AI, in which the main problem identified was the lack of predictive models capable of integrating multiple physiological, dietary, and genetic variables in AD research. Based on this, it was proposed to develop an FL-based system to simulate complex experimental conditions and estimate the neuroprotective response across different factor combinations. Data derived from the experimental study were used,3 including concentrations of SCFAs (acetate, propionate, and butyrate), diet types (control, fiber, fiber + antibiotics), and genotypes. These variables were complemented with experimental outputs on neuroprotection to feed the IDSS.
Step 2. Data Fitting and Normalization.
Seven input variables and one output variable were defined. The membership functions were designed considering the nature of each variable: sigmoidal, trapezoidal, and Gaussian functions were used to represent diverse conditions in the experimental tests. Dietary variables were modeled solely as trapezoidal functions due to their dosed behavior.
Step 3. Modeling.
An if-then rules were established, formulated based on physiological knowledge and experimental evidence. These rules allowed for the representation of nonlinear interactions among variables and the simulation of the biological system’s adaptive responses to various combinations of conditions.
Step 4. Testing, Validation, and Results.
The system was implemented using the FL Designer tool in MATLAB®, under a Mamdani-type scheme. The logical operators, aggregation functions, and defuzzification method (centroid) were configured, ensuring a continuous, realistic response for each input combination.
Step 5. Reliability Testing.
Systematic simulations were performed across different input combinations to observe the model’s behavior. Response surfaces allowed visualization of how the variables interact and how they affect the level of neuroprotection, facilitating the interpretation of trends and non-obvious relationships. The system was reviewed and validated by experts who evaluated the rules’ logic, the consistency of the simulated results, and the model’s usefulness as a tool to support experimental decision-making in AD studies.
The development of the fuzzy system began with the collection of experimental data from the murine model with AD (see Tables 2 and 3). Specifically, this included SCFA concentrations (acetate, propionate, and butyrate), the dietary conditions (control, fiber, and fiber + antibiotics), and the animals’ genotype. Subsequently, parameters were established for the linguistic variables, categorized as (very low, low, considerable, high, and very high) for SCFAs, and as (low, standard, and exceeded) for the diets. For the genotype, binary values were used (WT = -1, Tg = 1). The output variable, “neuroprotection,” was defined as (very low, low, moderate, high, and very high). Each variable was modeled with specific membership functions: sigmoidal for extreme values, trapezoidal for intermediate values, and Gaussian for central (considerable) values. The data were entered into the MATLAB® software, including its membership functions and 810 fuzzy rules established by experts. Once the Mandani system structure was loaded, the simulation analysis was performed using experimental scenarios linked to the fuzzy inference engine. The inference rules were designed to cover combinations of SCFA levels, diet type, and genotype, with the aim of estimating the expected level of neuroprotection for each case, as determined by the defuzzification process. Each combination was evaluated using the fuzzy inference engine, yielding a continuous output ranging from 0 to 100, corresponding to the degree of neuronal protection. In this way, it was analyzed whether the trends observed experimentally by researchers,3 could be reproduced consistently in a computational environment. Table 7 describe the fuzzy model variables and their architecture.
Table 7: Fuzzy-variable parameters.
| Variable | Type | Range | Fuzzy sets (MF) | Parameters |
| Acetate | Input | 0–100 | VL (1-Γ); L (Trap); M (Gauss); H (Trap); VH (Γ) | [0,0.01,19.99,20]; [19.99,20.01,39.99,40]; [10,50]; [49.99,50.01,89.99,90]; [89.99,90.01,99.99,100] |
| Propionate | Input | 0–40 | VL (1-Γ); L (Trap); M (Gauss); H (Trap); VH (Γ) | [0,0.01,7.99,8]; [7.99,8.01,13.99,14]; [2.75,20]; [19.99,20.01,33.99,34]; [33.99,34.01,39.99,40] |
| Butyrate | Input | 0–30 | VL (1-Γ); L (Trap); M (Gauss); H (Trap); VH (Γ) | [0,0.01,4.99,5]; [4.99,5.01,9.99,10]; [3,15]; [14.99,15.01,26.99,27]; [26.99,27.01,29.99,30] |
| Genotype | Input | −1–1 | WT (1-Γ); Tg (Γ) | [−1,−0.99,−0.01,0]; [0,0.01,0.99,1] |
| Control Diet | Input | 0–7 | LD (1-Γ); S (Trap); E (Γ) | [0,0.01,3.49,3.50]; [3.49,3.51,5.99,6]; [5.99,6.01,7.49,7.50] |
| Fiber Diet | Input | 0–7 | LD (1-Γ); S (Trap); E (Γ) | [0,0.01,2.99,3]; [2.99,3.01,5.99,6]; [5.99,6.01,7.49,7] |
| Fiber Diet + ABX | Input | 0–6 | LD (1-Γ); S (Trap); E (Γ) | [0,0.01,2.49,2.50]; [2.49,2.51,4.49,4.50]; [4.49,4.51,5.49,5.50] |
| Neuroprotection | Output | 0–100 | VL (1-Γ); L (Trap); C (Trap); H (Trap); VH (Γ) | [0,0.01,10.99,20]; [10.99,20.01,39.99,40]; [39.99,40.01,69.99,70]; [69.99,70.01,84.99,85]; [84.99,85.01,99.99,100] |
VL: Very Low; L: Low; M: Medium; C: Considerable; H: High; VH: Very High; LD: Low Dose; S: Standard; E: Excessive; Trap: trapezoidal; Gauss: Gaussian; Γ: gamma membership function.
The figure illustrates the architecture of the Mamdani fuzzy inference system used to estimate neuroprotection. The model integrates seven input variables: acetate, propionate, butyrate, genotype, control diet, fiber diet, and fiber diet combined with antibiotics. These inputs are transformed through the fuzzification stage and processed by the inference unit using the knowledge base, which contains experimental data, expert knowledge, and the fuzzy rule base. The resulting fuzzy outputs are then converted into a crisp value through the defuzzification stage, producing the final neuroprotection estimate.
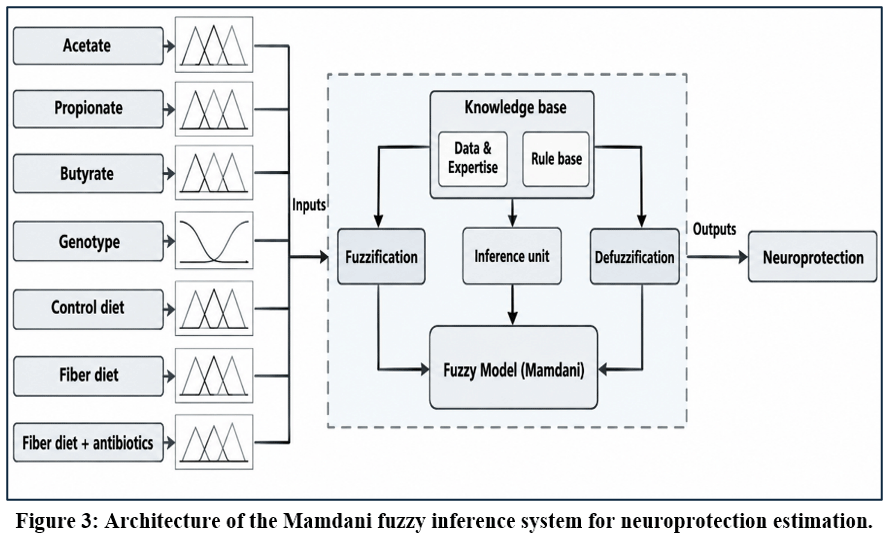 |
Figure 3: Architecture of the Mamdani fuzzy inference system for neuroprotection estimation. Click here to View Figure |
Intelligent Neural System
Step 1. Data Analysis.
Four behavioral tests widely used in murine models of AD were selected: T-Maze, NOR, EPM, and WM. These tests assess aspects of cognitive impairment and anxiety, generating key data for the behavioral characterization of patients. A database was structured so that each row corresponds to an individual and their experimental records, organized in a matrix and normalized.
Step 2. Data Adjustment and Normalization.
Evaluation criteria based on physiological ranges were assigned to each test, and impairment scores were assigned. The sum of these values allowed for the estimation of a behavioral loss index, expressed as a percentage, which was used as the output variable for supervised training.
Step 3. Modeling.
The data were modeled in MATLAB®, where they were assigned as input vectors (behavioral tests) and output vectors (percentage of behavior loss), facilitating network training and validation. A multi-layered feedforward ANN was designed, with one hidden layer and a nonlinear activation function. The Levenberg–Marquardt training algorithm was used, suitable for prediction problems requiring high accuracy and low generalization error.
Step 4. Testing, Validation, and Results.
The database was randomly divided into three subsets: training, validation, and testing. During the process, the network’s synaptic weights were adjusted to minimize the error between the expected and predicted output, using backpropagation and performance evaluation at each stage. The network’s performance was evaluated using correlation and mean-squared-error analyses, as well as graphical representations such as linear regression, histograms, and performance curves by epoch. These metrics enabled validation of the model’s predictive capacity.
Step 5. Reliability Testing.
Once trained and validated, the network was used to predict new or simulated data. The results were interpreted, highlighting its ability to estimate behavioral loss from the applied tests, and were compared with the FL system’s patterns. The ANN not only provided predictive power but also strengthened computational validation of the trend researchers observed experimentally.3
Table 8 presents the neural model developed from 801 neurobehavioral test records of mice with AD: Anxiety (assessed using EPM), Recognition Memory (NOR), Spatial Memory (T-MAZE), and Water Maze (WM), classified by treatment/genotype code (experimental group identifier) to obtain the outcome variable: Loss in behavioral change (%), calculated based on a scoring system established from physiologically relevant ranges for each test. Subsequently, the data were normalized, imported into MATLAB®, and used to train the network.
Table 8: ANN parameters and normalized data sample.
| Experimental group | Mouse ID | T-MAZE | NOR | EPM | WM | Behavioral decline |
| WT/Control | 1.20 | 0.1667 | 0.00453 | 0.0045 | 0.00260 | 0.00260 |
| WT/Control | 2.8 | 0.3333 | 0.00426 | 0.0027 | 0.00129 | 0.00129 |
| Tg/Control | 4.29 | 0.1667 | −0.00022 | 0.0053 | 0.00625 | 0.00625 |
| Tg/Control | 5.27 | 0.1667 | 0.00541 | 0.0057 | 0.00251 | 0.00251 |
| Tg/Fiber | 2.25 | 0.6667 | 0.00413 | 0.0047 | 0.00101 | 0.00101 |
| Tg/Fiber | 5.21 | 0.6667 | 0.00482 | 0.0041 | 0.00129 | 0.00129 |
| Tg/Fiber + ABX | 2.27 | 0.0000 | −0.00232 | 0.0005 | 0.00999 | 0.00999 |
| Tg/Fiber + ABX | 4.20 | 0.3333 | 0.00339 | 0.0045 | 0.00262 | 0.00262 |
Various training methods were compared to identify performance rates, with the feed-forward type standing out. This method, designed with a hidden layer of 10 neurons and an output layer with linear activation, used a Levenberg–Marquardt learning algorithm to train the network. It offers an ideal balance between training speed and accuracy for problems with small to medium-sized datasets. This algorithm converges faster than other methods, such as conjugate gradient descent, and is more accurate than Bayesian regularization in terms of mean squared error (MSE). Furthermore, it allows better adaptation to experimental data patterns with fewer computing resources, rendering it ideal for biomedical applications with multiple variables and nonlinear behavior.
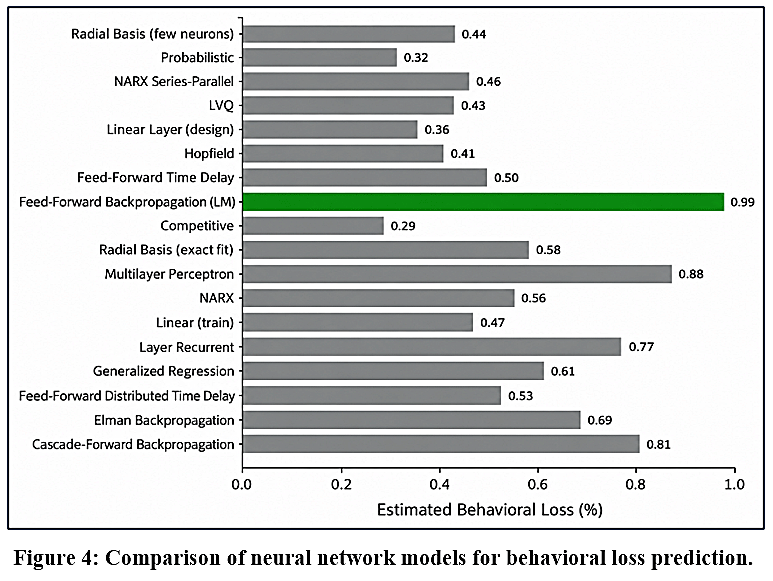 |
Figure 4: Comparison of neural network models for behavioral loss prediction. Click here to View Figure |
The architecture employed is a multilayer perceptron (MLP) with backpropagation as the training algorithm and sigmoidal activation in the hidden layers and linear activation in the output layer, and its accuracy is assessed through error analysis and regression plots.
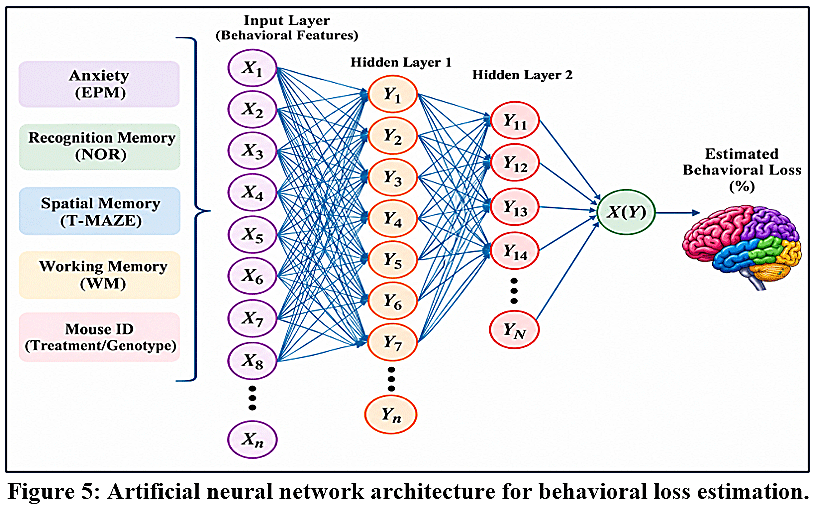 |
Figure 5: Artificial neural network architecture for behavioral loss estimation. Click here to View Figure |
Results
Response Surface Analysis
Once the Mamdani fuzzy model was implemented in MATLAB®, parametric simulations were conducted to evaluate the continuous neuroprotection output (0–100%) across different combinations of SCFAs (acetate, propionate, and butyrate), genotype (WT/Tg), and dietary conditions. The generated three-dimensional response surfaces revealed nonlinear interactions and context-dependent modulation among metabolic and biological variables (See Figure 3).
Propionate vs. Acetate
Maximum neuroprotection (>65%) was predicted when acetate ranged between 45–60% and propionate between 10–20%, indicating an optimal joint metabolic window. Extreme concentrations of either metabolite reduced the response (<40%), demonstrating a nonlinear dependency in which the effect of one SCFA depends on the relative concentration of the other. The model effectively captured this functional ambiguity, consistent with the reported epigenetic regulatory role of acetate and the potential pro-inflammatory effects of elevated propionate levels.
Butyrate vs. Acetate
A synergistic region was identified, with neuroprotection exceeding 80% when acetate remained within 45–60% and butyrate within 12–18%. Deviations outside these ranges significantly decreased the response (<40%), even when acetate levels were moderate. These findings confirm a context-dependent interaction requiring physiologically balanced concentrations of both SCFAs to maximize neuroprotective effects.
Butyrate vs. Propionate
The highest simulated response (~90%) occurred when propionate was maintained between 10–18% and butyrate between 12–20%, suggesting a coordinated regulatory window. Extreme concentrations of either metabolite attenuated neuroprotection (<40%), reflecting compensatory and relational effects. The model reproduces the synergistic neuroprotective effect of butyrate under controlled conditions and its potential limitations in metabolically unfavorable conditions.
Genotype vs. Butyrate
Genotype significantly modulated butyrate’s effect. In WT models, intermediate concentrations (12–25%) induced elevated neuroprotection (~70%), whereas in Tg models, the response was attenuated (35–45%) and decreased to ~15% under extreme conditions. These results indicate that genetic context acts as a critical modulatory filter, limiting neuroprotective efficacy in AD models. The nonlinear dynamics observed between continuous (SCFAs) and categorical (genotype) variables support the suitability of fuzzy logic to model complex biological systems.
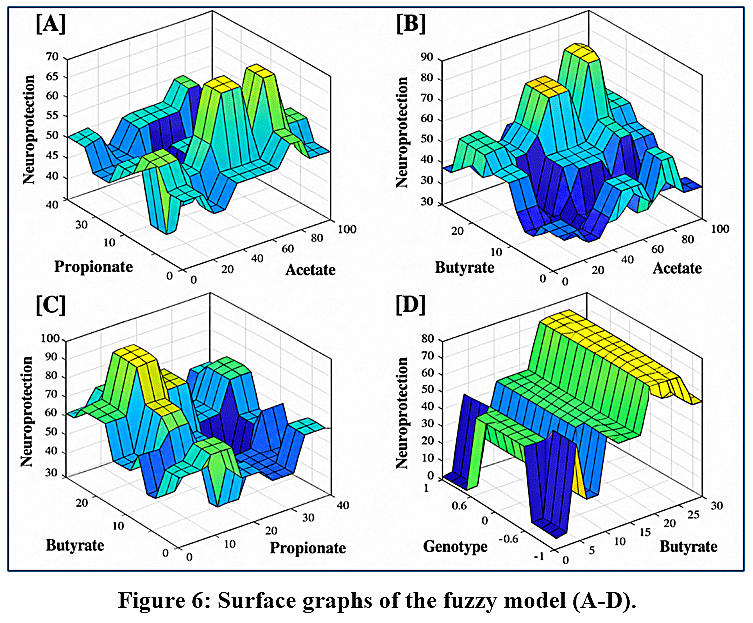 |
Figure 6: Surface graphs of the fuzzy model (A-D). Click here to View Figure |
Genotype vs. Propionate
The neuroprotective effect of propionate was strongly genotype-dependent, though distinct from the pattern observed for butyrate. In WT models, propionate exhibited a stable, beneficial window of 10–20%, reaching predicted neuroprotective levels of up to 60%. In contrast, Tg models showed a progressive decline in neuroprotection as propionate increased, with concentrations above 25% reducing the response below 30%. These findings indicate a genotype-dependent divergence: while WT models tolerate and benefit from moderate propionate levels, Tg models display reduced or potentially adverse responses at higher concentrations. The model therefore suggests that propionate is not a universal neuroprotective agent, and its efficacy depends on both dosage balance and genetic context.
Genotype vs. Acetate
Acetate’s neuroprotective impact also varied by genotype, but the contrast was subtler than with propionate. In WT models, 40–60% acetate induced a robust response (up to 58%). In Tg models, by contrast, neuroprotection was consistently lower, staying below 45% and dropping off at both low (<20%) and high (>70%) acetate levels. Thus, acetate exhibits more stable neuroprotective effects in WT models, whereas its effects are muted in Alzheimer-like genotypes, likely due to underlying inflammatory or metabolic factors. This comparison underlines that precise dosage control is more crucial in pathological settings.
Control Diet vs. Acetate
Maximum neuroprotection (~59%) was predicted when acetate ranged between 40–60% under standard control diet conditions (~3.5 g). Nutritional imbalance—either restriction or excess—attenuated the beneficial effect, even within the optimal acetate window. This pattern indicates that acetate-mediated neuroprotection is highly sensitive to dietary context, reinforcing the importance of systemic metabolic balance for effective microbiota-derived interventions.
Fiber Diet vs. Acetate
Combining acetate with dietary fiber results in a clear potentiating effect. The model predicts optimal levels of neuroprotection (58–60%) more consistently within the same acetate range (40–70%), even with slight variations in fiber dosage. This demonstrates that fiber acts as a favorable physiological modulator, promoting a microbial environment that enhances the conversion of fiber into functional SCFAs.
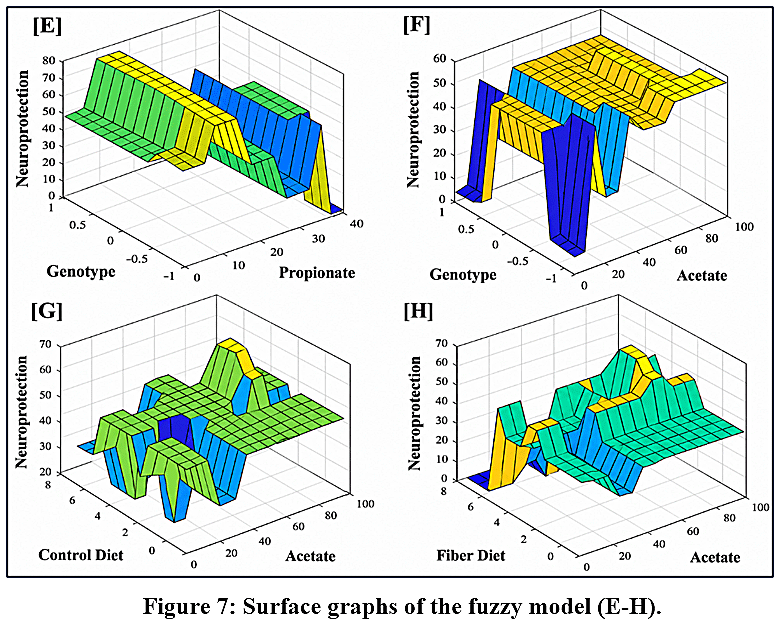 |
Figure 7: Surface graphs of the fuzzy model (E-H). Click here to View Figure |
Fiber Diet + Antibiotics vs. Acetate
A marked attenuation of acetate-mediated neuroprotection was observed under fiber supplementation combined with antibiotics. Although a modest peak (~52%) occurred at ~60% acetate, the response surface remained largely flattened, indicating reduced sensitivity across concentrations. This pattern suggests that antibiotic-induced disruption of the microbiota diminishes acetate efficacy, likely by impairing synergistic interactions with other SCFAs, such as butyrate. While acetate retains intrinsic neuroprotective potential, its effectiveness is strongly dependent on the integrity of the microbiota and the nutritional context.
Control Diet vs. Propionate
Under standard dietary conditions, propionate between 10–20% was associated with neuroprotection levels of 60–70%. However, dietary imbalance (restriction or excess) substantially reduced this benefit, flattening the response surface and lowering predicted outputs. These findings indicate that diet modulates not only propionate availability but also its functional neuroprotective expression, reinforcing the importance of metabolic homeostasis.
Fiber Diet vs. Propionate
Fiber supplementation generated a more favorable response profile. Neuroprotection exceeded 70% when propionate remained below 15%, whereas higher concentrations attenuated the effect. This pattern aligns with reported evidence that fiber modulates SCFA balance, reducing the pro-inflammatory potential of elevated propionate while enhancing overall neuroprotective signaling. The model captures this beneficial modulation by clearly elevating the response surface within the optimal range.
Fiber Diet + Antibiotics vs Propionate
In contrast, combining fiber with antibiotics resulted in an almost flat surface (~50% neuroprotection), independent of propionate levels. This indicates a near-complete loss of fiber-induced modulation, likely due to disruption of the microbiota. Despite adequate substrate availability, antibiotic exposure abolished the synergistic interaction, emphasizing that dietary interventions require an intact microbial ecosystem to exert neuroprotective effects.
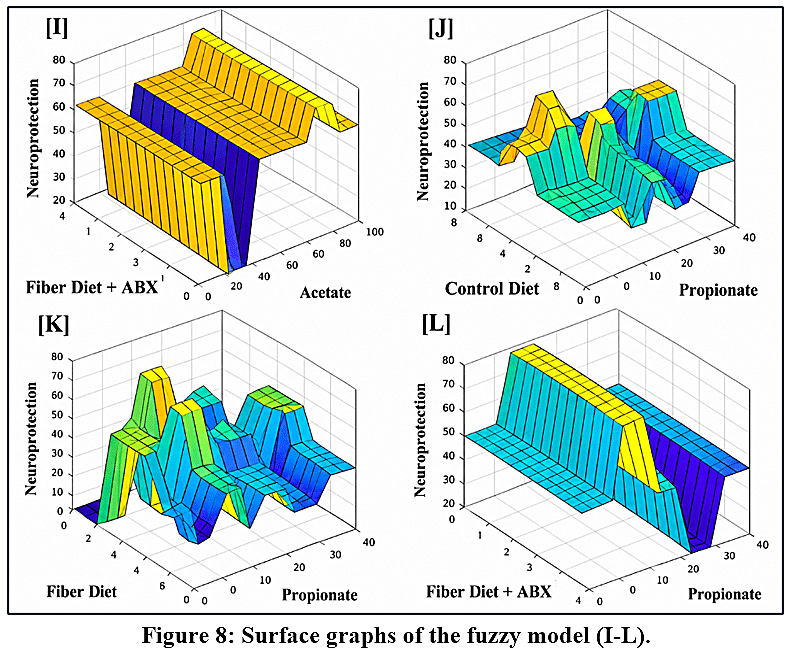 |
Figure 8: Surface graphs of the fuzzy model (I-L). Click here to View Figure |
Control Diet vs. Acetate
Under control-diet conditions, neuroprotection peaked at ~58%, particularly when acetate remained within an optimal window of 40–60% combined with the standard diet dose (~3.5 g). Deviations from this dietary baseline (restriction or excess) progressively reduced neuroprotection, indicating high acetate sensitivity to nutritional imbalance and reduced efficacy under suboptimal intake.
Fiber Diet vs. Acetate
When combined with a fiber-enriched diet, acetate exhibited a clear potentiation effect. The model predicted sustained high neuroprotection (~58–60%) across moderate variations in fiber dose, with a broader effective acetate range (≈40–70%) and reduced response variability compared with the control diet. This suggests that fiber acts as a favorable physiological modulator, supporting microbial fermentation dynamics and stabilizing acetate-associated neuroprotective signaling.
Fiber Diet + Antibiotics vs. Acetate
Co-administration of fiber with antibiotics largely abolished the potentiation observed with fiber alone. The response surface became nearly flat around ~50% neuroprotection across acetate levels, with localized minima even within otherwise optimal acetate ranges. This pattern is consistent with antibiotic-driven disruption of the microbiota, which likely suppresses fermentation-dependent relations and limits the functional efficacy of acetate.
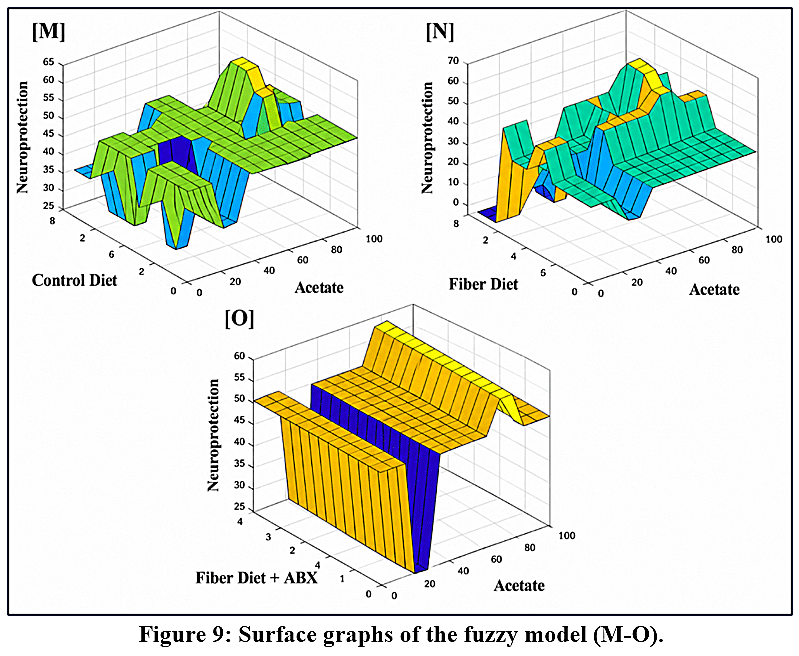 |
Figure 9: Surface graphs of the fuzzy model (M-O). Click here to View Figure |
Dynamics Analysis of ANN
The regression plots from ANN training (See Table 9) show strong, consistent predictions of behavioral loss in mouse models of AD. The network used five input variables from standard behavioral tests: T-Maze, NOR, EPM, WM, and a mouse identifier code. This approach allowed for a thorough capture of each subject’s behavioral profile.
A) Training: This graph shows how well the neural network fit the data during training. The predicted values closely match the ideal line Y=T, which means the model learned the original data patterns well. The high correlation coefficient (R=0.90628) and low spread of points show successful training without overfitting.
B) Validation: This graph shows how the model performed on new data not used in training. The strong correlation between predicted and actual values (R=0.91707) confirms that the model generalizes well. The slope is nearly 1, and the points align with the diagonal, supporting the reliability of the fit.
C) Test: In this phase, the network was tested with a fully independent dataset. The high accuracy (R=0.92595) shows excellent predictive ability. The points follow the ideal line, confirming the model performs well outside the training data.
D) All: This graph combines results from all three phases. The overall R value of 0.90608 shows the model is consistent across stages. The even and tight grouping of points supports the neural network’s robustness and stability.
Figures [E–G] show how the ANN converged and generalized over 22 training epochs using the Levenberg–Marquardt algorithm.
The gradient in [E] steadily decreased, reaching about 0.00068712 at epoch 22. This steady drop shows that backpropagation effectively updated the weights and that the model converged well. Since there were no large swings or long flat spots, the optimization progressed smoothly and did not get stuck in unstable local minima.
At the same time, the damping factor μ in [F] dropped from a high starting point to 1 × 10⁻⁷, with only small changes near the end. This shows how the Levenberg–Marquardt algorithm shifted from relying mostly on gradient descent to using more of the Gauss–Newton method as it approached convergence. The steady drop in μ confirms that the optimization was on track and enabled more accurate updates and controlled convergence.
Validation monitoring in [G] also shows the training was robust. Early on, there were a few validation failures, but after epoch 16, they started to rise and reached seven by epoch 22. This increase triggered early stopping, which helped prevent overfitting and kept the model general. Stopping at this point gave a good balance between fitting the data and keeping predictions stable.
Together, the changes in the gradient, the damping factor, and the validation indicate that the learning process was stable, efficient, and well-regularized. This highlights the neural network model’s strong performance.
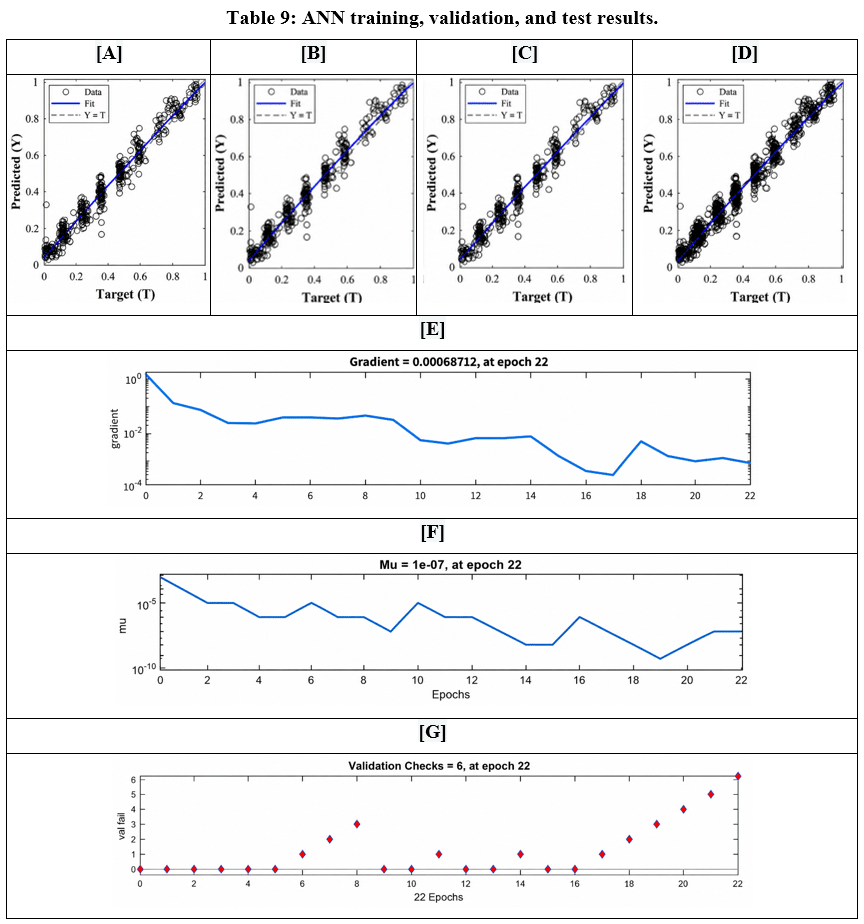 |
Table 9: ANN training, validation, and test results. Click here to View Table |
Figure [A] shows that the ANN achieved optimal predictive performance at epoch 7, where the minimum validation MSE (0.003487) was recorded (Table 10). After this point, no further improvement in generalization was observed, indicating the onset of potential overfitting. The close alignment of training, validation, and test error curves demonstrates balanced learning dynamics without divergence. The consistent logarithmic decay of error across epochs confirms efficient multi-order magnitude reduction, which is critical for complex nonlinear behavioral prediction tasks.
The error histogram [B] further supports model accuracy. Most residuals were tightly distributed between 0.05 and 0.05 units, with over 220 observations concentrated around zero. Extreme errors (>±0.2) were rare (<5 cases), indicating strong robustness to outliers. The similar distribution of errors across training, validation, and test subsets confirms stable generalization. Corresponding MSE values were low and comparable across phases (training: 0.0029; validation: 0.0035; test: 0.0030), reinforcing the absence of systematic bias.
Sensitivity analysis using a tornado approach [C] identified the Morris Water Maze (WM, 28.1%) and Elevated Plus Maze (EPM, 27.1%) as the most influential predictors of behavioral loss. Subject ID contributed highlighting significant inter-individual variability, while NOR accounted for 18.5%. T-MAZE showed minimal impact (2.0%), suggesting lower discriminatory power in this dataset. These results provide guidance for prioritizing highly informative behavioral metrics in future experimental designs.
Individual-level predictions [D] revealed marked heterogeneity in behavioral loss (15.3–82.4%), underscoring the system’s capacity to capture differential patterns of cognitive decline. Group-level analysis further demonstrated that Tg/Control animals exhibited substantial deterioration (66.7%) relative to WT/Control (25%). Fiber supplementation markedly reduced behavioral loss in Tg animals (21%), whereas fiber combined with antibiotics resulted in severe impairment (82.4%), indicating that microbiota disruption abolishes fiber-mediated neuroprotection. These findings align with microbiota-dependent SCFA mechanisms reported in previous studies.
Figure [E] presents behavioral loss across experimental groups. WT/Control animals demonstrated baseline impairment (25.07%), while Tg/Control animals exhibited a substantial increase (64.52%), confirming transgene-associated cognitive decline. Fiber supplementation significantly reduced behavioral loss in Tg animals (15.35%); however, this benefit was entirely negated by antibiotic treatment (82.44%). Together, these findings suggest that fiber-mediated neuroprotection depends on the microbiota and is likely driven by SCFA. Thus, the results underscore a critical interaction among diet, microbiota, and cognition in the AD model.
Finally, the regression comparison between observed and predicted behavioral loss [F] across >800 observations showed close agreement, confirming accurate capture of nonlinear behavioral patterns derived from WM, EPM, NOR, and T-MAZE variables. The minimal deviation between real and predicted values demonstrates strong generalization capacity and supports the ANN as a reliable predictive tool for preclinical AD behavioral assessment.
Overall, the integrated performance metrics, sensitivity profiling, and biological consistency validate the robustness, interpretability, and translational relevance of the proposed AI-based predictive framework.
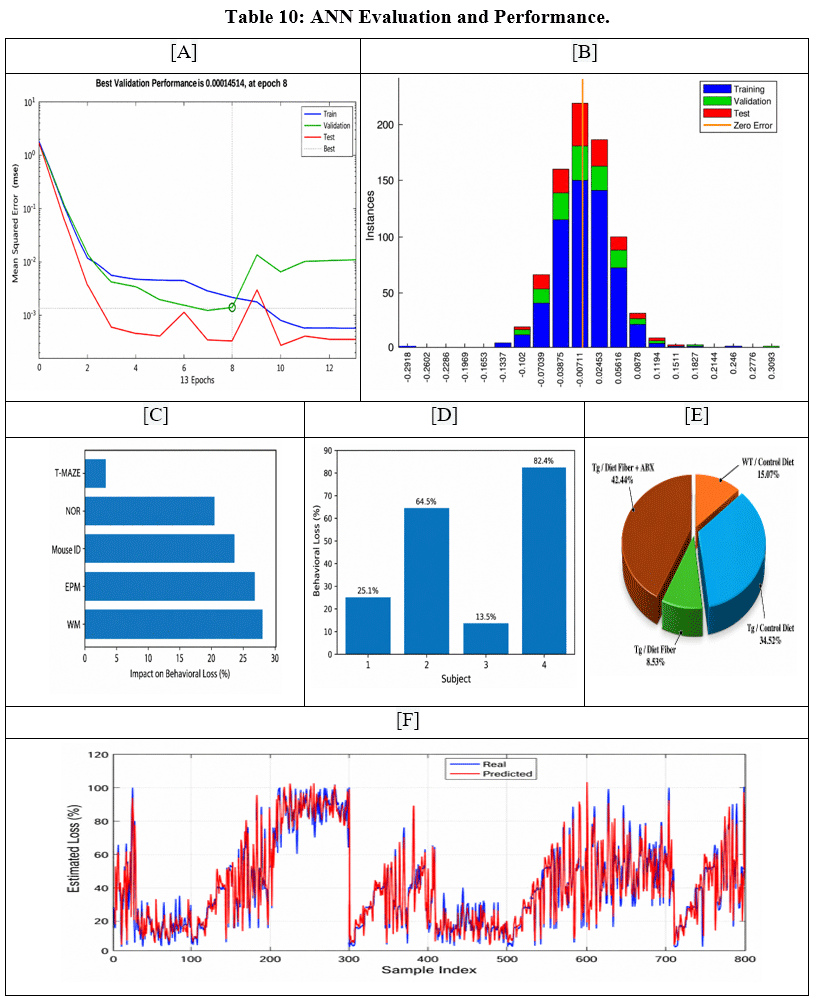 |
Table 10: ANN Evaluation and Performance. Click here to View Table |
External Cross-Dataset Validation of SCFA-Related Neuroprotective Trends
To complement the internal validation of the proposed IDSS, an external cross-dataset validation was performed using independent experimental data reported by Cuervo-Zanatta et al.3 The external values were paired with the corresponding fuzzy results generated by the proposed system for each mouse ID. This comparison included SCFA-related relationships involving butyrate and propionate, together with biological and behavioral outcomes associated with astrocytic response, amyloid pathology, and cognitive performance.
The external dataset was not used to construct, train, or adjust the fuzzy-neural system. Instead, it was used as an independent reference to evaluate the agreement between the experimental values and the results produced by the IDSS. This procedure allowed the model to be assessed beyond its internal validation, determining whether the fuzzy results followed the same tendency as the external experimental data.
Table 11: External data and fuzzy validation3
| Panel | Mouse ID | External variable | External value | Fuzzy result |
| 3H | 2.8 | Butyrate | 363.989323 | 3637.98 |
| 3H | 2.9 | Butyrate | 141.551403 | 143.50 |
| 3H | 11.6 | Butyrate | 451.616382 | 420.61 |
| 3I | 1.2 | Propionate | 215.697400 | 216.69 |
| 3I | 11.5 | Propionate | 188.735200 | 189.7352 |
| 3I | 2.9** | Propionate | 141.551400* | 142.55 |
| 3K | 2.8 | Butyrate | 0.425828* | 0.4458 |
| 3K | 2.9 | Butyrate | 0.099733 | 0.0997 |
| 3K | 5.18 | Butyrate | 0.105965 | 0.1059 |
| 3L | 11.2 | Propionate | 14.687540 | 13.6875 |
| 3L | 5.27 | Propionate | 17.173123 | 15.1731 |
| 3L | 2.25 | Propionate | 9.942334 | 8.9423 |
Values marked with an asterisk were identified as outliers in the external dataset. The table presents representative numerical values from the independent SCFA-related experimental relationships used for external cross-dataset validation. These values were not used to train or adjust the proposed IDSS; they were used only to compare the direction of the experimental SCFA-related trends with the biological trends predicted by the fuzzy-neural model.
The purpose of this comparison was to evaluate the numerical and biological agreement between the independent experimental values and the fuzzy results generated by the IDSS. Since both values were organized as paired observations for each mouse ID, Pearson correlation and fitted line analysis were applied to determine how closely the fuzzy outputs followed the external experimental values.
Table 12 summarizes the independent SCFA-related experimental relationships considered for the external cross-dataset validation. The table defines the biological meaning of each relationship and explains how each one contributed to the validation process. In this way, the selected relationships provided an independent reference to evaluate whether the proposed IDSS reproduced coherent trends associated with SCFA activity, astrocytic response, amyloid pathology, and cognitive performance in the murine AD model.
Table 12: SCFA relationships for external validation3
| Panel | Experimental relationship | Biological dimension | Interpretation for external validation |
| 3H | Butyrate vs. fuzzy result | SCFA activity and fuzzy system response | Used to evaluate the agreement between external butyrate values and the fuzzy result generated by the IDSS. |
| 3I | Propionate vs. fuzzy result | SCFA activity and fuzzy system response | Used to assess the agreement between external propionate values and the fuzzy result generated by the IDSS. |
| 3K | Butyrate vs. fuzzy result | SCFA-related behavioral dimension | Used to evaluate whether the fuzzy result followed the experimental butyrate-related tendency associated with cognitive performance. |
| 3L | Propionate vs. fuzzy result | SCFA-related pathological dimension | Used to evaluate whether the fuzzy result followed the experimental propionate-related tendency associated with amyloid plaque burden. |
After defining the external SCFA-related relationships, each panel was analyzed as an independent paired dataset. In each case, the external experimental value was paired with the corresponding fuzzy result generated by the IDSS for the same mouse ID. The objective was to quantify the direction and strength of the association between both values and to evaluate how closely the fuzzy results followed the independent experimental data.
For this purpose, Pearson correlation analysis and fitted line analysis were applied to each panel. Positive correlation values indicated that the external experimental values and the fuzzy results increased together, whereas negative values indicated an inverse relationship. The coefficient of determination (R²) was also calculated to estimate the proportion of variability in the fuzzy results explained by the external experimental values.
Values marked in the original external dataset were retained in the main analysis and considered during interpretation. This approach allowed the full paired dataset to be evaluated while identifying observations that could influence the fitted line. Therefore, the external dataset was used as an independent numerical reference to assess the agreement between the experimental SCFA-related values and the fuzzy outputs generated by the IDSS.
The Pearson correlation coefficient was calculated using the next equation:
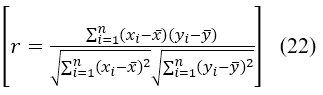
Where:
(xi) and (yi) represent the paired experimental values
(x) and (y) are the mean values of each variable
(n) is the number of observations.
The coefficient (r) ranges from -1 to 1.
Values close to 1 indicate a strong positive association, values close to -1 indicate a strong negative association, and values close to 0 indicate a weak or absent linear relationship. In addition, the coefficient of determination (R²) was used to evaluate the degree of agreement between the external experimental values and the fuzzy results generated by the IDSS.
The fitted line analysis showed strong agreement across all SCFA-related validation panels. In panel 3H, the external butyrate values showed a strong positive association with the fuzzy results, with Pearson r = 0.9497 and R² = 0.9019. This indicates that the fuzzy results followed the external butyrate values with a high degree of numerical agreement.
In panel 3I, the external propionate values also showed a strong positive association with the fuzzy results, with Pearson r = 0.9920 and R² = 0.9842. This was the strongest relationship among the analyzed panels and indicates high consistency between the external propionate values and the IDSS output.
Similarly, panel 3K showed a strong positive relationship between external butyrate values and fuzzy results, with Pearson r = 0.9664 and R² = 0.9340. Panel 3L also showed strong agreement between external propionate values and fuzzy results, with Pearson r = 0.9800 and R² = 0.9604.
Overall, all external–fuzzy validation panels showed R² values above 0.90, supporting the numerical coherence of the proposed IDSS. These findings reinforce the ability of the fuzzy-neural system to generate outputs that are strongly associated with independent SCFA-related experimental values for both butyrate- and propionate-related validation panels.
Table 13: External-validation Pearson results.
| Panel | Analyte | n | Pearson r | R² | p-value |
| 3H | Butyrate | 10 | 0.9497 | 0.9019 | 2.639 × 10⁻⁵ |
| 3I | Propionate | 10 | 0.9920 | 0.9842 | 1.735 × 10⁻⁸ |
| 3K | Butyrate | 18 | 0.9664 | 0.9340 | 7.274 × 10⁻¹¹ |
| 3L | Propionate | 7 | 0.9800 | 0.9604 | 1.077 × 10⁻⁴ |
Figure presents the fitted line plots used to evaluate the external cross-dataset validation between the independent SCFA-related experimental values and the fuzzy results generated by the proposed IDSS. Each panel compares the external value on the x-axis with the corresponding fuzzy result on the y-axis. The regression line represents the fitted relationship between both variables, while Pearson r and R² indicate the strength of the association and the degree of numerical agreement.
Overall, the results showed strong positive associations in all validation panels. Panel 3H evaluated butyrate-related values and showed a strong agreement between the external data and the fuzzy results, with R² = 0.9019 and Pearson r = 0.9497. Although some points were more dispersed, the general trend remained positive, indicating that the fuzzy output followed the external butyrate values.
Panel 3I showed the strongest agreement for propionate, with R² = 0.9842 and Pearson r = 0.9920. This indicates that the fuzzy results were highly consistent with the external propionate values. Similarly, panel 3K showed a strong positive relationship for butyrate, with R² = 0.9340 and Pearson r = 0.9664. Panel 3L also showed strong agreement for propionate, with R² = 0.9604 and Pearson r = 0.9800.
These results indicate that the fuzzy results generated by the IDSS were strongly associated with the independent experimental SCFA-related values. Therefore, the fitted line plots support the external numerical coherence of the proposed fuzzy-neural system for butyrate- and propionate-related validation panels.
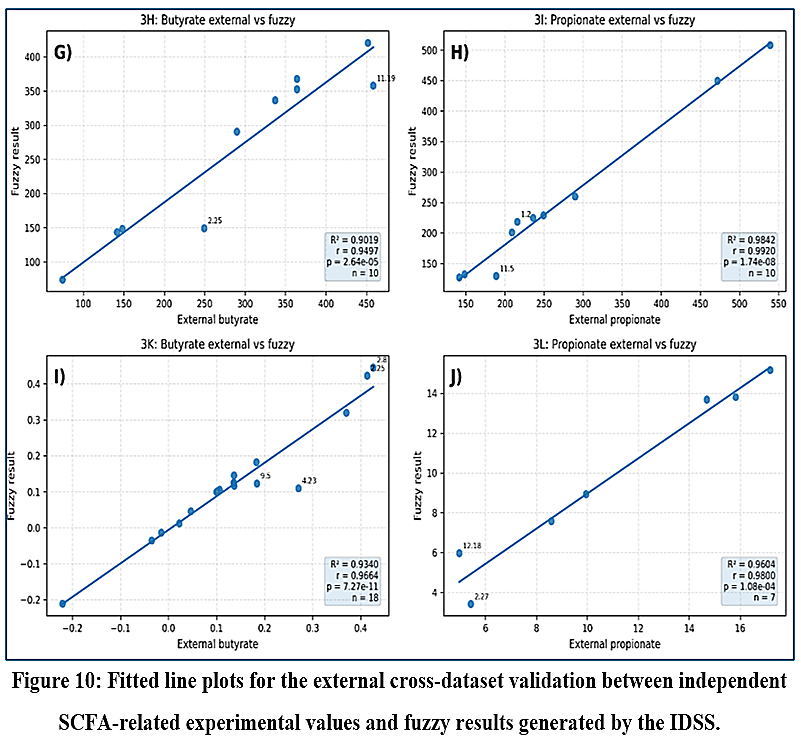 |
Figure 10: Fitted line plots for the external cross-dataset validation between independent SCFA-related experimental values and fuzzy results generated by the IDSS. Click here to View Figure |
To visually summarize the SCFA-related external cross-dataset validation, fitted line plots were generated for each paired external–fuzzy relationship. These plots compared the independent experimental values reported for butyrate and propionate with the corresponding fuzzy results generated by the IDSS. This graphical representation allowed the degree of numerical agreement between both datasets to be evaluated using Pearson correlation coefficients and R² values.
As shown in the figure, all SCFA-related validation panels showed strong positive associations between the external experimental values and the fuzzy results. Panel 3H showed strong agreement for butyrate, with Pearson r = 0.9497 and R² = 0.9019. Panel 3I showed the strongest agreement for propionate, with Pearson r = 0.9920 and R² = 0.9842. Similarly, panel 3K showed a strong relationship for butyrate, with Pearson r = 0.9664 and R² = 0.9340, while panel 3L showed strong agreement for propionate, with Pearson r = 0.9800 and R² = 0.9604.
Overall, the fitted line plots showed that the fuzzy results followed the external SCFA-related experimental values with high consistency. These findings support the external numerical coherence of the proposed IDSS and reinforce its ability to generate outputs that are strongly associated with independent butyrate- and propionate-related experimental data.
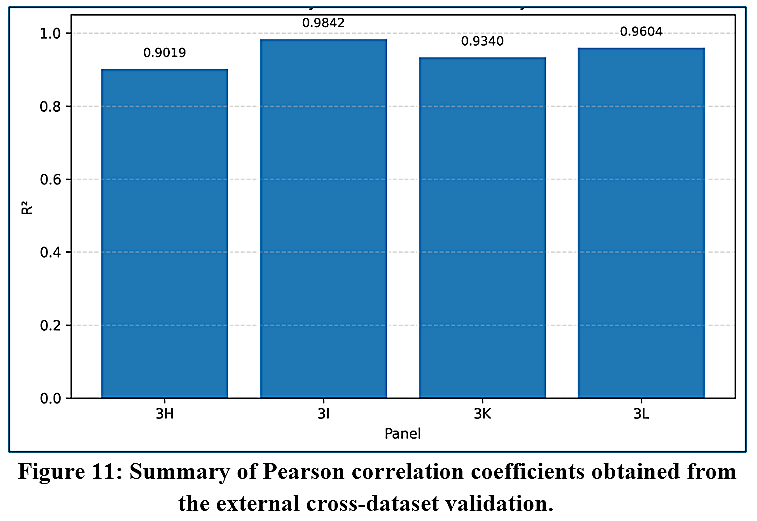 |
Figure 11: Summary of Pearson correlation coefficients obtained from the external cross-dataset validation. Click here to View Figure |
To complement the fitted line analysis, the distribution of the validation error was evaluated using a boxplot of the normalized absolute error (%). This analysis allowed the error between the external experimental values and the fuzzy results generated by the IDSS to be compared across panels with different numerical scales. The normalized absolute error was calculated as:

Where the external range corresponds to the difference between the maximum and minimum external values within each validation panel. Lower values indicate smaller differences between the fuzzy result and the external experimental value.
The boxplot shows the distribution of the normalized error for panels 3H, 3I, 3K, and 3L. The orange line represents the median error, the green triangle represents the mean error, the box represents the interquartile range, and the individual points represent the paired observations used in the external validation.
Panel 3K showed the lowest and most stable error distribution, with a median normalized error of 1.5354% and a mean value of 3.2009%. This indicates strong agreement between the external butyrate-related values and the fuzzy results. Panel 3H also showed a low median error of 0.7729%, indicating that most observations presented small differences between the external values and the fuzzy outputs. However, its mean error increased to 6.4823% due to one higher deviation, which can be observed as an isolated point in the plot.
Panel 3I showed a moderate but consistent error distribution, with a median error of 4.5264% and a mean error of 5.3816%. This suggests that the fuzzy results followed the external propionate values with acceptable stability. Panel 3L showed the highest normalized error, with a median of 8.1957% and a mean of 11.7079%. This panel included fewer observations and its values were concentrated in a narrow range, which explains the more compact visual distribution of the points and box.
Overall, the boxplot supports the external numerical consistency of the proposed IDSS. Most validation panels showed low to moderate normalized errors, confirming that the fuzzy results were close to the independent experimental values. Together with the high Pearson correlation and R² values obtained in the fitted line analysis, these results strengthen the external validation of the fuzzy-neural system for butyrate- and propionate-related panels.
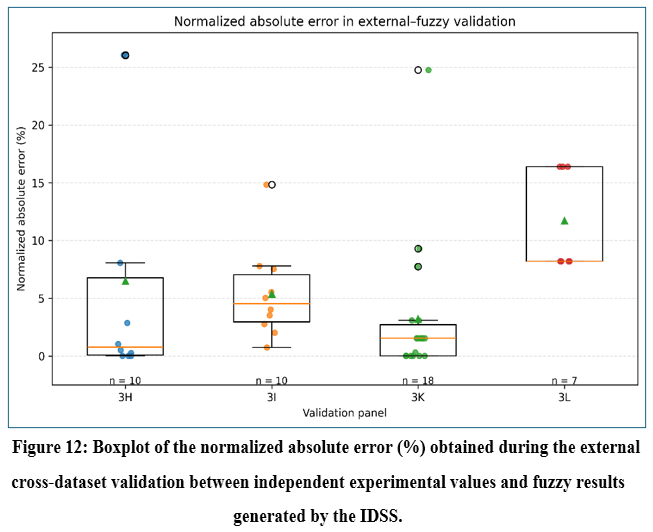 |
Figure 12: Boxplot of the normalized absolute error (%) obtained during the external cross-dataset validation between independent experimental values and fuzzy results generated by the IDSS. |
Overall, the SCFA-related external cross-dataset validation showed strong numerical agreement between the independent experimental values and the fuzzy results generated by the proposed IDSS. All analyzed panels showed positive associations, with R² values above 0.90. These results indicate that the fuzzy outputs followed the external butyrate- and propionate-related values with high consistency.
These findings suggest that the fuzzy-neural model was able to reproduce SCFA-related patterns beyond the internal dataset used for model development. Therefore, the external validation strengthens the reliability of the IDSS as an interpretable computational tool for analyzing butyrate- and propionate-related responses in a murine model of Alzheimer’s disease.
Discussion
Table 14 [A] present a comparative summary of SCFA values as percentages. This format makes it easier to see how much each group improves or worsens compared to the others. Section [B] shows how one experimental condition differs from another. This allows for clearer identification of the effects of fiber and antibiotics. These changes help explain the magnitude of differences between groups and strengthen the biological interpretation of the results. The observed trend aligns with that reported by.3 They used the same experimental groups and found that a high-fiber diet helped prevent cognitive decline and maintain a favorable gut environment. Previous studies focused on metabolites have validated that fiber, SCFAs, and their receptors participate in protection against cognitive decline. Therefore, the pattern observed in Tg-F-Abx is not an isolated finding. Instead, it is consistent with the experimental literature [C].
Section [D] shows the neuroprotection error distribution obtained during the validation of the SCFAs fuzzy inference system. This is represented by pairs of input variables. A comparison is presented between the actual values and those predicted by the SCFAs fuzzy inference system for estimating neuroprotection level (R² = 0.9534, RMSE = 4.8828, and MAE = 3.9475). This provides one of the strongest pieces of evidence for quantitative validation of the model [E]. The objective is not only to show that the model generates low errors, but also to verify that its overall behavior matches the experimental trends reported in the WT-C, Tg-C, Tg-F, and Tg-F-Abx groups.
Table 14: Experimental vs. Computational reliability [A].
| [A] | |||||||
| Group | Average SCFAs | Behavioral Tests | Mean difference (SCFAs − Tests) | Relationship (SCFAs / Tests) | Percentage of records (SCFAs > Tests) | Percentage Change (SCFAs vs WT-C) | Percentage Change
(Tests vs WT-C) |
| WT-C | 39.29% | 30.48% | 8.80% | 128.87% | 50.00% | 0.00% | 0.00% |
| Tg-C | 38.61% | 32.72% | 5.90% | 118.02% | 50.00% | -1.71% | 7.33% |
| Tg-F | 71.63% | 35.42% | 36.21% | 202.24% | 100.00% | 82.33% | 16.18% |
| Tg-F-Abx | 27.21% | 73.58% | -46.38% | 36.97% | 0.00% | -30.75% | 141.39% |
Table 14: Experimental vs. Computational reliability [B].
| [B] | ||
| Comparison | Change in SCFAs | Change in behavioral tests |
| Tg-F vs Tg-C | 85.51% | 8.25% |
| Tg-F vs WT-C | 82.33% | 16.18% |
| Tg-F-Abx vs Tg-F | -62.02% | 107.76% |
| Tg-F-Abx vs WT-C | -30.75% | 141.39% |
Table 14: Experimental vs. Computational reliability [C].
| [C] | |||
| Study | Model | Main finding | Validations |
| Present Study | WT-C, Tg-C, Tg-F, Tg-F-Abx | Highest SCFAs in Tg-F; poorest profile in Tg-F-ABX. | Confirms group differences. |
| Cuervo-Zanatta et al.,3 | WT-C, Tg-C, Tg-F, Tg-F-Abx | Fiber protected cognition; microbiota disruption removed benefits. | Supports fiber–microbiota effects. |
| Zhou et al.,1 | 5xFAD y WT | SCFAs improved cognitive and pathological profiles. | Supports SCFA protection. |
| Zhu et al.,28 | APP/PS1 + B. brief HNXY26M4 | Reduced cognitive deficits and neuroinflammation. | Links microbiota with cognitive improvement. |
| Wu et al.,29 | APP/PS1 + Lactobacillaceae | Reduced Aβ and neuroinflammation. | Supports microbiota therapy. |
| Wang et al.,30 | Modelo murino AD + butirato | Butyrate improved cognition. | Supports SCFA neuroprotection. |
| Abdelhamid et al.,31 | AppNL-G-F + B. breve MCC1274 | Prevented memory loss and reduced hippocampal Aβ. | Supports microbiota modulation. |
| Jiang et al.,32 | 5XFAD + butirato | Butyrate improved plasticity and reduced inflammation. | Supports protective SCFA effects. |
| Li et al.,33 | Modelo murino AD | Microbiota influenced cognition and amyloid deposition. | Confirms the role of gut microbiota. |
| Sun et al.,34 | APP/PS1 + (FOS) | FOS improved cognition and reduced neurodegeneration. | Supports fiber/prebiotic benefits. |
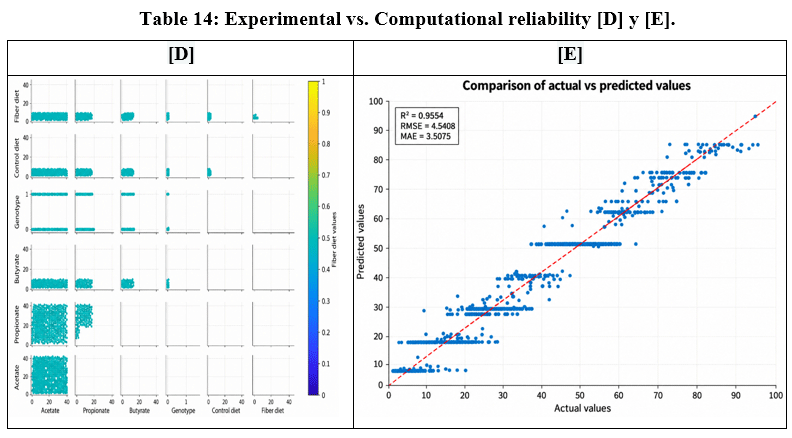 |
Table 14: Experimental vs. Computational reliability [D] y [E]. Click here to View Table |
The study of cognitive impairment associated with AD has made remarkable progress in recent years, powered by advances in AI and a better understanding of the gut-brain connection. However, as shown in the comparative review (Table 15), most previous studies focused on isolated domains (e.g., SCFAs, diet, genotype, or behavioral tests), without methodological integration to precisely model their interactions.
For example, researchers,1,2 demonstrated neuroprotective effects of butyrate and propionate on cognition in 5xFAD mice, observing marked gains in memory (p < 0.01), but did not include standardized behavioral tests or computational modeling tools. Similarly, researchers,3 showed that excess propionate reduces the cognitive benefit of fiber in transgenic mice (−30% NOR, p < 0.05), without including nonlinear modeling.2,4 They analyzed the impact of genotype and SCFAs on neuroinflammation, identifying reductions in IL-6 and IL-1β of up to 50%, but did not integrate behavioral variables or predictive systems. On the other hand, researchers,21 achieved 89% classification rate for AD impact in mice using deep learning, although without considering metabolites or using heuristic logic.
Advanced the field by developing combined models that employ fMRI, EEG, and fuzzy-ANN architectures to detect cognitive impairment with over 90% accuracy.6,9 However, their models did not include metabolites or tests such as T-MAZE or NOR.5 Demonstrated 40% reductions in butyrate in patients with AD, while identified relevant biomarkers,7 although both studies maintained a descriptive approach. Studies such as those by researchers,6,27 linked EPM and WM to progressive decline, although they did not establish direct relationships with SCFAs. Clinical investigations similar to those by researchers,13,14,21 reported AUCs > 0.85 using ANN, but without using dietary markers or metabolites.
Studies by researchers,10,11 showed promising experimental approaches: the first classified dementia with over 93% accuracy using EEG and fuzzy logic, and the second reported a 40% reduction in β-amyloid with caffeine, although neither integrated genotype or behavior. In contrast, the present study executes a hybrid system based on fuzzy logic and neural networks that allows the combination of:
- Biological variables (SCFAs: acetate 45–60%, butyrate 10–20%, propionate > 25%)
- Individual conditions (transgenic genotype, diet with fiber or antibiotics)
- Behavioral assessment (T-MAZE, NOR, WM, EPM)
- Adaptive uncertainty modeling with R² > 0.90608 indicators in predicting behavioral loss.
Sensitivity analysis identified WM and EPM as the most influential variables, consistent with researchers.6,27 Furthermore, IDSS enables the separate or integrated use of intelligent modules by simulating test scenarios and reducing the need for animal testing, supplying a robust, expandable tool for future preclinical and clinical research. Table 15 presents a comparative table of the research results compared to the current literature.
Table 15: SCFAs, diet, genotype, and AI in AD models.
| Related Works | SCFAs | Diet | Genotype | (TMAZE, NOR, EPM, WM) | FL | ANN |
| 1 | √ | √ | √ | √ | X | X |
| 2 | √ | √ | X | X | X | X |
| 3 | √ | √ | √ | √ | X | X |
| 4 | √ | X | X | X | X | X |
| 19 | √ | √ | X | X | X | X |
| 6 | X | X | √ | √ | √ | √ |
| 5 | √ | X | X | X | X | X |
| 20 | X | X | X | √ | X | √ |
| 21 | X | X | √ | √ | X | √ |
| 7 | X | X | √ | X | X | X |
| 8 | √ | X | √ | X | X | X |
| 9 | X | X | X | X | √ | √ |
| 10 | X | X | X | X | √ | X |
| 11 | X | X | √ | √ | X | X |
| 17 | X | X | X | X | X | √ |
| 13 | X | X | X | X | √ | √ |
| 12 | X | X | X | √ | X | X |
| 14 | X | X | X | X | X | √ |
| 15 | X | X | X | X | X | √ |
| 16 | X | X | X | X | X | √ |
| A Bilateral Fuzzy–Neural IDSS. | √ | √ | √ | √ | √ | √ |
Unlike previous studies that only apply conventional statistics or networks without heuristic logic, this research offers a system capable of adapting to conditions of uncertainty, modeling expert knowledge, and simulating upcoming experimental scenarios. Thus, it allows for reducing the use of laboratory animals, optimizing protocols, and generating more robust evidence for the evaluation of neuroprotective therapies. Finally, this approach is scalable and transferable to human clinical studies or other neurodegenerative diseases, provided that compatible databases are available. Its main strength lies in offering an integrative tool that overcomes the methodological fragmentation of previous research, combining forecasting precision with interpretive capacity within complex environments.
Key contributions of this study include:
- A Bilaterall FL-ANN framework for murine AD modeling
- Integration of SCFA metabolic biomarkers into AI prediction
- Behavioral prediction using multi-test murine datasets
- Identification of neuroprotective metabolic windows
- Future research directions include:
- Application of cross-validation and bootstrapping methodologies to additional datasets is planned.
- Comparison of the performance of IDSS, Random Forest, SVM, XGBoost, and regression baseline
- Examination of scalability and applicability in clinical settings.
Conclusion
This study demonstrates that the integration of fuzzy logic (FL) and artificial neural networks (ANN) within an intelligent decision support system (IDSS) provides a flexible and interpretable computational framework for modeling the multifactorial nature of Alzheimer’s disease-associated cognitive decline. The bilateral architecture allowed metabolic, dietary, genetic, and behavioral information to be analyzed within a unified system, combining the ability of fuzzy logic to represent uncertainty and nonlinear biological relationships with the predictive capacity of artificial neural networks.
The longitudinal and factorial structure of the experimental design can be summarized as:

This formulation summarizes the longitudinal and multimodal structure used to integrate the experimental observations within the IDSS.
The fuzzy component identified concentration-dependent neuroprotective profiles associated with short-chain fatty acids. Butyrate concentrations between 10–20% and acetate concentrations between 40–60% were associated with more favorable neuroprotective responses, whereas elevated propionate levels (>25%) were related to less favorable outcomes, particularly in transgenic animals. The experimental scenarios also showed that fiber supplementation favored SCFA-mediated neuroprotection, while antibiotic exposure reduced this benefit, supporting the relevance of gut microbiota integrity in the modulation of cognitive decline.
The ANN-based behavioral model also showed strong predictive performance, achieving an overall correlation greater than 0.90608. Among the evaluated behavioral variables, WM and EPM showed the greatest influence on the estimation of behavioral loss, highlighting the importance of spatial memory and anxiety-related responses in the computational characterization of cognitive deterioration. These results demonstrate that the proposed system can integrate multiple behavioral measurements and generate quantitative estimations that complement experimental evaluation.
External cross-dataset validation further strengthened the consistency of the proposed IDSS. Most independent biological relationships followed the trends generated by the system, while the comparison between external experimental values and fuzzy outputs produced coefficients of determination above 0.90. These findings support the ability of the model to reproduce biologically meaningful patterns beyond the data used for its initial development.
Overall, the proposed bilateral fuzzy–neural framework provides a computational tool for scenario simulation, identification of neuroprotective metabolic conditions, and prediction of behavioral decline in experimental AD models. Its in-silico capabilities may contribute to more targeted and resource-efficient preclinical analyses while complementing, rather than replacing, experimental evaluation. Future work should expand the IDSS database through additional independent experimental datasets, strengthen its external validation, and evaluate its applicability to other neurodegenerative disorders, including Parkinson’s disease, amyotrophic lateral sclerosis, and Huntington’s disease.
Acknowledgement
The authors gratefully acknowledge the Secretaría de Ciencia, Humanidades, Tecnología e Innovación (SECIHTI).
Funding Sources
The authors gratefully acknowledge the Secretaría de Ciencia, Humanidades, Tecnología e Innovación (SECIHTI) for supporting the Postdoctoral Fellowship of Dr. Jonathan Josué Cid-Galiot under Grant SECIHTI/011/2025, which has significantly contributed to the advancement of the academic and research activities reported in this work. We also extend our gratitude to the Secretaría de Educación, Ciencia, Tecnología e Innovación de la Ciudad de México (SECTEI) for funding the Postdoctoral Fellowship of Dr. Daniel Cuervo-Zanatta through Grant SECTEI/070/2024, whose support has been instrumental in enabling the scientific progress achieved in this study.
Conflict of Interest
The authors do not have any conflict of interest.
Data Availability Statement
National Library of Medicine – National Center for Biotechnology Information. https://www.ncbi.nlm.nih.gov/Traces/study/?acc=PRJNA718599&o=acc_s%3Aa.
Ethics Statement
This study did not involve new experiments with animals. The computational analyses used previously published murine data from Cuervo-Zanatta et al.3 The original animal procedures were approved by the Bioethics Committee of the Center for Research and Advanced Studies of the National Polytechnic Institute (Protocol No. 235-16) and were conducted in accordance with NOM-062-ZOO-1999 and the NIH Guide for the Care and Use of Laboratory Animals.
Informed Consent Statement
This study did not involve human participants, and therefore, informed consent was not required.
Clinical Trial Registration
This research does not involve any clinical trials.
Permission to Reproduce Material from other Sources
Not Applicable.
Author Contributions:
- Fatima Jovana Cid Galiot: Visualization, supervision and project administration
- Jonathan Josué Cid Galiot: Conceptualization, methodology, software
- Alberto Alfonso Aguilar-Lasserre: Validation, formal analysis, investigation and resources
- Daniel Cuervo Zanatta: Data curation, writing—original draft preparation, writing—review and editing
- Cecilia Elizabeth García Puga: Funding acquisition
References
- Zhou Y, Xie L, Schröder J, et al. Dietary Fiber and Microbiota Metabolite Receptors Enhance Cognition and Alleviate Disease in the 5xFAD Mouse Model of Alzheimer’s Disease. Journal of Neuroscience. 2023;43(37):6460–6475. DOI: 10.1523/JNEUROSCI.0724-23.2023.
CrossRef - La Torre D, Verbeke K, Dalile B. Dietary fibre and the gut–brain axis: microbiota-dependent and independent mechanisms of action. Gut Microbiome. 2021;2:e3. DOI: 10.1017/gmb.2021.3.
CrossRef - Cuervo-Zanatta D, Syeda T, Sánchez-Valle V, et al. Dietary Fiber Modulates the Release of Gut Bacterial Products Preventing Cognitive Decline in an Alzheimer’s Mouse Model. Cellular and Molecular Neurobiology. 2023;43(4):1595–1618. DOI: 10.1007/s10571-022-01268-7.
CrossRef - Qian XH, Xie RY, Liu XL, Chen SD, Tang HD. Mechanisms of Short-Chain Fatty Acids Derived from Gut Microbiota in Alzheimer’s Disease. Aging and Disease. 2022;13(4):1252–1266. DOI: 10.14336/AD.2021.1215.
CrossRef - Marizzoni M, Coppola L, Festari C, et al. Circulating short chain fatty acids in Alzheimer’s disease: A cross-sectional observational study. Journal of Alzheimer’s Disease. 2025;106(1):38–43. DOI: 10.1177/13872877251337773.
CrossRef - Bi XA, Huang Y, Shen W, et al. Brain-Inspired Fuzzy Graph Convolution Network for Alzheimer’s Disease Diagnosis Based on Imaging Genetics Data. IEEE Transactions on Fuzzy Systems. 2025;33(6):1698–1712. DOI: 10.1109/TFUZZ.2025.3529304.
CrossRef - Bonilla-Santos J, Zea-Romero EY, González-Hernández A, Cala-Martínez DY. Marcadores cognitivos, biológicos, anatómicos y conductuales del deterioro cognitivo leve y la enfermedad de Alzheimer. Una revisión sistemática. Revista Ecuatoriana de Neurología. 2021;30(2):57–67. DOI: 10.46997/revecuatneurol30200057.
CrossRef - Shukla PK, Delotterie DF, Xiao J, et al. Alterations in the Gut-Microbial-Inflammasome-Brain Axis in a Mouse Model of Alzheimer’s Disease. Cells. 2021;10(4):779. DOI: 10.3390/cells10040779.
CrossRef - Thamarimanalan T, Gopal D, Vignesh S, Kishore Kumar K. Exploiting adaptive neuro-fuzzy inference systems for cognitive patterns in multimodal brain signal analysis. Scientific Reports. 2025;15(1):9029. DOI: 10.1038/s41598-025-93241-9.
CrossRef - Amezquita-Sanchez JP, Mammone N, Morabito FC, Adeli H. A new dispersion entropy and fuzzy logic system methodology for automated classification of dementia stages using electroencephalograms. Clinical Neurology and Neurosurgery. 2021;201:106446. DOI: 10.1016/j.clineuro.2020.106446.
CrossRef - Arendash GW, Schleif W, Rezai-Zadeh K, et al. Caffeine protects Alzheimer’s mice against cognitive impairment and reduces brain β-amyloid production. Neuroscience. 2006;142(4):941–952. DOI: 10.1016/j.neuroscience.2006.07.021.
CrossRef - Helal M, Hingant E, Pujo-Menjouet L, Webb GF. Alzheimer’s disease: analysis of a mathematical model incorporating the role of prions. Journal of Mathematical Biology. 2014;69(5):1207–1235. DOI: 10.1007/s00285-013-0732-0.
CrossRef - Tanveer M, Sajid M, Akhtar M, et al. Fuzzy Deep Learning for the Diagnosis of Alzheimer’s Disease: Approaches and Challenges. IEEE Transactions on Fuzzy Systems. 2024;32(10):5477–5492. DOI:10.1109/TFUZZ.2024.3409412.
CrossRef - Jo T, Nho K, Saykin AJ. Deep Learning in Alzheimer’s Disease: Diagnostic Classification and Prognostic Prediction Using Neuroimaging Data. Frontiers in Aging Neuroscience. 2019; 11:220. DOI: 10.3389/fnagi.2019.00220.
CrossRef - Li H, Fan Y. Early prediction of Alzheimer’s disease dementia based on baseline hippocampal MRI and 1-year follow-up cognitive measures using deep recurrent neural networks. Proceedings of the IEEE International Symposium on Biomedical Imaging. 2019:368–371. DOI: 10.1109/ISBI.2019.8759397.
CrossRef - Orimaye SO, Schmidtke KA. Combining artificial neural networks and a marginal structural model to predict the progression from depression to Alzheimer’s disease. Frontiers in Dementia. 2024;3:1362230. DOI: 10.3389/frdem.2024.1362230.
CrossRef - Choi H, Jin KH. Predicting cognitive decline with deep learning of brain metabolism and amyloid imaging. Behavioural Brain Research. 2018; 344:103–109. DOI: 10.1016/j.bbr.2018.02.017.
CrossRef - Scope – AI and AD. 2026. Accessed 5 March 2026.
- Dalile B, Van Oudenhove L, Vervliet B, Verbeke K. The role of short-chain fatty acids in microbiota–gut–brain communication. Nature Reviews Gastroenterology & Hepatology. 2019;16(8):461–478. DOI: 10.1038/s41575-019-0157-3.
CrossRef - Oliveira F, Leuzy A, Castelhano J, et al. Data driven diagnostic classification in Alzheimer’s disease based on different reference regions for normalization of PiB-PET images and correlation with CSF concentrations of Aβ NeuroImage: Clinical. 2018;20:603–610. DOI: 10.1016/j.nicl.2018.08.023.
CrossRef - Liang Y, Sun Z, Chiu K, Hu Y. Effective identification of Alzheimer’s disease in mouse models via deep learning and motion analysis. 2024;10(23):e39353. DOI: 10.1016/j.heliyon.2024.e39353.
CrossRef - Zadeh LA. Soft computing and fuzzy logic. IEEE Software. 1994;11(6):48–56. DOI: 10.1109/52.329401.
CrossRef - Chakraverty S, Jeswal SK. Applied Artificial Neural Network Methods for Engineers and Scientists: Solving Algebraic Equations. Singapore: World Scientific; 2021. DOI: 10.1142/12097.
CrossRef - Arnott D, Pervan G. Eight key issues for the decision support systems discipline. Decision Support Systems. 2008;44(3):657–672. DOI: 10.1016/j.dss.2007.09.003.
CrossRef - Morales M, Cuervo-Zanatta D, Hernandez-Acosta J, Hernandez-Chacon M, Sánchez-Valle V, Perez-Cruz C. The Gut microbiota and Alzheimer’s disease. In: Martin CR, Patel VB, Preedy VR, eds. Diet and Nutrition in Neurological Disorders. Academic Press; 2023:41–68. DOI: 10.1016/B978-0-323-89834-8.00050-7.
CrossRef - Cuervo-Zanatta D, Garcia-Mena J, Perez-Cruz C. Gut Microbiota Alterations and Cognitive Impairment Are Sexually Dissociated in a Transgenic Mice Model of Alzheimer’s Disease. Journal of Alzheimer’s Disease. 2021;82(S1):S195–S214. DOI: 10.3233/JAD-201367.
CrossRef - Oliveira-Souza FG, DeRamus ML, van Groen T, Lambert AE, Bolding MS, Strang CE. Retinal changes in the Tg-SwDI mouse model of Alzheimer’s disease. 2017;354:43–53. DOI: 10.1016/j.neuroscience.2017.04.021.
CrossRef - Zhu G, Zhao J, Wang G, Chen W. Bifidobacterium breve HNXY26M4 attenuates cognitive deficits and neuroinflammation by regulating the gut–brain axis in APP/PS1 mice. Journal of Agricultural and Food Chemistry. 2023;71(11):4646–4655. DOI: 10.1021/acs.jafc.3c00652.
CrossRef - Wu Y, Niu X, Li P, et al. Lactobacillaceae improve cognitive dysfunction via regulating gut microbiota and suppressing Aβ deposits and neuroinflammation in APP/PS1 mice. Archives of Microbiology. 2023;205(4):118. DOI: 10.1007/s00203-023-03466-3.
CrossRef - Wang C, Zheng D, Weng F, Jin Y, He L. Sodium butyrate ameliorates the cognitive impairment of Alzheimer’s disease by regulating the metabolism of astrocytes. 2022;239(1):215–227. DOI: 10.1007/s00213-021-06025-0.
CrossRef - Abdelhamid M, Zhou C, Ohno K, et al. Probiotic Bifidobacterium breve Prevents Memory Impairment Through the Reduction of Both Amyloid-β Production and Microglia Activation in APP Knock-In Mouse. Journal of Alzheimer’s Disease. 2022;85(4):1555–1571. DOI: 10.3233/JAD-215025.
CrossRef - Jiang Y, Li K, Li X, Xu L, Yang Z. Sodium butyrate ameliorates the impairment of synaptic plasticity by inhibiting the neuroinflammation in 5XFAD mice. Chemico-Biological Interactions. 2021;341:109452. DOI: 10.1016/j.cbi.2021.109452.
CrossRef - Li Z, Zhu H, Guo Y, Du X, Qin C. Gut microbiota regulates cognitive deficits and amyloid deposition in a model of Alzheimer’s disease. Journal of Neurochemistry. 2020;155(4):448–461. DOI: 10.1111/jnc.15031.
CrossRef - Sun J, Liu S, Ling Z, et al. Fructooligosaccharides Ameliorating Cognitive Deficits and Neurodegeneration in APP/PS1 Transgenic Mice through Modulating Gut Microbiota. Journal of Agricultural and Food Chemistry. 2019;67(10):3006–3017. DOI: 10.1021/acs.jafc.8b07313.
CrossRef
Accepted on: 22-09-2026
Second Review by: Dr. Anjaneyulu Vinukonda
Final Approval by: Dr. Mohammad Fareed