Optimization of Immediate-Release Fimasartan Tablets Using 3² Factorial Design for Rapid Disintegration and Enhanced Drug Release
 , Abdul Kalam Abu Bakar, Shivraj Popat Jadhav*and Deepak Devidas Sonawane
 Department of Pharmaceutics, Divine College of Pharmacy, Nashik, India
Corresponding Author E-mail:shiva.007ind@gmail.com
Download this article as:
ABSTRACT:In this study, immediate-release Fimasartan tablets were formulated and optimised by use ofa 3² full factorial design with the objective of rapid disintegration and efficient drug release. Croscarmellose sodium (X₁) and microcrystalline cellulose (X₂) were selected as factors, while hardness (Y₁), disintegration time (Y₂), and drug release at 30 min (Y₃) were selected as responses. The tablets were formulated using the direct compression technique and subsequently assessed for both pre-compression and post-compression characteristics, along with disintegration performance and drug release profile. All prepared batches demonstrated satisfactory hardness, friability, uniformity of weight, and drug content values. Statistical analysis indicated that both variables significantly affected tablet performance. Increasing croscarmellose sodium reduced disintegration time and improved drug release, whereas higher MCC levels slightly prolonged disintegration and reduced release. Batch F7 was identified as the optimised formulation, showing hardness of 5.3 ± 0.2 kg/cm², disintegration time of 32 ± 2 s, and 99.8 ± 4.2% drug release at 30 min. Drug release followed first-order kinetics. Accelerated stability studies at 40 ± 2°C/75 ± 5% RH for three months showed no significant changes, and the similarity factor (f₂ = 74.13) confirmed comparable dissolution profiles. The study concluded that optimised immediate-release Fimasartan tablets were successfully developed using a factorial design.
KEYWORDS:Croscarmellose Sodium; Factorial Design; Fimasartan; Immediate-Release Tablets; Optimisation
Introduction
Hypertension is one of the mainworldwide health concerns and a top risk factor for cardiovascular diseases. Effective management of blood pressure is essential to reduce associated morbidity and mortality.1 Among the therapeutic options available, angiotensin II receptor blockers (ARBs) are widely used due to their efficacy and favourable safety profile. Fimasartan, a relatively newer ARB, has gained attention for its potent antihypertensive activity and improved pharmacokinetic properties compared to earlier agents. Despite its therapeutic advantages, the formulation of Fimasartan into an effective oral dosage form needs consideration of aspects such as drug release rate, stability, and patient compliance.2 Immediate-release (IR) tablet formulations must disintegrate fast after administration, ensuring fastrelease of drug and fast onset of action. Such formulations are particularly beneficial in conditions like hypertension, where a rapid therapeutic response is desirable. The performance of immediate-release tablets is largely influenced by the selection and optimisation of excipients, especially superdisintegrants and binders. Superdisintegrants such as croscarmellose sodium facilitate rapid tablet disintegration through swelling and wicking mechanisms, thereby enhancing drug dissolution. On the other hand, excipients like microcrystalline cellulose (MCC) contribute to tablet hardness and mechanical strength but may also influence disintegration time depending on their concentration. Due to several advantages of the direct compression method, it is widely used for the preparation of immediate-release tablets.3 However, attaining an optimum balance between tablet strength and rapid disintegration is a challenge in formulation development. Statistical optimisation techniques such as factorial design provide a systematic and efficient approach to assess the outcome of formulation variables and their relations on important quality parameters while limiting the number of trials. Therefore, the current study intended to design and optimise immediate-release tablets of Fimasartan using a 3² full factorial design by investigating the effects of croscarmellose sodium and microcrystalline cellulose on tablet properties. The optimised formulation is expected to deliver rapid drug release, better therapeutic efficacy, and improved patient compliance.
Materials and Methods
Material
Fimasartan was gifted by Vidisha Analytical Research and Training Centre, Nashik, India. All other excipients and chemicals, including croscarmellose sodium, microcrystalline cellulose (MCC), mannitol, magnesium stearate, talc, and analytical grade reagents, were acquired from Sudarshan Scientific Limited,Nashik, India. In-house prepared distilled water was used wherever necessary.
Methods
Preformulation Studies
To evaluate the physicochemical characteristics of the drug molecule, preformulation studies were performed.
Melting Point Determination
The open capillary method was used to check the melting point.4
UV–Visible Spectrophotometric Analysis
A 1000 ppm stock solution of Fimasartan was prepared using methanol and diluted with 0.1 N HCl. A prepared 20 ppm solution was then scanned between 200–400 nm (Shimadzu 1800, Japan) UV–Visible spectrophotometer to determine the λmax.
Calibration Curve Preparation
Suitable dilutions of the stock solution were prepared to obtain 5–25 µg/mL solutions and scanned at the selected λmax using 0.1 N HCl as blank, and a calibration graph of concentration versus absorbance was constructed.5
Solubility Study
The shake flask method was used for the determination of solubility. A surplus quantity of API was added to a known volume of solvent (methanol, ethanol, dimethyl sulfoxide, and distilled water) in separate conical flasks. The flasks were securely closed and agitated in a mechanical shaker at 25 ± 2 °C for 24 hours until equilibrium was reached. After equilibrium filtration was carried out through Whatman filter paper and drug concentration was determined by using a UV–Visible spectrophotometer.6
Drug–Excipient Compatibility Study
Compatibility study between Fimasartan and the selected excipients was carried out by using FTIR. A physical mixture of the drug and excipients was analyzed using a Shimadzu IRAffinity-1 FTIR spectrophotometer by the KBr pellet method over the range of 4000–400 cm⁻¹.7
Formulation of Immediate-Release Tablets
Direct compression was used for the compression of immediate-release tablets of Fimasartan. The accurately weighed materials were passed through a #60 mesh sieve and blended homogeneously. The lubricated blend was then compressed using an 8-station tablet compression machine (VbTech Automation, Ahmedabad, India) with 10 mm punches to obtain tablets.
Experimental Design
A 3² factorial design was used to optimize the immediate-release tablets of Fimasartan. Croscarmellose sodium (X₁) and microcrystalline cellulose (X₂) were selected as independent variables at three levels (−1, 0, +1), while hardness (Y₁), disintegration time (Y₂), and drug release at 30 min (Y₃) were taken as responses. Based on the design, nine formulations were prepared and evaluated, and the relationship between formulation variables and responses was analysed using a polynomial equation.

In the polynomial model, Y denotes the response, while b₀, b₁, b₂, and b₁₂ represent the intercept, main effects, and interaction effect, respectively. Statistical optimisation was carried out using Design-Expert® software (Version 13) with ANOVA and response surface analysis. The formulation compositions are provided in Table 1.
Table 1: Formulation Composition of Batches Prepared Using 3² Factorial Design
| Component / Batch | F1 | F2 | F3 | F4 | F5 | F6 | F7 | F8 | F9 |
| Fimasartan (mg) | 120 | 120 | 120 | 120 | 120 | 120 | 120 | 120 | 120 |
| CCS (mg) (X₁) | 5.6 | 5.6 | 5.6 | 11.2 | 11.2 | 11.2 | 16.8 | 16.8 | 16.8 |
| MCC (mg) (X₂) | 21 | 31.5 | 42 | 21 | 31.5 | 42 | 21 | 31.5 | 42 |
| Mannitol (mg) | q.s. | q.s. | q.s. | q.s. | q.s. | q.s. | q.s. | q.s. | q.s. |
| Talc (mg) | 3 | 3 | 3 | 3 | 3 | 3 | 3 | 3 | 3 |
| Magnesium stearate (mg) | 2 | 2 | 2 | 2 | 2 | 2 | 2 | 2 | 2 |
| Total weight (mg) | 280 | 280 | 280 | 280 | 280 | 280 | 280 | 280 | 280 |
Evaluation of Powder Blend8–10
The powder blend was evaluated for pre-compression parameters to determine its flowability and compressibility characteristics. Bulk and tapped densities were determined by the graduated cylinder method, while flow properties were assessed using the fixed funnel method.
Evaluation of Tablets (Post-Compression Parameters)11–13
Physical appearance
Visual inspection of the compressed tablets was carried out to evaluate their physical characteristics, including appearance, colour uniformity, shape, and surface quality. The tablets were also checked for manufacturing defects such as chipping, cracking, capping, and lamination. Consistency in these properties reflected proper tablet formulation and effective compression during manufacturing.
Thickness and Hardness
Tablet thickness and hardness were measured using a digital Vernier calliper and a Monsanto hardness tester, respectively. Three tablets from each batch were tested, and the average value was calculated.
Friability
The Roche friabilator was used for checking friability.Previously weighed tablets were subjected to rotation in a friabilator at 25 rpm for 4 minutes, after which the tablets were dedusted and weighed again. The percentage friability was then determined using the appropriate equation.

Weight variation
Twenty tablets were selected randomly and weighed individually. The average tablet weight was calculated, and the percentage deviation of each tablet from the average weight was determined using the following equation;

Drug content
Ten tablets were collectively weighed and triturated into a fine powder. A portion of the powder corresponding to 120 mg of Fimasartan was dispersed in 0.1 N HCl, filtered, and quantified using UV–Visible spectrophotometric analysis.
Disintegration Test
Using a USP disintegration test apparatus (Electrolab EDI 2I), six tablets from each batch were tested in 0.1 N HCl kept at 37 ± 2 °C. The duration required for total breakdown of the tablets without any intact residue was noted, and the average disintegration time was calculated.14
In Vitro Dissolution Study
USP Type II dissolution test apparatus (Veritas-08 basic, Electrolab, India) was utilised to check the dissolution performance of the prepared tablet. 0.1 N HCl (900 mL) kept at 37 ± 0.5°C was used as a medium with a 50 rpmpaddle speed.One tablet from each formulation batch was subjected to dissolution testing, and 5 mL samples were collected at specified intervals of 5, 10, 15, 20, 25, and 30 minutes while maintaining sink conditions. The collected dissolution samples were filtered, appropriately diluted, and examined at 256 nm using a UV–Visible spectrophotometer. Drug release at each time point was calculated using the calibration curve data.15
Statistical Analysis and Optimisation
Design-Expert® (version 13) was used for statistical analysis. The outcome of independent variables, concentration of croscarmellose sodium (X₁) and microcrystalline cellulose (X₂), on the dependent responses, namely tablet hardness and disintegration time, was evaluated. The experimental data were statistically evaluated using ANOVA to check the significance of the model and formulation variables, with p < 0.05 considered significant.
Validation of Optimised Formulation
To validate the reliability of the developed factorial design model, the optimised formulation suggested by the numerical optimisation process was prepared experimentally. The optimised batch (F7) was evaluated for critical quality attributes. The experimentally obtained values were compared with the forecasted responses generated by the software. The percentage prediction error was calculated to assess the accuracy and robustness of the optimisation model. Close agreement between predicted and observed values was considered as confirmation of model validity.
Drug Release Kinetics Study
The release behaviour of the optimized formulation (F7) was evaluated by fitting the dissolution data to various mathematical models, including zero-order, first-order, Higuchi, and Hixson–Crowell models, using cumulative drug release values obtained at different time points.
Accelerated Stability Study
The optimized formulation (F7) was packed in aluminium blister packs and subjected to accelerated stability studies.12 The tablets were stored at 40 ± 2°C and 75 ± 5% relative humidity (RH) in a stability chamber for a period of three months. Samples were withdrawn at predetermined intervals of 0, 1, 2, and 3 months and evaluated for physical appearance, hardness, friability, disintegration time, drug content, and in vitro drug release. The formulation was considered stable if no significant change in physical appearance was observed, friability remained below 1%, drug content remained within 90–110% of the labeled claim, disintegration time remained within acceptable limits for immediate-release tablets, and drug release at 30 minutes was not less than 85%. Furthermore, the similarity factor (f₂) was calculated to compare the dissolution profiles of the initial and stored samples, and an f₂ value greater than 50 was considered indicative of similarity between dissolution profiles. The results demonstrated that the optimized formulation complied with all predefined acceptance criteria throughout the study period and remained physically and chemically stable under accelerated storage conditions for three months.16

Where n represents the number of dissolution sampling intervals, while Rₜ and Tₜ correspond to the percentage drug release from the initial and stability samples, respectively, at a given time point t.
Results
Preformulation Studies
Melting Point Determination
The melting temperature of Fimasartan was observed within the range of 154–156°C.
Solubility Study
The drug showed high solubility in methanol, ethanol, and dimethyl, whereas it showed poor solubility in distilled water. The results are presented in Table 2.
Table 2: Quantitative Solubility of Fimasartan in Different Solvents
| Solvent | Solubility (mg/mL) | Solubility Category |
| Methanol | 28.56 ± 2.67 | Freely soluble |
| Ethanol | 23.40 ± 3.02 | Freely soluble |
| Dimethyl sulfoxide (DMSO) | 55.78 ± 4.34 | Highly soluble |
| Distilled water | 0.0062 ± 0.0003 | Poorly soluble |
| Values are expressed as mean ± SD (n = 3). | ||
UV–Visible Spectrophotometric Analysis
Fimasartan exhibited maximum absorbance (λmax) at 256 nm, showing a sharp and well-defined peak in the UV spectrum (Figure 1).
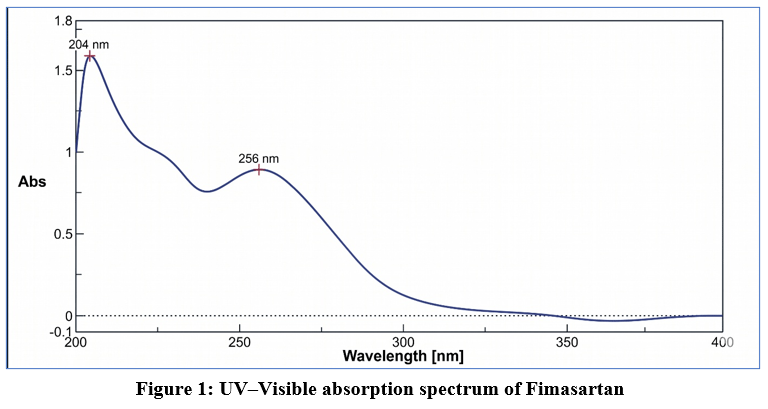 |
Figure 1: UV–Visible absorption spectrum of Fimasartan
|
Calibration Curve
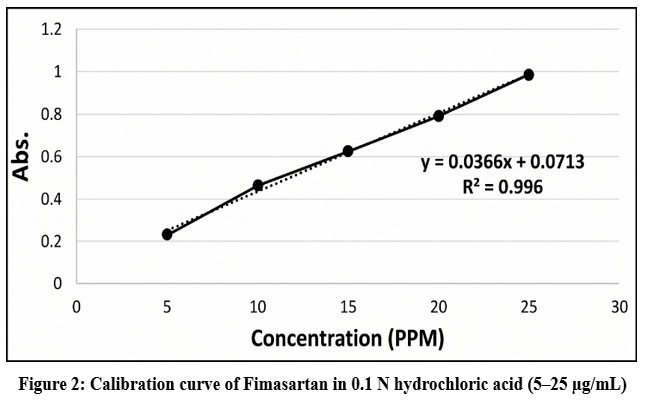 |
Figure 2: Calibration curve of Fimasartan in 0.1 N hydrochloric acid (5–25 µg/mL)
|
Linear correlation (R² =0.996) was found in concentration and absorbance as indicated in Figure 2.
Drug–Excipient Compatibility Study
The FTIR spectrum of pure Fimasartan displayed characteristic absorption peaks associated with its functional groups, such as aromatic C–H and C=O stretching vibrations. Similar prominent peaks were also observed in the FTIR spectrum (Figure 3) of the physical mixture without any noticeable changes, indicating the absence of significant drug–excipient interaction.
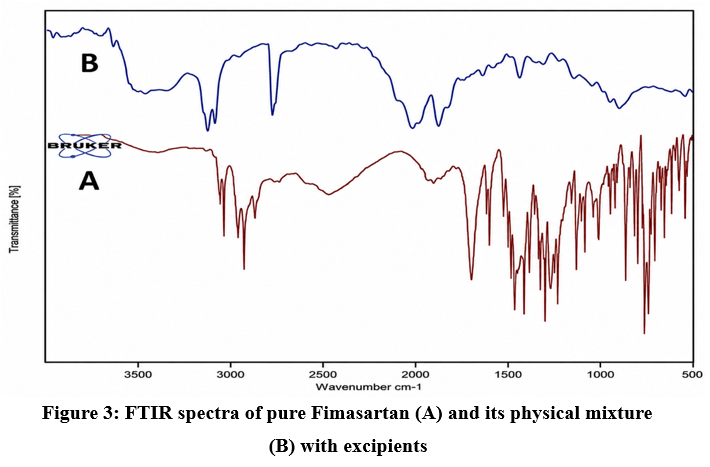 |
Figure 3: FTIR spectra of pure Fimasartan (A) and its physical mixture (B) with excipients
|
Evaluation of Powder Blend (Pre-Compression Parameters)
Pre-compression characteristics of formulations F1–F9, including bulk density, tapped density, Carr’s index, Hausner’s ratio, and angle of repose, were determined to assess powder flow and compressibility. The obtained data are summarized in Table 3.
Table 3: Pre-Compression Parameters of Powder Blends
| Batch | Bulk
Density (g/cm³) |
Tapped
Density (g/cm³) |
Carr’s
Index (%) |
Hausner’s Ratio | Angle of Repose (°) | Flow Property |
| F1 | 0.56 ± 0.03 | 0.65 ± 0.04 | 13.97 ± 0.35 | 1.16 ± 0.02 | 25.20 ± 0.40 | Good |
| F2 | 0.56 ± 0.04 | 0.68 ± 0.05 | 16.73 ± 0.42 | 1.20 ± 0.02 | 27.24 ± 0.45 | Good |
| F3 | 0.56 ± 0.03 | 0.66 ± 0.04 | 14.83 ± 0.36 | 1.17 ± 0.02 | 26.36 ± 0.38 | Good |
| F4 | 0.55 ± 0.03 | 0.64 ± 0.04 | 14.50 ± 0.34 | 1.17 ± 0.02 | 25.74 ± 0.35 | Good |
| F5 | 0.53 ± 0.02 | 0.61 ± 0.03 | 13.66 ± 0.30 | 1.16 ± 0.02 | 24.34 ± 0.30 | Good |
| F6 | 0.52 ± 0.03 | 0.63 ± 0.05 | 18.10 ± 0.48 | 1.22 ± 0.03 | 23.45 ± 0.28 | Fair |
| F7 | 0.53 ± 0.03 | 0.63 ± 0.04 | 14.99 ± 0.37 | 1.18 ± 0.02 | 25.98 ± 0.36 | Good |
| F8 | 0.54 ± 0.03 | 0.65 ± 0.04 | 16.41 ± 0.40 | 1.20 ± 0.02 | 24.34 ± 0.32 | Good |
| F9 | 0.54 ± 0.03 | 0.64 ± 0.04 | 15.07 ± 0.35 | 1.18 ± 0.02 | 24.15 ± 0.30 | Good |
|
Values are expressed as mean ± SD (n = 3) |
||||||
Evaluation of Tablets (Post-Compression Parameters)
The prepared tablets (F1–F9) were assessed for post-compression parameters, including thickness, hardness, friability, weight variation, and drug content uniformity. The observed results are summarized in Table 4.
Table 4: Post-Compression Parameters of Tablets
| Batch | Thickness (mm) | Hardness (kg/cm²) | Friability (%) | Weight Variation (mg) | Drug Content (%) |
| F1 | 3.12 ± 0.05 | 4.2 ± 0.2 | 0.68 ± 0.04 | 280 ± 3 | 98.5 ± 1.2 |
| F2 | 3.15 ± 0.04 | 4.5 ± 0.3 | 0.72 ± 0.05 | 279 ± 4 | 99.2 ± 1.0 |
| F3 | 3.18 ± 0.05 | 4.8 ± 0.2 | 0.75 ± 0.04 | 281 ± 3 | 99.6 ± 0.9 |
| F4 | 3.10 ± 0.03 | 4.6 ± 0.2 | 0.70 ± 0.03 | 280 ± 3 | 98.9 ± 1.1 |
| F5 | 3.14 ± 0.04 | 4.9 ± 0.3 | 0.69 ± 0.04 | 279 ± 4 | 99.4 ± 0.8 |
| F6 | 3.16 ± 0.05 | 5.1 ± 0.3 | 0.74 ± 0.05 | 281 ± 3 | 99.8 ± 0.7 |
| F7 | 3.13 ± 0.04 | 5.3 ± 0.2 | 0.66 ± 0.03 | 280 ± 2 | 100.2 ± 0.6 |
| F8 | 3.17 ± 0.05 | 5.0 ± 0.3 | 0.71 ± 0.04 | 279 ± 3 | 99.7 ± 0.8 |
| F9 | 3.11 ± 0.03 | 4.7 ± 0.2 | 0.73 ± 0.05 | 281 ± 3 | 99.1 ± 1.0 |
| Values are expressed as mean ± SD (n = 3) | |||||
Disintegration Test
The disintegration time of F1–F9 was evaluated to assess tablet performance. The results are presented in Table 5.
Table 5: Disintegration Time of Tablets
| Parameter | F1 | F2 | F3 | F4 | F5 | F6 | F7 | F8 | F9 |
| Disintegration Time
(s) |
62 ± 3 | 68 ± 4 | 75 ± 5 | 48 ± 3 | 55 ± 4 | 60 ± 4 | 32 ± 2 | 40 ± 3 | 45 ± 3 |
| Values are expressed as mean ± SD (n = 3) | |||||||||
In Vitro Dissolution Study
The dissolution profile of formulations F1–F9 was studied in 0.1 N HCl, and the corresponding in vitro drug release data are provided in Table 6.
Table 6: In vitro drug release profiles of all formulations (F1–F9)
| Batch | 5 min | 10 min | 15 min | 20 min | 25 min | 30 min |
| F1 | 32.4 ± 2.1 | 48.7 ± 2.4 | 65.2 ± 2.8 | 78.4 ± 3.1 | 88.9 ± 3.4 | 94.5 ± 3.6 |
| F2 | 28.6 ± 1.8 | 42.3 ± 2.1 | 58.9 ± 2.5 | 72.5 ± 2.8 | 82.3 ± 3.1 | 89.8 ± 3.3 |
| F3 | 24.3 ± 1.6 | 38.6 ± 2.0 | 52.1 ± 2.3 | 65.8 ± 2.6 | 75.6 ± 2.9 | 82.7 ± 3.1 |
| F4 | 40.2 ± 2.3 | 60.4 ± 2.8 | 78.6 ± 3.2 | 90.5 ± 3.6 | 96.2 ± 3.8 | 98.4 ± 4.1 |
| F5 | 36.5 ± 2.0 | 55.7 ± 2.5 | 72.4 ± 2.9 | 85.2 ± 3.3 | 92.8 ± 3.6 | 96.3 ± 3.9 |
| F6 | 33.1 ± 1.9 | 52.2 ± 2.3 | 69.3 ± 2.8 | 81.6 ± 3.1 | 90.1 ± 3.4 | 93.7 ± 3.6 |
| F7 | 48.6 ± 2.5 | 72.5 ± 3.0 | 88.9 ± 3.5 | 96.8 ± 3.8 | 99.2 ± 4.0 | 99.8 ± 4.2 |
| F8 | 44.2 ± 2.3 | 66.8 ± 2.7 | 82.3 ± 3.1 | 91.2 ± 3.5 | 96.5 ± 3.8 | 97.9 ± 4.0 |
| F9 | 41.5 ± 2.2 | 63.4 ± 2.6 | 79.1 ± 3.0 | 88.4 ± 3.4 | 94.3 ± 3.7 | 96.1 ± 3.9 |
| Values are expressed as mean ± SD (n = 3) | ||||||
Statistical Analysis and Optimisation
The influence of formulation parameters on the properties of immediate-release tablets was investigated using a 3² factorial experimental design. Two formulation components, namely croscarmellose sodium and microcrystalline cellulose, were examined at three different concentrations to study their effect on tablet hardness, disintegration behaviour, and drug release profile. The response values obtained from all nine formulation batches (F1–F9) are provided in Table 7.
Table 7: Experimental design matrix and observed responses
| Batch | X₁:
CCS (mg) |
X₂:
MCC (mg) |
Hardness
(kg/cm²) |
Disintegration Time (s) | % Drug Release at 30 min |
| F1 | 5.6 | 21 | 4.2 ± 0.2 | 62 ± 3 | 94.5 ± 3.6 |
| F2 | 5.6 | 31.5 | 4.5 ± 0.3 | 68 ± 4 | 89.8 ± 3.3 |
| F3 | 5.6 | 42 | 4.8 ± 0.2 | 75 ± 5 | 82.7 ± 3.1 |
| F4 | 11.2 | 21 | 4.6 ± 0.2 | 48 ± 3 | 98.4 ± 4.1 |
| F5 | 11.2 | 31.5 | 4.9 ± 0.3 | 55 ± 4 | 96.3 ± 3.9 |
| F6 | 11.2 | 42 | 5.1 ± 0.3 | 60 ± 4 | 93.7 ± 3.6 |
| F7 | 16.8 | 21 | 5.3 ± 0.2 | 32 ± 2 | 99.8 ± 4.2 |
| F8 | 16.8 | 31.5 | 5.0 ± 0.3 | 40 ± 3 | 97.9 ± 4.0 |
| F9 | 16.8 | 42 | 4.7 ± 0.2 | 45 ± 3 | 96.1 ± 3.9 |
| Values are expressed as mean ± SD (n = 3) | |||||
Effect of Formulation Variables on Tablet Hardness (Y₁)
The outcome of formulation variables on tablet hardness (Y₁) was analysed using a 2FI model, and the generated polynomial equation was:
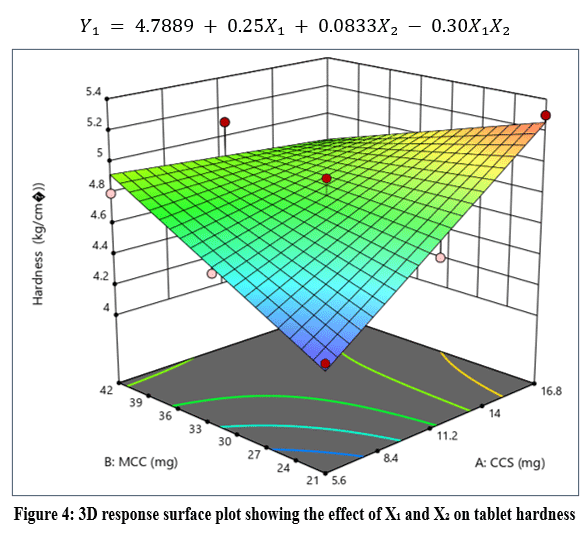 |
Figure 4: 3D response surface plot showing the effect of X₁ and X₂ on tablet hardness
|
The response surface plot (Figure 4) shows that hardness increased with increasing concentration of X₁, while X₂ had a moderate effect.
Effect on Disintegration Time (Y₂)
The effect on disintegration time (Y₂) was evaluated using a linear model, and the regression equation obtained was:
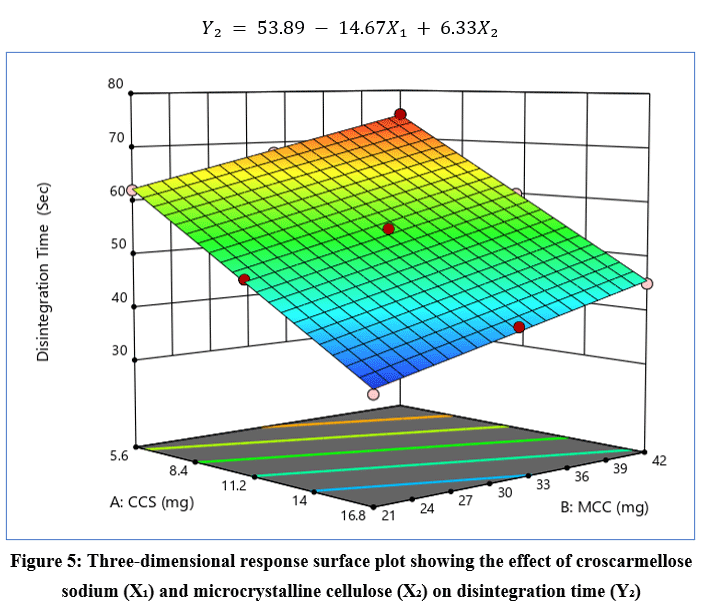 |
Figure 5: Three-dimensional response surface plot showing the effect of croscarmellose sodium (X₁) and microcrystalline cellulose (X₂) on disintegration time (Y₂).
|
The response surface plot (Figure 5) indicates that disintegration time decreased with increasing X₁ and increased with higher X₂.
Effect on Drug Release at 30 min (Y₃)
The effect on drug release at 30 min (Y₃) was analysed using a linear model, and the regression equation obtained was:
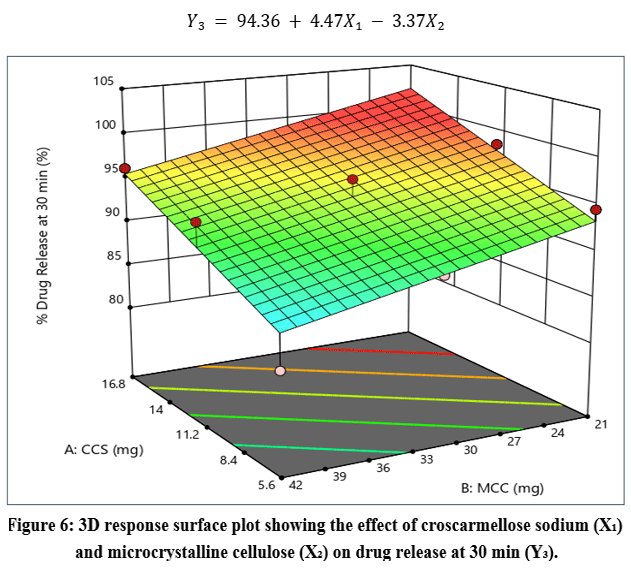 |
Figure 6: 3D response surface plot showing the effect of croscarmellose sodium (X₁) and microcrystalline cellulose (X₂) on drug release at 30 min (Y₃).
|
The response surface plot (Figure 6) indicated that an increase in X₁ enhanced drug release, whereas higher levels of X₂ resulted in reduced drug release.
Validation of Optimised Formulation
The optimised formulation obtained from the numerical optimisation process was prepared and evaluated. The observed values of hardness, disintegration time, and percentage drug release at 30 min were compared with the predicted values. The results are presented in Table 8.
Table 8: Comparison of predicted and observed responses of optimised batch F7
| Response | Predicted Value | Observed Value |
| Hardness (kg/cm²) | 5.2 | 5.3 ± 0.2 |
| Disintegration Time (s) | 34 | 32 ± 2 |
| % Drug Release at 30 min | 98.9 | 99.8 ± 4.2 |
Drug release kinetics
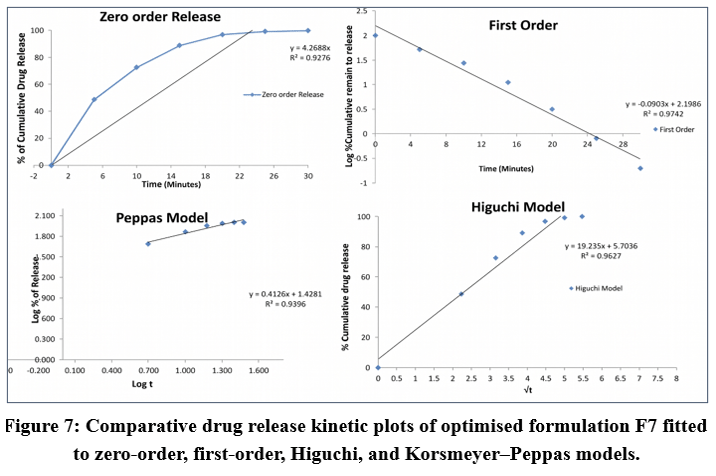 |
Figure 7: Comparative drug release kinetic plots of optimised formulation F7 fitted to zero-order, first-order, Higuchi, and Korsmeyer–Peppas models.
|
Drug release data of the optimized batch (F7) were subjected to different mathematical models. The kinetic analysis plots are illustrated in Figure 7, which revealed that the formulation exhibited a first-order drug release pattern.
Accelerated Stability Study
The optimised formulation (F7) was exposed to accelerated stability studies at 40 ± 2°C/75 ± 5% RH for three months. The results are presented in Table 9.
Table 9: Stability study data of optimised formulation (F7) stored at 40 ± 2°C / 75 ± 5% RH for 3 months
| Parameter | Initial | 1 Month | 2 Months | 3 Months |
| Appearance | White, intact tablets | No change | No change | No change |
| Hardness (kg/cm²) | 5.3 ± 0.2 | 5.2 ± 0.2 | 5.2 ± 0.3 | 5.1 ± 0.2 |
| Friability (%) | 0.42 ± 0.03 | 0.44 ± 0.02 | 0.44 ± 0.03 | 0.45 ± 0.02 |
| Disintegration Time (s) | 32 ± 2 | 33 ± 2 | 35 ± 3 | 35 ± 2 |
| Drug Content (%) | 99.4 ± 0.6 | 99.1 ± 0.5 | 98.8 ± 0.7 | 98.5 ± 0.6 |
| % Drug Release at 30 min | 99.8 ± 4.2 | 99.2 ± 4.0 | 98.9 ± 3.8 | 98.4 ± 3.7 |
Discussion
The organoleptic properties of Fimasartan, including its white crystalline appearance and odourless nature, are consistent with reported characteristics, confirming the identity and suitability of the drug for formulation into oral solid dosage forms. The observed melting point range (154–156°C) is in close agreement with literature values, indicating the purity of the drug. The narrow melting range suggests the absence of significant impurities. The solubility study revealed that Fimasartan is highly soluble in organic solvents such as methanol, ethanol, and dimethyl sulfoxide, but poor soluble in water. This behaviour indicates the hydrophobic nature of the drug and suggests that it belongs to the class of poorly water-soluble compounds. The limited aqueous solubility highlights the necessity for preparationapproaches to enhance drug dissolution and improve bioavailability. The higher solubility in organic solvents also supports their use in analytical and formulation development.
For calibration curve confirms that the drug follows Beer–Lambert’s law within the considered concentration range.
The compatibility study confirmed that the characteristic FTIR peaks of Fimasartan remained unchanged in the physical mixture, suggesting no major interaction between the drug and the excipients. This confirms the compatibility of Fimasartan with croscarmellose sodium, microcrystalline cellulose, mannitol, magnesium stearate, and talc, and suggests that the excipients are suitable for formulation without affecting the stability of the drug.
Evaluation of powder blendrevealed that the obtained bulk density and tapped density values indicate good packing ability of the powder blends. Carr’s index values within the acceptable range suggest good compressibility, while Hausner’s ratio further confirms satisfactory flow characteristics. The angle of repose below 30° indicates good flowability. Overall, the results demonstrate that the powder blends possess suitable flow and compression properties, making them appropriate for direct compression.
Evaluation of tabletsrevealed that all formulations exhibited uniform thickness, indicating consistent die filling during compression. The hardness values were within acceptable limits, suggesting adequate mechanical strength of the tablets. Friability values below 1% indicate good abrasion resistance. The weight variation complied with pharmacopeial limits, confirming uniformity in tablet weight. The drug content values werewithin the acceptable range, demonstrating uniform drug distribution throughout the formulations. Overall, these findings demonstrate that all formulations possess satisfactory post-compression characteristics.
Disintegration test revealed that time of disintegration decreased with an increase in the concentration of croscarmellose sodium due to its swelling and wicking mechanism, which promotes rapid water uptake and tablet breakup. In contrast, formulations containing higher levels of microcrystalline cellulose showed slightly increased disintegration time, which may be attributed to the formation of a more compact tablet matrix. Among all formulations, F7 exhibited the fastest disintegration, indicating an optimal balance between superdisintegrant and binder concentration. All formulations complied with pharmacopeial limits for immediate-release tablets, confirming their suitability for rapid drug release.
In vitro dissolution study revealed that drug release was significantly influenced by the concentration of croscarmellose sodium and microcrystalline cellulose. Formulations with higher levels of croscarmellose sodium showed enhanced drug release due to rapid disintegration and improved wettability, whereas higher concentrations of microcrystalline cellulose resulted in comparatively slower drug release due to increased matrix compactness. Among all formulations, F7 showed the highest drug release, indicating optimal formulation composition. The enhanced release can be attributed to the balanced concentration of superdisintegrant and binder, resulting in efficient tablet disintegration and drug dissolution. Overall, all formulations demonstrated satisfactory drug release, confirming their suitability for immediate-release dosage forms.
Statistical analysis and optimisation revealed that both formulation variables significantly influenced the performance of immediate-release Fimasartan tablets. Croscarmellose sodium (X₁) exhibited a positive effect on tablet hardness, while microcrystalline cellulose (X₂) showed a comparatively lesser influence; however, their interaction affected hardness behaviour, indicating the importance of combined variable effects.
The disintegration study demonstrated that increasing croscarmellose sodium markedly reduced disintegration time due to its swelling and wicking mechanism, whereas higher levels of microcrystalline cellulose increased disintegration time because of enhanced matrix compactness.17
Drug release analysis revealed that higher concentrations of croscarmellose sodium improved drug release and increased wettability, while increased levels of microcrystalline cellulose slightly hindered drug release owing to the preparation of a denser tablet structure.18
Overall, the developed models showed good agreement between predicted and observed responses, confirming the suitability of the factorial design for optimisation. Considering the overall tablet performance, formulation F7 was selected as the optimized batch as it exhibited satisfactory hardness, rapid disintegration, and maximum drug release, achieved through an optimal combination of superdisintegrant and binder levels.19-22
Validation of optimised formulation revealed that the experimental responses were in close agreement with the predicted values, confirming the adequacy and reliability of the developed factorial design model.
Kinetic analysis demonstrated that the drug release from the formulation primarily followed first-order kinetics, indicating concentration-dependent release behaviour. The fitting to the Higuchi and Peppas models suggested that diffusion, along with other release mechanisms, contributed to the overall drug release process.23
Accelerated stability study revealed that the optimised formulation remainedstable under accelerated storage conditions. No major changes in appearance were observed, and the tablets retained their mechanical strength with friability within acceptable limits. Minor variations in hardness and disintegration time were observed but remained within acceptable limits for immediate-release tablets. Drug content and dissolution profiles were maintained throughout the study period, indicating good chemical stability.
The obtained similarity factor (f₂) indicated that the dissolution profile remained unchanged after stability storage, confirming the stability of the formulation. Hence, the optimized batch F7 exhibited satisfactory stability characteristics and can be considered suitable for further development studies.
Conclusion
The present study successfully developed and optimized immediate-release Fimasartan tablets using a 3² full factorial design. Croscarmellose sodium and microcrystalline cellulose significantly influenced tablet hardness, disintegration time, and drug release behaviour. The optimized formulation (F7) exhibited satisfactory mechanical strength, rapid disintegration, and maximum drug release, while accelerated stability studies confirmed its physical and chemical stability over three months. The developed formulation therefore demonstrates potential as an effective immediate-release oral dosage form of Fimasartan.
Strengths of the study include the systematic optimization of formulation variables using a factorial design approach, comprehensive evaluation of pre- and post-compression parameters, validation of the optimization model, assessment of drug release kinetics, and stability testing of the optimized formulation. These findings provide a robust foundation for the development of immediate-release Fimasartan tablets.
Limitations of the study include the relatively short duration of accelerated stability testing and the absence of in vivo pharmacokinetic or bioavailability evaluation. Furthermore, the study was limited to in vitro characterization and did not establish an in vitro–in vivo correlation (IVIVC). Therefore, future studies should focus on long-term stability assessment under real-time storage conditions, in vivo performance evaluation, and IVIVC development to further confirm the therapeutic potential of the optimized formulation.
Acknowledgement
The authors are thankful to the Management and Principal of Divine College of Pharmacy for providing the necessary support and infrastructure to carry out this study.
Funding Sources
The author(s) received no financial support for the research, authorship, and/or publication of this article.
Conflict of Interest
The authors do not have any conflict of interest.
Data Availability Statement
This statement does not apply to this article.
Ethics Statement
This research did not involve human participants, animal subjects, or any material that requires ethical approval.
Informed Consent Statement
This study did not involve human participants, and therefore, informed consent was not required.
Clinical Trial Registration
This research does not involve any clinical trials.
Permission to reproduce material from other sources
Not Applicable.
Author Contributions
- Snehal Anil Khare: Experimental work, Data Collection, Investigation, Writing – Original Draft
- Abdul Kalam Abu Bakar: Data Analysis, Validation, Statistical Analysis
- Shivraj Popat Jadhav: Conceptualization, Methodology, Supervision, Writing – Review and Editing
- Deepak Devidas Sonawane: Methodology, Visualization, Project Administration
References
- Mills KT, Stefanescu A, He J. The global epidemiology of hypertension. Nat Rev Nephrol. 2020;16:223-237.
CrossRef - Pradhan A, Gupta V, Sethi R. Fimasartan: a new armament to fight hypertension. J Family Med Prim Care. 2019;8:2184-2188.
CrossRef - Serrano-Mora LE, et al. Preparation of co-processed excipients for controlled-release of drugs assembled with solid lipid nanoparticles and direct compression materials. Molecules. 2021;26:2093.
CrossRef - Jadhav SP, Dhakad PK, Gupta T, Gilhotra R. Effect of lyophilization on characteristics of iloperidone nanosuspension. Int J Drug Deliv Technol. 2024;14:1039-1043.
CrossRef - Samajpaty S. Solubility of nifedipine by shake flask UV-spectrometry: review of safety concerns in pregnancy. Biomed Pharmacol J. 2021;14:1823-1829.
CrossRef - Patel ST, Pawar SP, Dhankani AR, Dhankani MA. Analytical method development and validation for estimation of Fimasartan in bulk drug and pharmaceutical dosage form. Asian J Pharm Anal. 2025;15(4):249-255. doi:10.52711/2231-5675.2025.00039.
CrossRef - Jadhav SP, Surywanshi KP, Rajendra K, Pathade Surana PA, Mahajan SK. Development and validation of a robust RP-HPLC method for the estimation of remogliflozin etabonate in bulk and tablet dosage forms. Biosci Biotechnol Res Asia. 2025;22(3):1136-1146.
CrossRef - Raj GP, Bhavya G, Vardhana MG, Gowda HU. Formulation techniques and evaluation parameters of fast dissolving tablets: a review. J Pharm Innov Res. 2024;2:212-217.
CrossRef - Naik SS, Somnache SN, Godbole AM, Fernandes C. Enhancing paracetamol compressibility using the co-drying technique: impact on tablet release profile from direct compression. Ger J Pharm Biomater. 2024;3:1-8.
CrossRef - Neeharika MS, Jyothi BJ. Preparation and evaluation of zafirlukast compression coated tablets for chronotherapeutic drug delivery. J Pharm Res Int. 2021:154-166. doi:10.9734/jpri/2021/v33i32B31757.
CrossRef - Dev A, Yadav SK, Kar S, Mohanty S, Shelke O. Formulation and characterization of aceclofenac mouth dissolving tablet by QbD. J Drug Deliv Ther. 2019;9(5):43-50.
CrossRef - Kumar I, Chaudhary D, Thakur B, Pandit V. Formulation and evaluation of piroxicam fast dissolving tablets using direct compression and sublimation method. J Drug Deliv Ther. 2020;10:17-25.
CrossRef - Kushwaha N, Jain A, Jain PK, Khare B, Jat YS. An overview on formulation and evaluation aspects of tablets. Asian J Dent Health Sci. 2022;2:35-39.
CrossRef - Sharma N, Pahuja S, Sharma N. Immediate release tablets: a review. Int J Pharm Sci Res. 2019;10(8):3607-3618. doi:10.13040/IJPSR.0975-8232.10(8).3607-18.
CrossRef - Caccavo D, Iannone M, Barba AA, Lamberti G. Impact of drug release in USP II and in-vitro stomach on pharmacokinetics: the case study of immediate-release carbamazepine tablets. Chem Eng Sci. 2023;267:118371.
CrossRef - Abraham J. International conference on harmonisation of technical requirements for registration of pharmaceuticals for human use. In: Tietje C, Brouder A, eds. Handbook of Transnational Economic Governance Regimes. Brill; 2010:1041-1053. doi:10.1163/ej.9789004163300.i-1081.897
CrossRef - Yamuna B, Reshma T, Mahammed N. Quality by design (QbD) based approach for development of fast dissolving tablets. Int J Pharm Sci Res. 2023;14(4):1642-1648. doi:10.13040/IJPSR.0975-8232.14(4).1642-48.
CrossRef - Monton C, Wunnakup T, Suksaeree J, Charoenchai L, Chankana N. Impact of compressional force, croscarmellose sodium, and microcrystalline cellulose on black pepper extract tablet properties based on design of experiments approach. Sci Pharm. 2023;91(3):30. doi:10.3390/scipharm91030030
CrossRef - Sathish SK, Janakiraman K, Muthumani P. Development and characterization of fast-dissolving tablets to enhance bioavailability of BCS class II drugs by solid dispersion method. Curr Drug Deliv. 2024;20(9):1005-1023.
CrossRef - Chitte N, Jadhav S, Shinde S, Deshmukh A, Patil C. Formulation and evaluation of gastroretentive floating beads of valsartan. Cuest Fisioter. 2025;54(3):1813-1832.
- Nakamura S, Tanaka C, Yuasa H, Sakamoto T. Utility of microcrystalline cellulose for improving drug content uniformity in tablet manufacturing using direct powder compression. AAPS PharmSciTech. 2019;20:151.
CrossRef - Jadhav SP, Ahire SM, Shewale VV, et al. Formulation of tablet of nifedipine co-crystal for enhancement of solubility and other physical properties. Biosci Biotechnol Res Asia. 2025;22(1):191-200.
CrossRef - Zhu W, Long J, Shi M. Release kinetics model fitting of drugs with different structures from viscose fabric. Materials. 2023;16:3282.
CrossRef
Abbreviations:
ANOVA: Analysis of Variance
CCS: Croscarmellose Sodium
DMSO: Dimethyl Sulfoxide
FTIR:Fourier Transform Infrared Spectroscopy
ICH:International Council for Harmonisation
IR: Immediate Release
MCC: Microcrystalline Cellulose
RH: Relative Humidity
UV: Ultraviolet
USP: United States Pharmacopeia
Accepted on: 15-06-2026
Second Review by: Dr. Ankur Vashi
Final Approval by: Dr. Jagdish Chandra Joshi