
Development and Validation of RP-HPLC Bioanalytical Method for Simultaneous Estimation of Azelnidipine and Telmisartan in Human Plasma
 , , 3, Santosh Ranganath Tambe1 and Sunil Vishwanath Amrutkar2
 1Department of Pharmaceutical Chemistry, Mahatma Gandhi Vidyamandir’s Pharmacy College, Panchvati, Nashik, India.
2Department of Pharmaceutical Chemistry, GES’s Sir Dr. M. S. Gosavi College of Pharmaceutical Education and Research, Nashik, India.
3Department of Pharmaceutical Chemistry, PRES’s, College of Pharmacy (For Women), Chincholi, Sinnar, Nashik, India.
Corresponding Author Email: bhandarideepali16@gmail.com
DOI : http://dx.doi.org/10.13005/bbra/3497
Download this article as:
![]()
Hypertension is treated with a combination of Telmisartan (TLM) and Azelnidipine (AZD). The purpose of the study was to ascertain TLM/AZD's bioavailability and bioequivalency in human plasma. For the best extraction of TLM and AZD from the biological matrix, the solid phase extraction method was developed. Chromatographic separation using an Inertsil C18 column (4.0 mm x 250 mm, 5 µm) and a 50 mM mobile phase were employed in the process. At a flow rate of 1.0 mL/min and an injection volume of 20 μL, acetic acid (Component A) and acetonitrile (Component B) were used in a 30:70 v/v ratio to modify the pH of ammonium acetate to 4.5. TLM and AZD in plasma were quantified by UV detection at 240 nm, with retention periods of 7.33 and 11.32 minutes, respectively. The method was verified using recovery experiments and statistical analysis, demonstrating a linearity concentration range of 50 ng/mL to 2000 ng/mL and coefficient of determination (R2) for both the drugs has been found to be 0.9998. Analysis of six replicate samples at five quality control levels (LLOQ, LQC, MQC, HQC, and ULOQ) were done to evaluate accuracy and precision both within and between days. The results showed values that were within 99–103% for each level of both the drugs. Consistent extraction recoveries of 89–93% across all quality control levels met regulatory acceptance criteria, demonstrating efficient and reproducible sample preparation. According to stability studies both medications were stable during benchtop, freeze-thaw, autosampler, refrigeration (2–8 °C), and long-term storage conditions. The technique turned out to be quick, accurate, straightforward, and precise, yielding valuable information for pharmacokinetics research and therapeutic medication monitoring in clinical labs.
KEYWORDS:Azelnidipine; Bioanalytical Method Development; Human Plasma; ICH; RP-HPLC; Telmisartan
Introduction
Azelnidipine is a calcium channel blocker that is dihydropyridine. Azelnidipine blocks the L and T calcium channels. It starts slowly and has a long-lasting hypoglycemic impact with minimal heart rate elevation. The Drug Controller General of India (DCGI) has approved the use of Azelnidipine in India. In 2020, it was released under the Azusa (Ajanta Pharma Ltd.) brand.1 Through the smooth muscle’s voltage-dependent channels in the vascular walls, Azelnidipine prevents the transmembrane calcium influx. T-type, L-type, N-type, P/Q-type, and R-type calcium channels are among the different types of calcium channels. Calcium typically causes smooth muscle contraction which raises blood pressure. The smooth muscle in the vascular system does not contract when calcium channels are closed, which causes the walls of the vascular smooth muscle to relax and lower blood pressure.2 The colour of Azelnidipine crystalline powder varies from pale yellow to yellow. The IUPAC designation is 3-[1- (Benzyldrylazetidin-3-yl). 5-isopropyl-2 amino6methyl-4-(3-nitrophenyl)-1,4-dicarboxylate, or dihydropyridine-3. The molecular formula for Azelnidipine is C₃₃H₃₄N₄O₆. Each mol has a weight of 582.646 grams. It is insoluble in water, only faintly soluble in methanol and ethyl acetate, and easily soluble in acetone and acetic acid.5
Telmisartan
It is often used to treat high blood pressure, heart failure, and diabetic renal disease. Telmisartan is marketed under several brand names including Micardis.3 An angiotensin II receptor blocker (ARB) is telmisartan. It works by inhibiting the body from producing a substance that constricts blood vessels. The blood vessels relax as a result of telmisartan. As a result, blood pressure is lowered, allowing the heart to receive more blood and oxygen.4 White to off-white crystalline powder is the form of telmisartan. The IUPAC designation for this chemical is 2-[4-[[4-methyl-6-(1-methylbenzimidazol-2yl)-2 –propylbenzimidazol-1yl] methyl] biphenyl)-benzoic acid. The chemical formula for telmisartan is C₃₃H₃₀N₄O₂. It has a mole weight of 514.6 g/mol. It is insoluble in water, weakly soluble in dichloromethane, strong acids, and organic solvents, and soluble in methanol and strong bases.6 Figures 1 and 2 showed the chemical structures of AZD and TLM.
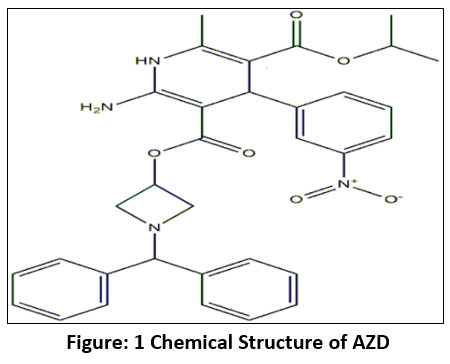 |
Figure 1: Chemical Structure of AZD
|
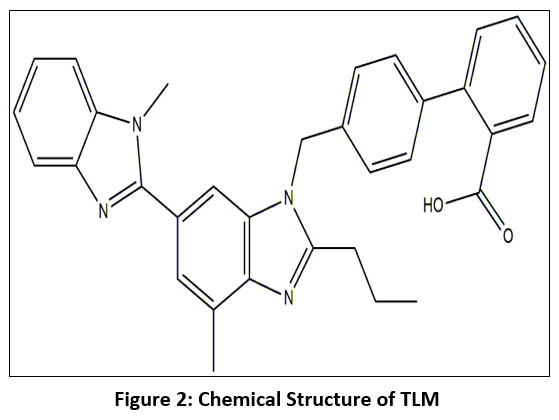 |
Figure 2: Chemical Structure of TLM
|
Bioanalytical procedures are essential for quantifying drugs and metabolites in biological samples, using various methods influenced by factors such as analyte properties and matrix composition.7 Validation includes examining stability, sensitivity, accuracy, and precision to ensure high-quality results. Sample preparation techniques face challenges in analyzing complex biofluids, often necessitating sample preconcentration, which can introduce interferences.8 Effective methods are critical for regulatory submissions for new drugs and require extensive validation due to the presence of endogenous substances. Techniques like liquid-phase microextraction (LPME), liquid-liquid extraction (LLE), and solid-liquid extraction (SLE) are favored for their efficiency and cost-effectiveness in pharmaceutical manufacturing.
Automation enhances sample throughput, accuracy, and reduces hazardous waste in production. Recent research focuses on improving sample preparation methods, integrating advanced bioanalytics with extraction techniques like SPE, LPME, and LLE, alongside robotic sample preparation methods.9-11
The freshly introduced AZD/TLM Combination is available in Japan and India.12 AZD and TLM, due to their complementary effects, are considered beneficial for stage II hypertension. Azelnidipine enhances left ventricular diastolic function and reduces arterial stiffness, while telmisartan, through renin-angiotensin system blockade, helps prevent hypertensive organ damage, particularly in the kidneys. This combination shows promise as a superior hypertension treatment, managing heart rate effectively with minimal adverse effects, as demonstrated in clinical research.13
A thorough search of the literature was conducted using a variety of internet resources, including Web of Science, Elsevier, and PubMed. A few recent and pertinent articles about chromatographic techniques for AZD/TLM measurement have been examined from the entire survey. The official methods for assessing AZD were reported in the Indian Pharmacopeia14. The Indian Pharmacopoeia, 14 Japanese Pharmacopoeia, 15 United States Pharmacopoeia, 16 and British Pharmacopoeia17 all complied with TLM as an official medication. The literature review indicates that TLM and AZD analytical methods of various commercial formulations and brands were studied both alone and in conjunction with other medications. Among them were UV Spectrophotometric methods,18-27 RP-HPLC,28-41 Stability Indicating RP-HPLC methods,42-50 HPTLC methods,51-56 LC with tandem mass spectrometry,57,58 LC-ESI-MS,59 UPLC-MS, 60-64 UFLC,65, QbD Approaches,66,67 Bioanalytical HPLC method for telmisartan was reported.68 There is not a single bioanalytical method reported on combination of AZD/TLM till date. For the bioanalytical research we therefore focused on this unique combination of AZD and TLM.
Material and Methods
Acetonitrile, water and methanol of HPLC quality were used. Ammonium dihydrogen orthophosphate of AR grade, produced by SD Fine-chem Limited is utilized. We received gift samples of TLM and AZD from USV Pharmaceuticals and Precise Biopharma respectively. The Arpan Blood Bank in Nashik provided the human plasma as well as hemolyzed and lipemic plasma sample for research work. The HPLC model was used the Agilent 1260.
Mobile Phase and Optimization of Chromatographic Conditions
A high-pressure liquid chromatographic system with an autosampler Agilent 1260 Infinity model and an ultraviolet detector was used for the technique development. The software program EZ Chrome was used to control the machine and analyze the data. After comparing the UV spectra of TLM and AZD, the wavelength that best displayed the absorbance of each API was chosen. Therefore 240 nm was chosen as the wavelength for the development of TLM and AZD bioanalytical methods. The location and form of the peaks of AZD and TLM in the respective chromatograms were examined in relation to a number of factors, including the mobile phase’s composition, pH, and flow rate.
Extraction of APIs from Human Plasma
The solid-phase extraction technique was used to successfully separate the medication under investigation from the components of endogenous plasma. To ensure homogeneity, pooled human plasma that had been frozen below -25 degrees Celsius was thawed at room temperature and then vortexed. Withdrawn 475 µL Blank plasma and 25 µL analyte (AZD and TLM) stock solution in centrifuge tube. Vortex it for 1 min at 5000 RPM. Added 250 µL ammonium acetate buffer pH4.5 and vortex it again for 1 min at 5000 RPM. Condition the SPE (phenomenox 30 mg/mL) cartridge with 1mL methanol. Drained the methanol and equilibrated the cartridge with 1 mL of water. Loaded the sample and drained it slowly. Washed with 2 mL of water. Dried the cartridge and eluted with 1 mL mobile phase and inject into HPLC System.
Standard Solution Preparation
To prepare the standard solution, weigh 10 mg of TLM and AZD separately and then transfer the contents into a 10 mL volumetric flask. 5 mL of diluent was added. It was sonicated to dissolve it and diluent was added to bring the volume up to the mark. (Stock solution 1). Two additional stock solutions were made in order to prepare linearity.
Working standard solution Preparations
Pipetted 1mL from stock solution_1 and diluted to 10mL with diluent (Stock Solution_2). Further pipetted 10 mL from stock solution_2 and diluted up to 100 mL with diluent (Stock Solution_3). Stock solution preparations were tabulated in Table 1.
Table 1: Serial Stock solution preparations of TLM and AZD.
| AZD (mg) | TLM (mg) | ml of diluent | Azelnidipine (ng/mL) | Telmisartan (ng/mL) | Serial Stock solutions |
| 10 | 10 | 10 | 1007980 | 1006970 | STK_01 |
| 1ml of STK_01 | 10 | 100798 | 100697 | STK_02 | |
| 10 ml of STK_02 | 100 | 10079.8 | 10069.7 | STK_03 | |
Method Validation69
According to ICH M10 guidelines the method validation parameters such as sensitivity, selectivity, accuracy, precision, linearity, recovery, and stability were all verified. FDA regulations and standard bioanalytical technique validation recommendations served as the foundation for the method’s validation.
Sensitivity and Selectivity
The capacity of an analytical technique to distinguish and quantify an analyte in the presence of any interfering chemicals in the absence of any biological matrix is known as selectivity. Blank samples of blood plasma from various sources are typically analyzed to determine the selectivity of the established bioanalytical technique. Thus, here the devised approach was used to six normal blank plasma batches from various plasma sample sources (Haemolysed and Lipemic).
According to the CDER standards 69, LLOQ is a superior way to measure method sensitivity and hence it must be done during method development. As a result, six distinct LLOQ dilutions were processed after LLOQ was spiked in plasma. The CV was computed for the area of six LLOQ samples.
Calibration Curve and Linearity
Determination of LLOQ
Peak regions and the height of peaks were first recorded when 100 μg/ml of AZD and TLM were analyzed together under ideal conditions. As a result, the LLOQ dilution was made. Finally, 50 ng/ml TLM and AZD were chosen as the LLOQ.
Linearity
In a similar manner, serial dilutions were used to assess different dilutions and the dilutions with linear peak area values were selected for the calibration curve. A calibration curve might be created by plotting the peak area ratio on the y-axis and the matching concentrations in ng/ml on the x-axis. Table 2 shows the regression coefficient (R2), linear equation, slope, and y-intercept for each drug sample.
Carry Over
Blank plasma was injected first then ULOQ and two consecutive blank runs to examine carryover between the two runs.
Accuracy and Precision (A and P)
To assess accuracy and precision both within and between days, six replicates were examined at five different QC points: LLOQ, LQC, MQC, HQC, and ULOQC. The accuracy and precision of the TLM and AZD technique were tested six times at three different concentration levels such as LQC, MQC and HQC. After measuring the plasma samples intra-day and inter-day accuracy, mean% accuracy was computed. The accuracy of the method is stated as a percentage of theoretical concentration and the precision is indicated as a percentage of relative standard deviation (% RSD).
Recovery
Recovery was demonstrated to be accurate, consistent, and repeatable at low, medium, and high concentrations by comparing the analyte peak areas in the unextracted sample to individual peak areas of the analyte in the extracted sample of TLM and AZD.
Stability
Verification of API stability in a biological fluid is a critical step in establishing storage conditions and the physicochemical properties of APIs in matrix and container systems. After freshly extracted QCs of TLM and AZD were subjected to various stability conditions, RSD was calculated.
Benchtop stability
Benchtop stability was evaluated for both high and low QC samples by comparing them to a theoretical value that was kept for 24 hours at room temperature. New Standard AZD and TLM spiked plasma samples were stored on a bench for a full day. The LQC and HQC were made and processed 24 hours later and they were injected right away. The recovery % was computed.
Stability at 2-8° C for 20 days
By contrasting newly prepared QC samples injected right away with those at 2–8°C, the impact of storage within the autosampler was evaluated.
Freeze Thaw Stability
Following five cycles of freezing (−70°C) and thawing for TLM and AZD, freeze-thaw stability was assessed at two QC concentrations (low, high) and compared with the nominal value. Samples that had been spiked were placed in the freezer for a full day, taken out to fully thaw and then placed back in the freezer. After 24 hours to fully defrost, they were taken out once more and put back in the freezer. After 24 hours at the fifth cycle, the samples were taken out and evaluated by injecting them into an HPLC machine. Recovery as a percentage was computed.
Auto sampler Stability
After storing the spiked stability samples in the autosampler at 25°C for 24 hours, LQC and HQC samples of TLM and AZD were injected, and the recovery % was determined.
Long Term Stability
Samples of spiked plasma were stored for 30 days at -20°C. Following a 30-day period, LQC and HQC were made, processed and injected right away. The recovery % was computed.
Results
Solvent Selection
Based on tests for analyte solubility and stability in several solvents, methanol was found to be a very practical solvent for the bioanalytical technique development of TLM and AZD. Hence it was selected as a solvent for the fabrication of dilutions. As a result, an 80:20 ratio of methanol to water has been chosen as the diluent.
Mobile Phase Selection
At first, 30: 70 water to acetonitrile mobile phase was used but no peak separation was seen. In the subsequent experiment, buffer containing 0.01M potassium dihydrogen orthophosphate and acetonitrile in a 30:70 v/v ratio was added, but no separation was seen. There was no separation in the subsequent experiment when acetic acid and acetonitrile were employed as a mobile phase in varying ratios. Although acetic acid and methanol were utilized in a different mixture as the mobile phase in the subsequent trial, the peak shape was poor. In the end, acetonitrile and ammonium acetate buffer with varying buffer pH and quantities were used. The buffer which contained 50 mM ammonium acetate with the pH adjusted to 4.5 using acetic acid, was the final choice for the mobile phase that provided satisfactory resolution and run time. Buffer (component A) and acetonitrile (component B) were combined in a 30:70 (v/v) ratio to form the mobile phase. There were enough theoretical plates, well-separated peaks, appropriate peak shapes, acceptable symmetry, and good resolution.
Chromatographic Conditions
Depending on the type of instrument available in the analytical lab, there were certain predetermined chromatographic conditions. These include the injection volume of 20 μl and the type of column which was an Inertsil C18 column (4.0 mm x 250 mm, 5 µm) with a UV detector. Analyte retention durations were significantly impacted by flow rate variations of 0.8, 0.9, 1, 1.1, and 1.2 ml/min. Because it demonstrated good chromatography in the chosen mobile phase, 1.0 ml/min was decided upon. Since both medications were exhibiting optimal absorbance at 240 nm. 240 nm was chosen as the detection wavelength for the bioanalytical technique of TLM and AZD. Figure 3 displays a typical chromatogram of AZD and TLM standard solutions made using the described HPLC technique. After being extracted from human plasma the retention durations for TLM and AZD were found to be 7.33 and 11.32 minutes, respectively.
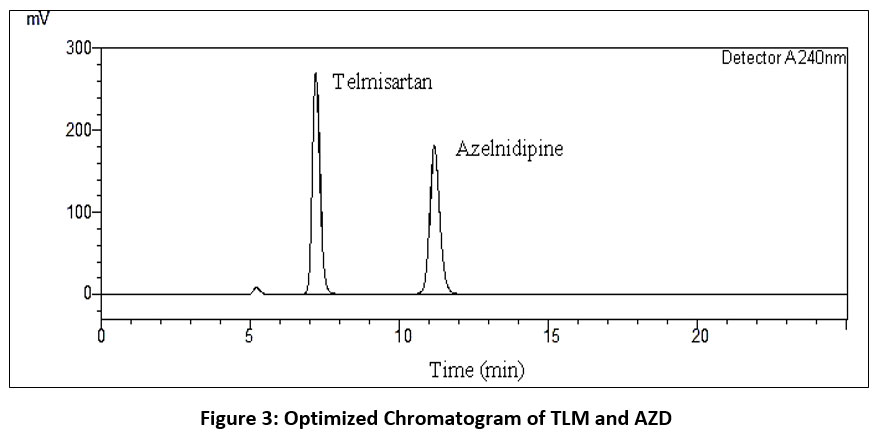 |
Figure 3: Optimized Chromatogram of TLM and AZD
|
Validation Parameters
CDER guidelines were followed for validating the established bioanalytical technique.
Calibration Curve and linearity
Using a least-squares methodology, a bioanalytical method calibration curve shows a linear relationship between response (the dependent variable) and concentration (the independent variable). Predicting the unknown amounts of the analytes within a complex matrix is the aim of this connection. A zero sample, a blank sample, and six to eight non-zero samples across the anticipated range, comprising LLOQ, should make up the linearity sample. The linearity was observed in the range 50,100,250,500,1000,1250,1500 and 2000 ng/ml for both TLM and AZD. The results were reported in table 2 and 3.
Table 2 displays the linearity concentration ranges. Plotting peak area against the matching drug concentration in human plasma allowed for the construction of calibration curves. For Telmisartan (TLM) and Azelnidipine (AZD), the regression equations were y = 955.55x − 3,515.76 and y = 860.6005x + 2,668.9360 respectively. With correlation coefficient (R2) values of 0.9998 for TLM and 0.9998 for AZD both calibration curves showed excellent linearity, indicating that the approach is suitable for quantitative quantification of both analytes. Figures 4 and 5 indicated the TLM and AZD calibration curves in human plasma respectively.
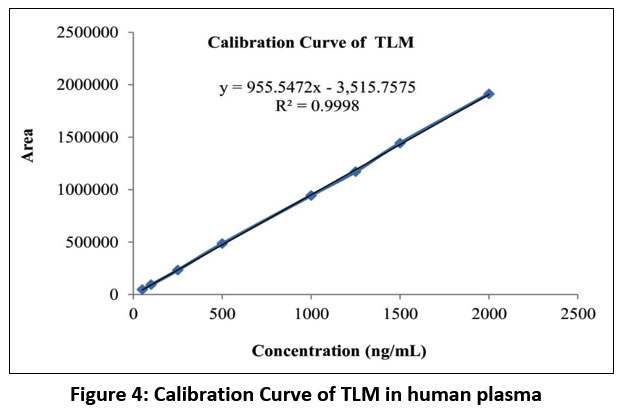 |
Figure 4: Calibration Curve of TLM in human plasma
|
With a correlation coefficient (R²) greater than 0.99, the calibration curve of Azelnidipine (AZD) in human plasma demonstrated good linearity over the chosen concentration range, confirming accurate quantification of AZD in plasma samples as shown in figure 5.
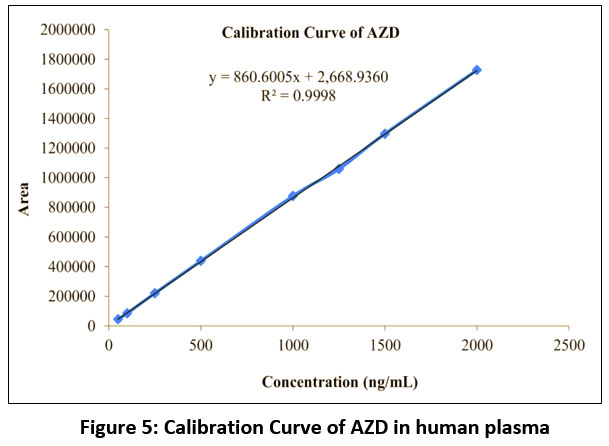 |
Figure 5: Calibration Curve of AZD in human plasma
|
Table 2: Linearity data of TLM and AZD
| Linear Solutions | Concentration
(ng/mL) |
Area of TLM | Area of AZD |
| STD A | 50 | 46629 | 43973 |
| STD B | 100 | 93258 | 84801 |
| STD C | 250 | 232236 | 219930 |
| STD D | 500 | 484466 | 438436 |
| STD E | 1000 | 943965 | 876310 |
| STD F | 1250 | 1170565 | 1057728 |
| STD G | 1500 | 1442951 | 1296395 |
Table 3: Linearity Parameters
| Parameters | TLM | AZD |
| Linearity Range (ng/mL) | 50-2000 | 50-2000 |
| Correlation Coefficient (R²) | 0.9998 | 0.9998 |
| Regression Equation | y = 955.5472x – 3,515.7575 | y = 860.6005x + 2,668.9360 |
Selectivity
To check for biological fluid or matrix interference in analyte chromatograms, selectivity must be carried out. This was accomplished by combining and analyzing normal blank human plasma obtained from six distinct sources using the established chromatographic settings. Figure 6 depicts blank chromatogram which indicates there was no plasma intervention at the analyte RT. In order to identify any analyte interferences other sources such as hemolyzed plasma and lipemic plasma of analysis were also carried out. After analyzing six distinct zero calibrators, it was discovered that hemolyzed and lipemic plasma did not affect with analyte retention times. Hence it was proved that method is selective.
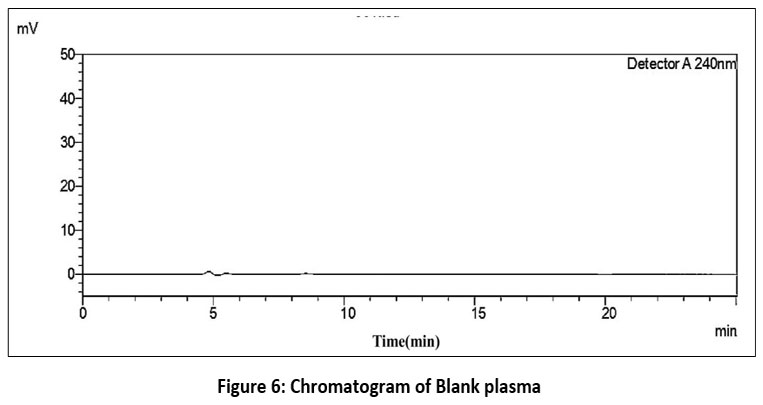 |
Figure 6: Chromatogram of Blank plasma
|
Sensitivity
Sensitivity tests are a validation parameter that determines the detection capacity of all analytes at all concentrations, even extremely small levels of analyte. It can be defined as the lowest analyte concentration (LLOQ) that can be determined with a reasonable degree of precision and accuracy. In order to evaluate sensitivity, samples of haemolyzed and lipemic plasma were examined after six replicates of the LLOQs of TLM and AZD. Both TLM and AZD were shown to be detectable at 50 ng/mL. The method’s sensitivity is demonstrated by the peak area RSDs of 2.95 and 3.65 for TLM and AZD respectively.
Similarly the system suitability parameters of the chromatographic runs were used to test the method’s sensitivity. The theoretical plates should be greater than 1500, the resolution should be greater than 2, and the acceptance limit of the asymmetry factor is 1. The asymmetry factor, theoretical plates, and TLM and AZD resolution values (Table 4) were found to be within acceptable bounds.
Table 4: System suitability parameters for TLM and AZD
| Name of Drug | Retention Time (Rt) | Area | Asymmetry | Theoretical plates (USP) | Resolution |
| TLM | 7.34 | 46017 | 0.94 | 3785 | – |
| AZD | 11.35 | 42739 | 1.12 | 4251 | 6.5 |
Carry Over
The carryover impact should be determined in order to observe the residual effect of subsequent chromatographic runs. It was observed that the area maxima at RT of TLM and AZD in the blank run that came after the ULOQ did not exceed 20% of LLOQ. This implied that the chromatographic run carryover effect was absent.
Precision and Accuracy
Six replications were analysed at five distinct quality control sites including LLOQ, LQC MQC, HQC, and ULOQ to evaluate accuracy and precision both within and between days. Six tests at five distinct concentration levels such as 50.02 ng/mL (LLOQQC), 149 ng/mL (LQC), 999 ng/mL (MQC), 1500 (HQC), and 1990 (ULOQQC) were conducted to evaluate the accuracy and precision of the TLM and AZD approach. By comparing the intraday and interday accuracy of the plasma samples the best mean % accuracies were found. The precision is expressed as a percentage of relative standard deviation (% RSD) and the accuracy is expressed as a percentage of theoretical concentration. (The observed concentration multiplied by 100 divided by the theoretical concentration). Table 5 presented the results. It was found that the percentage accuracy stayed within the analyte percentage assay limit and that all of the CV (%) values satisfied the guidelines acceptance requirements.
Table 5: Results of Precision and Accuracy of TLM and AZD
| Level | Mean Recovered conc. of TLM (ng/mL) (n=6) | % Accuracy | SD | CV (%) | Mean Recovered conc. of AZD (ng/mL) (n=6) | % Accuracy | SD | CV (%) |
| LLOQ | 51.58 | 103.12 | 2.95 | 2.9 | 50.29 | 100.55 | 3.65 | 3.6 |
| LQC | 152.71 | 102.49 | 2.05 | 2.0 | 150.72 | 100.81 | 3.95 | 3.9 |
| MQC | 1007.86 | 100.89 | 1.45 | 1.4 | 1010.51 | 101.1 | 3.01 | 3.0 |
| HQC | 1524.21 | 101.62 | 2.24 | 2.2 | 1493.69 | 99.58 | 2.78 | 2.7 |
| ULOQ | 1984.24 | 99.71 | 2.46 | 2.5 | 1985.82 | 99.79 | 2.17 | 2.2 |
Recovery
The corresponding QC level of both TLM and AZD were extracted, examined, and the recovery percentage was calculated. As indicated in Table 6, the recovery was found within the assay limit of the corresponding drugs.
Table 6: Recovery results of TLM and AZD
| TLM | AZD | ||||||
| QC Samples | Average Area of AQS (ng/mL) (n=6) | Average Area of Extracted drug
(ng/mL) (n=6) |
% Recovery | QC Samples | Average Area of AQS (ng/mL) (n=6) | Average Area of Extracted drug
(ng/mL) (n=6) |
% Recovery |
| LQC | 159080.5 | 142471 | 89.56 | LQC | 142506.8
|
132432.8
|
92.93
|
| MQC | 1061976 | 959994.5 | 90.39 | MQC | 934777.3
|
872719.8
|
93.36 |
| HQC | 1610930.3 | 1453623.8 | 90.23 | HQC | 1390979.6
|
1288733.7
|
92.64 |
Stability 70, 71
For stability studies, accuracy or nominal percentage should be ± 15% at certain QC levels.
Benchtop Stability
Ten hours have passed after the stability solutions were placed on the bench. For LQC and HQC, the AZD recovery percentages were 98.78% and 99.24%, respectively, while the benchtop stability TLM recovery percentages were 99.98% and 98.73%.
Stability at 2-8° C for 20 days
By evaluating freshly produced QC samples injected just after preparation with those at 2-8°C, the impact of storage within the autosampler was evaluated and it was found to be 98.6% for both TLM and AZD.
Freeze Thaw Stability
The extracted LQC and HQC of TLM and AZD underwent five freeze-thaw cycles. TLM recovery percentages were 99.25% and 98.78% for LQC and HQC respectively. While AZD recovery percentages were 100.26% and 99.88% for LQC and HQC respectively.
Autosampler Stability
Stability samples were stored in the auto sampler for a full day. The percentage recovery for AZD was 97.46% and 99.55% for LQC and HQC respectively, while the percentage recovery for auto sampler for TLM was 100.43% and 99.12% for LQC and HQC.
Long Term Stability
Spiked plasma samples were kept at -20°C for 30 days. LQC and HQC were created, processed, and injected right away following the 30 day period. The percentage of recovery was calculated. The percent recovery was found to be 100.82% and 98.9% for LQC and HQC respectively of TLM. For LQC and HQC, the recovery percentages were determined to be 98.73% and 99.75% of AZD respectively.
Discussion
The simultaneous measurement of AZD and TLM in human blood plasma was accomplished through the successful development and validation of a straightforward, quick, and accurate RP-HPLC bioanalytical approach. Because of their frequent usage in fixed-dose antihypertensive medication and the requirement for pharmacokinetic monitoring, simultaneous analysis is especially significant. Due to its enhanced soluble properties, efficient extraction, and reproducible peak responses, methanol and water (80:20) was chosen as the diluent. Peak symmetry and resolution were low in the initial mobile phase systems; however optimization using acetonitrile and ammonium acetate buffer (50 mM, pH 4.5) produced symmetrical, well-resolved peaks with improved sensitivity and a shorter run time, probably as a result of improved analyte ionization control and decreased matrix interference.
During pharmacokinetic investigations, the method’s low LLOQ of 50 ng/mL and great linearity between 50-2000 ng/mL (R2 = 0.9998) indicated its potential for plasma concentration detection. Selectivity and system dependability were confirmed by the absence of endogenous interference or carryover. The consistent extraction recovery values (89–93%) met regulatory requirements, indicating effective and repeatable sample preparation. Stability studies confirmed that both drugs remained stable under bench-top, refrigerated (2-8 °C), freeze-thaw, autosampler, and long-term storage conditions. All things considered, the validated RP-HPLC method offers a reliable, sensitive, and economical analytical instrument appropriate for routine bioanalytical, pharmacokinetic, bioavailability, and bioequivalence studies of combination antihypertensive medication.
Conclusion
Telmisartan (TLM) and Azelnidipine (AZD) were stable in human plasma throughout a variety of handling and storage settings, including preparation of samples, short-term processing and prolonged storage according to stability studies. The measured concentrations stayed below ±15% of nominal values at all quality control measurements meeting regulatory acceptance requirements and showing very little analyte degradation. According to these results, the suggested analytical method reduces the possibility of concentration bias during pharmacokinetic assessment by maintaining drug integrity throughout standard bioanalytical procedures. The method’s reproducibility and dependability are further demonstrated by its high degree of accuracy and precision (99-103%).
The suggested reverse-phase high-performance liquid chromatography (RP-HPLC) method in conjunction with solid-phase extraction offers a reliable and effective method for the production and analysis of plasma samples given the appropriate experimental conditions. Large pharmacokinetic or bioequivalence investigations can benefit from the method’s short chromatographic run time i.e. less than 20 min which facilitates high sample throughput. Reliable quantification in complicated biological matrices is ensured by excellent selectivity which is shown by the lack of endogenous or matrix interferences.
The overall performance characteristics which include selectivity, accuracy, precision, stability, and operational simplicity show that the developed method is reliable and appropriate for its intended use. For regular bioanalysis, preclinical and clinical pharmacokinetic research and therapeutic drug monitoring of combination TLM and AZD therapy, the approach can thus be used with confidence.
Acknowledgement
The authors wish to express their sincere gratitude to the Principal of Mahatma Gandhi Vidyamandir’s Pharmacy College, Nashik, for the continuous guidance and support provided throughout this work. The authors also extend their sincere thanks to Mr. Amol More, Industry Head of Core Analytical, Nashik, for providing the essential facilities required to carry out this bioanalytical research work.
Funding Sources
The author(s) received no financial support for the research, authorship, and/or publication of this article.
Conflict of interest
The authors do not have any conflict of interest.
Data Availability Statement
This statement does not apply to this article.
Ethics Statement
This research did not involve human participants, animal subjects, or any material that requires ethical approval.
Informed Consent Statement
This study did not involve human participants and therefore, informed consent was not required.
Clinical Trial Registration
This research does not involve any clinical trials.
Permission to reproduce material from other sources
Not Applicable
Author Contributions
- Deepali Dattatray Bhandari: Data Collection, Analysis, Writing – Review & Editing.
- Charushila Jayant Bhangale: Review & Editing, formal analysis.
- Santosh Ranganath Tambe: Resources,
- Sunil Vishwanath Amrutkar : Resources
References
- PubChem. Azelnidipine Accesed April 2023. https://pubchem.ncbi.nlm.nih.gov/compound/ Azelnidine.
- National Center for Biotechnology Information. 2022. PubChem Compound Summary for CID 65948, Azelnidipine. Retrieved August 24.
- Wienen W, Entzeroth M, van Meel J.C, et al. A review on telmisartan: a novel, long‐acting angiotensin II‐receptor antagonist. Cardiovasc Drug Rev. 2000 Jun; 18(2):127-54.
CrossRef - Gosse P. A review of telmisartan in the treatment of hypertension: blood pressure control in the early morning hours. Vasc Health Risk Manag. 2006 Sep 30; 2(3):195-201.
CrossRef - Mandale D, Mistry R, Chauhan N. An analytical approach of azelnidipine: A review. World J Pharm Res. 2021 Jan 2; 10(3):682-92. DOI: 10.20959/wjpps20213-18460
- Littlejohn T, Mroczek W, Marbury T, VanderMaelen C.P, Dubiel R.F. A prospective, randomized, open-label trial comparing telmisartan 80 mg with valsartan 80 mg in patients with mild to moderate hypertension using ambulatory blood pressure monitoring. Can J Cardiol. 2000; 16(9):1123-32.
- Jansirani D, BegumS, Velmurugan G.G, Ramalakshmi K, Indiraleka M. Standardizing sample preparation: ensuring integrity in urinary omics. InExploring Noninvasive Disease Biomarkers with Urinary Omics Analysis. AP. 2025; 95-115. https://doi.org/10.1016/B978-0-443-33574-7.00011-0
CrossRef - Bylda C, Thiele R, Kobold U, Volmer D.A. Recent advances in sample preparation techniques to overcome difficulties encountered during quantitative analysis of small molecules from biofluids using LC-MS/MS. 2014; 139(10):2265-2276. DOI: 10.1039/C4AN00094C
CrossRef - Medvedovici A, Bacalum E, David V. Sample preparation for large‐scale bioanalytical studies based on liquid chromatographic techniques. Biomed Chromatogr. 2018; 32(1):e4137. https://doi.org/10.1002/bmc.4137
CrossRef - Buszewski B, Szultka M. Past, present, and future of solid phase extraction: a review. Critical Reviews in Analytical Chemistry. Crit Rev Anal Chem. 2012; 42(3):198-213. https://doi.org/10.1080/07373937.2011.645413
CrossRef - Alexovic M, Dotsikas Y, Bober P, Sabo J. Achievements in robotic automation of solvent extraction and related approaches for bioanalysis of pharmaceuticals. J Chromatogr B. 2018; 1092: 402-21. https://doi.org/10.1016/j.jchromb.2018.06.037
CrossRef - Bhosale A.P, Pingle A.P. Bioanalytical RP-HPLC method development and validation for estimation of azelnidipine and Olmesartan medoxomil in human plasma. J Med Pharm Allied Sci. 2022; 11(5):5235-5239. DOI: 10.55522/jmpas.V11I5.4270
CrossRef - Desai P.B, Patel K, Patel C.N, Chaudhary P.K. The Role of Azelnidipine and Telmisartan in Managing Stage-II Hypertension: A Comprehensive Review Structure. 2025; 10(4):1394-1396. DOI : https://doi.org/10.38124/ijisrt/25apr189
CrossRef - The Indian Pharmacopoeia, Government of India, Ministry of Health and Family welfare; 7th ed., The Indian pharmacopeia commission, Ghaziabad, 2018; II: 1304-1305, 3319-3320.
- Japanese Pharmacopoeia, 17th Edition, The Ministry of Health Labour and Welfare, 2016; 704-707
- United State Pharmacopeia-43, NF-38, 38th edition, The United States Pharmacopeial Convention, 2020; II: 4239-4240.
- British Pharmacopeia, 10th edition, Medicines and healthcare products regulatory agency, 2022; II: 1085-1086.
- Raskapur K.D, Patel M.M, Captain A.D. UV-Spectrophotometric method development and validation for determination of Azelnidipine in pharmaceutical dosage form. Int J Pharm Sci. 2012; 4(1):238-240.
- Patel N, Patel J. Simultaneous determination of azelnidipine and olmesartan medoxomil by first derivative spectrophotometric method. DPL. 2012; 4(4).
- Rele R.V. Spectrophotometric estimation of azelnidipine in bulk and pharmaceutical dosage form by second order derivative method. J Chem Pharm Res. 2014; 6(8):198-202.
- Mukeri I.H, Kushwaha A.K, Neupane N. P. et al. Analytical method development and validation of azelnidipine by UV-visible spectroscopy. World J Pharm Res. 2021; 10(10):858-72. DOI: 10.20959/wjpr202110-21174
- Attimarad M, Chohan M.S, Katharigatta N. V. et al. Mathematically processed UV spectroscopic method for quantification of chlorthalidone and azelnidipine in bulk and formulation: evaluation of greenness and whiteness. J Spectrosc. 2022; (1):4965138. https://doi.org/10.1155/2022/4965138
CrossRef - Pradhan K.K, Mishra U.S, Sahoo A, Sahu K.C, Mishra D, Dash R. Method development and validation of Telmisartan in bulk and pharmaceutical dosage forms by UV Spectrophotometric method. Int J Res Phar Sci. 2011; 2(4):526-30.
- Kumar M, Kumar C, Bhatt S, Pandurangan A. et al. Dissolution method development and validation for tablet dosage form of Telmisartan using UV spectrophotometric method. J Chem Pharm Res. 2018; 10(5):148-56.
- Rathod S.D, Patil P.M, Waghmare S.S, Chaudhari P.D. UV-spectrophotometric method for estimation of telmisartan in bulk and tablet dosage form. Int J Pharm Sci Res. 2012; 3(10):3936.
- Jose E, Nair A.C, Kuttichan M, Govind V.A. Development and validation of a solvent extraction UV spectrophotometric method for the estimation of rosuvastatin calcium and telmisartan in combined dosage form. Res J Pharm Technol. 2022; 15(5):2065-9.
CrossRef - Sanap R.M, Wavhale S.R, Kunjir V.V, Shete R.V. Analytical method development and validation for telmisartan, chlorthalidone and amlodipine by uv-spectroscopic method. Res J Pharm Technol. 2021; 14(11):6049-54.
CrossRef - Patel J. K, Patel N. K. Validated stability-indicating RP-HPLC method for the simultaneous determination of azelnidipine and olmesartan in their combined dosage form. Sci Pharm. 2014; 82(3):541. doi: 10.3797/scipharm.1312-14
CrossRef - Prabhakar D, Sreekanth J, Jayaveera K. N. Method development and validation of Azelnidipine by RP-HPLC. Int J ChemTech Res. 2018; 11:7-12.
- Gore M. G, Dabhade P. S. RP-HPLC method development and validation of azelnidipine. Int J Pharma Sci Res. 2016; 7(12):5111.
- Upendra B, Hemant D, Kumar D. A. RP-HPLC Method development and validation for estimation of telmisartan in bulk and tablet dosage form. Int J Drug Regul Aff. 2013; 1(2):61-4.
CrossRef - Sahu L. K, Si S, Patro S. K. Stability indicating assay of Telmisartan in tablets. Int J Pharm Sci Res. 2022; 13(1):439-44. DOI: 10.13040/IJPSR.0975-8232.13(1).439-44
CrossRef - Gholve R, Pekamwar S, Wadher S, Kalyankar T. Stability-indicating RP-HPLC method development and validation for simultaneous estimation of telmisartan and rosuvastatin calcium in bulk and in tablet dosage form. Future J Pharm Sci. 2021; 7(1):224. https://doi.org/10.1186/s43094-021-00369-2
CrossRef - Barge V. U, Gaikwad R. B, Chaudhari F. M, Kande T. R. Development and validation of analytical method for simultaneous estimation of bisoprolol fumarate and telmisartan by using RP-HPLC method. J Pharm Clin Res. 2018; 10(8):219-23.
- Kumar M, Chandra U, Garg A, Gupta P. A. Stability indicating RP-HPLC method validation for simultaneous estimation of azelnidipine and telmisartan in a fixed-dose combination. Int J Pharm Sci Drug Res. 2021; 13(3):288-94. DOI: 25004/IJPSDR.2021.130308
CrossRef - Panda M, Dadi V, Yarraguntla S. R, Rao V. P. RP-HPLC method for determination of azelnidipine and telmisartan in pharmaceutical dosage form. Res J Pharm Technol. 2023; 16(2):509-13.
CrossRef - Harshith K, Jinesh B, Bindhyashree K, Sahana K, Hanumanthachar K. J. Analytical Method Development and Validations for Simultaneous Estimation of Antihypertensive Drugs. Eur J Pharm Med Res. 2023; 10: 463-469.
- Dinakaran V, Unnissa S. H. Development and validation of an RP-HPLC Method for the simultaneous estimation of azelnidipine and telmisartan in pharmaceutical tablet dosage form. Res J Pharm Technol. 2023; 16(6):2638-42.
CrossRef - Godela R, Gummadi S, Pathak S, Pola K. K, Yagnambhatla R. RP-HPLC–PDA approach for concurrent analysis of telmisartan and azelnidipine in bulk and commercial tablets. Chem Afr. 2023; 6(1):393-403.DOI: https://doi.org/10.1007/s42250-022-00483-5OI:
CrossRef - Panda M, Dadi V, Yarraguntla S. R, Rao V. P. RP-HPLC method for determination of azelnidipine and telmisartan in pharmaceutical dosage form. Res J Pharm Technol. 2023; 16(2):509-13.
CrossRef - Agrawal S, Nizami T. Method Development and validation for the simultaneous determination of azelnidipine and telmisartan in tablet dosage form by RP-HPLC. Int J Pharm Sci Med. 2021; 6(10):2519-9889. DOI: 10.47760/ijpsm.2021.v06i10.003
CrossRef - Modi J, Patel S. K, Parikh N, Shah S. R, Pradhan P. K, Upadhyay U. M. Stability indicating analytical method development and validation for estimation of azelnidipine. World J Pharm Res. 2016; 5(2):831-47.
- Andrews B. S, Abbaraju V. K, Lakshman S, Vijayalakshmi K. Quantification of Telmisartan and Azelnidipine Combination in Using Liquid Chromatography: Stability studies. Orient J Chem. 2023 Oct 1; 39(5). http://dx.doi.org/10.13005/ojc/390525
CrossRef - Deore K, Shah U. Stability-Oriented RP-HPLC Method Development for Simultaneous Quantification of Azelnidipine and Telmisartan in Pharmaceutical Dosage Forms. Library of Progress-Library Science, Information Technology & Computer. Acad J. 2024; 44(3).
- Sonawane S. S, Bankar P. C, Kshirsagar S. J. Stability-indicating LC method for quantification of azelnidipine: synthesis and characterization of oxidative degradation product. Turk J Pharm Sci. 2021; 18(5):550. doi: 10.4274/tjps.galenos.2020.76753
CrossRef - Reddy M. R, Kumar A. P, Reddy V. K, Haque S. W. Stability-indicating hplc method for simultaneous estimation of low level impurities of telmisartan and hydrochlorothiazide in tablet dosage forms. Int J Pharm Pharm Sci. 2012; 4(1):497-504.
- Rupareliya R. H, Joshi H. S. Stability Indicating Simultaneous Validation of Telmisartan and Cilnidipine with Forced Degradation Behavior Study by RP‐HPLC in Tablet Dosage Form. Int Sch Res Notices. 2013; 2013(1):461461. https://doi.org/10.1155/2013/461461
CrossRef - Kumar S. A, Venkateshwar R, Jupally T, Kumar M. Development and validation of a stability indicating RP-HPLC method for simultaneous determination of telmisartan and amlodipine in combined dosage form. Asian J Pharm Clin Res. 2014; 7(1):32-5.
- Ponnekanti K. R, Sunitha K. Development of HPLC stability demonstrating methodology for quantifying azelnidipine and telmisartan in tablets and bulk types: validation following ICH directives. Int J Appl Pharm. 2021; 13(5): 298-305. DOI: https://dx.doi.org/10.22159/ijap.2021v13i5.42099.
CrossRef - Spandana K. V, Subhashini N. J. Telmisartan and azelnidipine quantification employing HPLC stratagem; stability investigation on Telmisartan and azelnidipine. Int J Appl Pharm. 2022; 14(1):261-5. DOI: https://dx.doi.org/10.22159/ijap.2022v14i1.43321
CrossRef - Rane A. S, Mahajan S. K. Validation and forced stability-indicating HPTLC method for determination of azelnidipine. World J Pharm Res. 2016; 5(9):1053-62. DOI: 10.20959/wjpr20169-6930
- Prabhu C, Subramanian G. S, Karthik A, Kini S, Rajan M. S, Udupa N. Determination of telmisartan by HPTLC-a stability indicating assay. J Planar Chromatogr. 2007; 20(6):477-81. DOI: 10.1556/JPC.20.2007.6.14
CrossRef - Lakshmi K. S, Sivasubramanian L, Pal K. Stability indicating HPTLC method for simultaneous determination of telmisartan and ramipril in tablets. Int J Pharm Pharm Sci. 2010; 2(4):127-9.
- Kachhiya H, Tandel J, Rupchandani I, et al. Development and validation of HPTLC method for simultaneous estimation of azelnidipine and telmisartan. J Adv Drug Discov Dev. 2023; 1: 28-38.
- Naguib I.A, Abdelkawy M. Development and validation of stability indicating HPLC and HPTLC methods for determination of sulpiride and mebeverine hydrochloride in combination. Eur J Med Chem. 2010; 45(9):3719-25. https://doi.org/10.1016/j.ejmech.2010.05.021
CrossRef - Jawla S, Jeyalakshmi K, Krishnamurthy T, Kumar Y. Development and validation of simultaneous HPLC method for estimation of telmisartan and ramipril in pharmaceutical formulations. Pharm Tech Res. 2010; 2(2):1625-33.
- Kawabata K, Urasaki Y. Simultaneous determination of azelnidipine and two metabolites in human plasma using liquid chromatography-tandem mass spectrometry. J Chromatogr B. 2006; 844(1):45-52. https://doi.org/10.1016/j.jchromb.2006.06.031
CrossRef - Sudha T, Tamizhselvi S, Dinesh K. S, Prabhakar V, Muthuraj M, Vivekanandan N. Method Development and Validation of Telmisartan, Chlorthalidone and Metoprolol Succinate using RP-LC/MS Experimental Design Method (CCD) in Bulk and Tablet Dosage Form. Eur chem bull. 2023; 12(5):1-7. DOI: – 10.31838/ecb/2023.12.si5.00xyz
- Das D, Halder D, Maji H. S, De P. K, Pal T. K. Special emphasis on bioanalytical method development and validation of an anti-hypertensive drug azelnidipine by lc-esi-ms/ms in healthy human volunteer’s blood plasma. Res J Pharm Technol. 2021; 14(7):3571-7.
CrossRef - Suneetha G, Venkateswarlu P. Sensitive Analysis of Azelnidipine and Related Derivative in Human Plasma by Ultra-Performance Liquid Chromatography-Tandam Mass Spectrometry. Asian J Chem. 2013; 25(18):10319.
CrossRef - Patra B. R, Mohan S, Gowda N. Stability-indicating RP-UHPLC method for determination of telmisartan in drug substance and marketed formulation. Int J of Pharma Sci and Res. 2016; 7(5):2031.
- Bhavani V, Rao T.S, Raju S.V, Madhusudan B, Begum J. Stability indicating UPLC method for the estimation of telmisartan related substances in tablets formulation. Int J Sci and Res Pub. 2013; 3(2):1-8.
- Eslawath U. R, Kannappan N, Venkateshwarlu L, Smith A.A. Stability indicating RP-UPLC method development and validation for the simultaneous estimation of Telmisartan and Azelnidipine in their Bulk and Solid Dosage Forms. Biochem Cell Arch. 2023; 23(2). DOI: 10.51470/bca.2023.23.2.1243
CrossRef - Pogaku B, Makula A, Santhosh S, Gnanasambanthan H, Sarkar S, Guduru R.K. A High‐Throughput RP‐UPLC Assay for Simultaneous Determination of Telmisartan and Azelnidipine in Pharmaceutical Formulations. Biotechnol Appl Biochem. 2025; e2765. DOI: https://doi.org/10.1002/bab.2765
CrossRef - Amin A, Saad M, Ahmed M. A. Simultaneous determination of azelnidipine and olmesartan medoxomil in pharmaceutical dosage forms by UFLC method. Pharma Sci Tech. 2016; 6(2):69-74.
- Palakurthi A. K, Dongala T, Katakam L. N. QbD based development of HPLC method for simultaneous quantification of Telmisartan and Hydrochlorothiazide impurities in tablets dosage form. Pract Lab Med. 2020; e00169. https://doi.org/10.1016/j.plabm. 2020.e00169
CrossRef - Bera A, Shah K. Advanced forced degradation technique for simultaneous estimation of azelnidipine and telmisartan implementing AQbD approach in its tablet dosage form. Int J Health Sci. 2022; 6(S8):866-83. DOI: 53730/ijhs.v6nS8.9812
CrossRef - Patel J. M, Dhingani A. P, Garala K. C, Raval M. K, Sheth N. R. Development and validation of bioanalytical HPLC method for estimation of telmisartan in rat plasma: application to pharmacokinetic studies. Dhaka Univ J Pharm Sci. 2012; 11(2):121-7. https://doi.org/10.3329/dujps.v11i2.14562
CrossRef - Guideline IH. Bioanalytical method validation and study sample analysis M10. ICH Harmonised Guideline: Geneva, Switzerland. 2022.
- ICH Q14: Analytical Procedure Development (draft version). 2022; 1–64. https://www.teses.usp.br/teses/disponiveis/11/11132/tde-20200111 131624/publico/ParreJoseLuiz.pdf.
- ICH guideline M10 on bioanalytical method validation, 13 March 2019, European medicine Agency EMA/CHMP/ICH/172948/2019. https://www.ema.europa.eu/en/ich-m10-bioanalytical method validation.
Abbreviations list
TLM – Telmisartan
AZD – Azelnidipine
mM – milimolar
mm- milimeter
µm- micrometer
mL- millilitre
v/v- Volume by volume
UV- Ultraviolet
nm – nanometer
ng- nanogram
DCGI – Drug Controller General of India
ARB – angiotensin II receptor blocker
IUPAC – International Union of Pure and Applied Chemistry
LPME –liquid-phase microextraction,
LLE- liquid-liquid extraction
SLE – solid-liquid extraction
SPE- Solid Phase Extraction
RP-HPLC – Reverse-Phase High-Performance Liquid Chromatography
HPTLC – High-Performance Thin-Layer Chromatography
LC-ESI-MS – Liquid Chromatography-Electrospray Ionization-Mass Spectrometry
UPLC-MS – Ultra-Performance Liquid Chromatography–Tandem Mass Spectrometry
UFLC – Ultra Fast Liquid Chromatography
QbD – Quality by Design
AR – Analytical Reagent
RPM – Revolution per minute
API – Active Pharmaceutical Ingredient
ICH – International Council for Harmonisation of Technical Requirements for Pharmaceuticals for Human Use
FDA – Food and Drug Administration
CDER – Center for Drug Evaluation and Research
Min – Minutes
CC – Calibration Curve
QC – Quality Control
LLOQ – Lower Limit of Quantification
LQC – Low Quality Control
MQC – Medium Quality Control
HQC – High Quality Control
ULOQ – Upper Limit of Quantification
CV – Coefficient of Variation
% RSD – Percent Relative standard deviation
R2 – Correlation Coefficient
SD – Standard Deviation
STD – Standard
Accepted on: 24-02-2026
Second Review by: Dr. Samara Sameer Yonus and Dr. Omar Kiydar Hassan
Final Approval by: Dr. Wagih Ghannam


![]()
![]()
