
Bioanalytical Method Development and Validation for Simultaneous Estimation of Brexpiprazole and Fluoxetine Hydrochloride in Human Plasma by RP-HPLC
 and Manoj Ramesh Kumbhare
 Department of Pharmaceutical Chemistry, S.M.B.T. College of Pharmacy, Affiliated to Savitribai Phule Pune University, Maharashtra, India.
Corresponding Author E-mail: prdighe85@gmail.com
DOI : http://dx.doi.org/10.13005/bbra/3492
Download this article as:
![]()
The present work aimed to develop a bioanalytical RP-HPLC technique for the simultaneous quantification of brexpiprazole (BREX) and fluoxetine hydrochloride (FLX) in human plasma. The chromatographic separation was performed on a Phenomenex C18 column (250 mm × 4.6 mm, 5 µm). The chromatogram was recorded at 224 nm. As an internal standard (IS), fimasartan was used. The mobile phase was composed of acetonitrile and 0.05% orthophosphoric acid in water (35:65), and with a flow rate of 1.0 mL/min. Separation was carried out in an isocratic mode. The protein precipitation method was used to isolate the analytes from the spiked plasma matrix. The retention times (RT) of BREX, IS, and FLX were 3.69, 4.91, and 6.82 min, respectively. With regression coefficients r² = 0.9996 and 0.9993 for BREX and FLX, respectively. The developed method demonstrated an acceptable linearity in the concentration range of 1.40–56 µg/mL. The extraction recovery of BREX was in the range of 82.57% to 85.26%, and for FLX, 91.74% to 94.05%. The stability studies showed no evidence of analyte degradation. Hence, the developed method can be used for the simultaneous quantification of BREX and FLX in biological samples.
KEYWORDS:Brexpiprazole; Bioanalytical method validation; Fluoxetine hydrochloride; Mood disorders; Protein precipitation; Serotonin transporter
Introduction
Mood disorders and depression affect millions of people worldwide, endangering public health.1 FLX, a selective serotonin reuptake inhibitor (SSRI), is primarily used to treat anxiety disorders, depression, and associated illnesses.2 Chemically it is (3RS)-N-methyl-3-phenyl-3-[4-trifluoromethyl-phenoxy)-propan-1-amine hydrochloride.3. FLX inhibits the serotonin transporter (SERT), a protein that, once released into the synaptic cleft, reabsorbs serotonin (5-hydroxytryptamine) in the presynaptic neuron.4 FLX increases serotonin in the synaptic cleft by blocking this transporter, which enhances serotonergic neurotransmission and improves mood and emotional stability. It has a long half-life and produces the active metabolite norfluoxetine, which extends its duration of action.5 To improve treatment outcomes, augmentation techniques are necessary, as many patients do not respond well to SSRIs alone.6,7 BREX, a second-generation atypical antipsychotic, has recently demonstrated promise as an adjuvant to SSRIs in the treatment of major depressive disorders.8 Chemically it is 7-{4-[4-(1-benzo-thiophen-4-yl) piperazin-1-yl] butoxy} quinolin 2-(1H)-one.9 Due to its partial agonist action at serotonin 5-HT1A and dopamine D2 receptors and antagonist action at serotonin 5-HT2A receptors, this serotonin-dopamine activity modulator (SDAM) has a positive side-effect profile as well as antidepressant and antipsychotic effects. 10,11 BREX and FLX co-administration is becoming more clinically significant, particularly for patients who only partially respond to monotherapy.
By utilizing the synergistic effects of serotonergic and dopaminergic regulation, the combination enhances treatment results for mood disorders.12 This treatment approach also raises issues regarding safety monitoring and pharmacokinetic interactions, as FLX is a potent inhibitor of cytochrome P450 enzymes, mainly CYP2D6, which is involved with the metabolism of BREX. 13,14 Therefore, to prevent adverse effects and ensure therapeutic efficacy, it is necessary to monitor the plasma concentrations of both drugs simultaneously. Figure 1 illustrates the chemical structures of BREX and FLX.
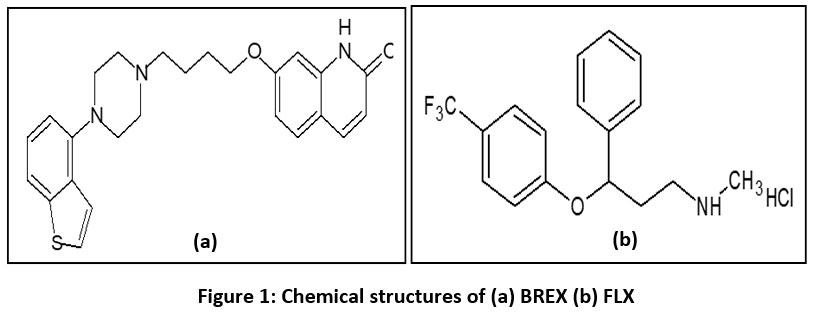 |
Figure 1: Chemical structures of (a) BREX (b) FLX
|
A review of the literature revealed a few analytical techniques for estimating BREX and FLX, including the QbD-based UPLC method for estimating BREX9, the bioanalytical method for estimation of BREX in dog plasma by UPLC–MS-MS,15 estimation of BREX in bulk drug or formulation by RP-HPLC,16-21 determination of BREX in bulk and formulation by HPTLC,22 estimation of BREX in tablet formulation by spectrophotometry,23 spectrofluorimetric methods,24-26 simultaneous determination of FLX and BREX by HPLC to test the purity of both drugs in pharmaceutical formulations by monitoring fluoxetine-related impurities,27 and estimation of FLX alone or with other drugs in bulk, formulation, and biological fluids by spectrophotometry.28-30
There is currently no validated bioanalytical RP-HPLC method reported for the simultaneous quantification of BREX and FLX in human plasma, even though several techniques have been reported for the individual estimation of FLX and BREX. The validated method was applied to real plasma samples.
Materials and Methods
Reagents and chemicals
The chemicals and reagents were of analytical grade. FLX and fimasartan were purchased from Swapnroop Drugs, Sambhajinagar, India, while BREX was kindly supplied by Lupin Limited, Pune, India. The HPLC-grade acetonitrile, water, and methanol, as well as analytical-grade formic acid and orthophosphoric acids, were acquired from Shri Ganesh Services (Nashik, India). Human plasma was received from Arpan Blood Bank, Sangamner, India.
Instrumentation and chromatographic conditions
The separation was achieved by isocratic elution using a Phenomenex C18 column (250 mm × 4.6 mm, 5 µm) on an Agilent HPLC provided with a quaternary gradient pump. The mobile phase consists of acetonitrile and 0.05% orthophosphoric acid (35:65). The separation was achieved within 10 min using a 1 mL/min flow rate, and the injection volume was 20 µL. Detection was performed at 224 nm using a UV detector.
Preparation of stock solution, calibration standards, and quality control samples
Accurately weighed quantities of BREX and FLX (purity 99.0%–101.0%) were diluted with methanol to prepare separate stock solutions (1600 ug/mL). The calibration stock solutions (1600 µg/mL) of BREX and FLX were diluted with methanol to prepare aqueous linearity solutions (28, 160, 400, 560, 840, and 1120 µg/mL) of BREX and FLX, respectively. These solutions were diluted with blank plasma to prepare calibration standards (1.40, 8, 20, 28, 42, and 56 µg/mL) of BREX and FLX, respectively. The LLOQ was set based on signal response. A concentration of 50 µg/mL of BREX and FLX gives 107 mAu and 116 mAu peak heights, respectively; therefore, 1.4 µg/mL yields approximately 3 mAu peak heights, which was selected as the LLOQ. This value represents ≤5% of the Cmax (28 µg/mL) as per EMEA guidelines. The ULOQ is twice the Cmax, i.e., 56 µg/mL. Therefore, the linearity range was selected as 1.4–56 µg/mL. Aqueous quality control (QC) solutions of both drugs were prepared by diluting QC stock of each drug (1600 µg/mL) with methanol to get 28, 80, 560, and 896 µg/mL. Similarly, four QC samples at 1.40, 4, 28, and 44.80 µg/mL for BREX and FLX were prepared by diluting respective aqueous QC solutions in blank plasma and treated as Lower Limit of Quantification (LLOQ), Lower Quality Control (LQC), Middle Quality Control (MQC), and Higher Quality Control (HQC), respectively. The calibration standards and QC samples were kept at -20°C and taken out during analysis. The proposed method is not suitable for low-level pharmacokinetic profiling but rather for higher concentration applications such as formulation studies and spiked plasma analysis.
Sample Preparation
BREX and FLX were extracted from plasma using protein precipitation. Plasma samples (calibration curve standards, QC samples) were vortexed for one minute and then placed in a deep freezer. All frozen samples were thawed and allowed to equilibrate to room temperature prior to analysis. 50 µL of IS solution was added to 500 µL of spiked plasma samples (calibration curve standards and QC samples), and the mixture was vortexed for one minute. After adding 20 µL of 2% formic acid, the mixture was vortexed for one minute. 1 mL of acetonitrile was added and vortexed for two minutes. The samples were centrifuged at 4000 rpm for three minutes. Supernatant, 0.5 mL, was withdrawn and injected. The absorption maxima of BREX and FLX were reported as 217 nm and 226 nm, respectively. The overlay spectrum of both drugs (Fig. 2) shows significant absorption at 224 nm as an isoabsorptive point. Fig. 3 illustrates the chromatogram of BREX, FLX, and IS that were extracted from plasma.
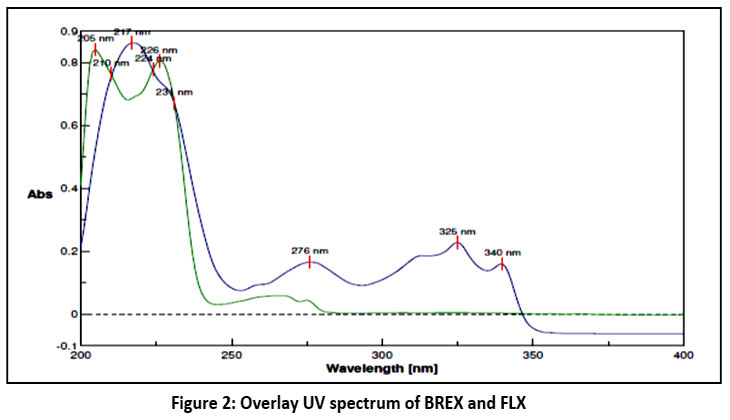 |
Figure 2: Overlay UV spectrum of BREX and FLX
|
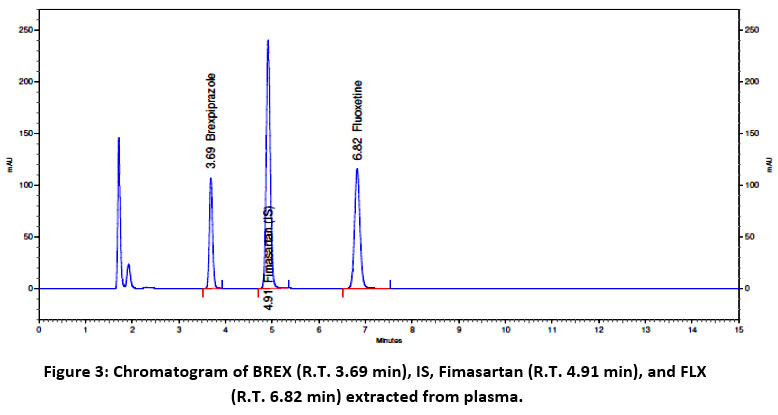 |
Figure 3: Chromatogram of BREX (R.T. 3.69 min), IS, Fimasartan (R.T. 4.91 min), and FLX (R.T. 6.82 min) extracted from plasma.
|
Method validation
The method was validated for sensitivity, selectivity, carryover, accuracy, precision, and recovery. Stability studies include bench-top, freeze-thaw, auto-sampler, stability of processed extracted samples, and stock solution stability. Validation of the developed method was performed according to the bioanalytical validation guidelines established by the US Food and Drug Administration (US-FDA) and European Medicines Agency (EMEA).31,32
Results
Selectivity
Peak interference was determined using eight independent sources of blank plasma, including six human plasma samples along with lipemic and hemolyzed plasma. The selectivity was determined by comparing results with the lower limit of quantification (LLOQ). Chromatograms of blank and spiked plasma samples, containing drugs and internal standards (IS), were analyzed for interference (Figures 4 and 5).
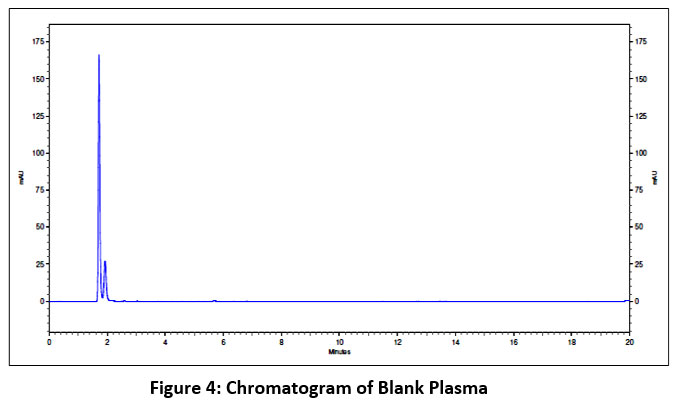 |
Figure 4: Chromatogram of Blank Plasma
|
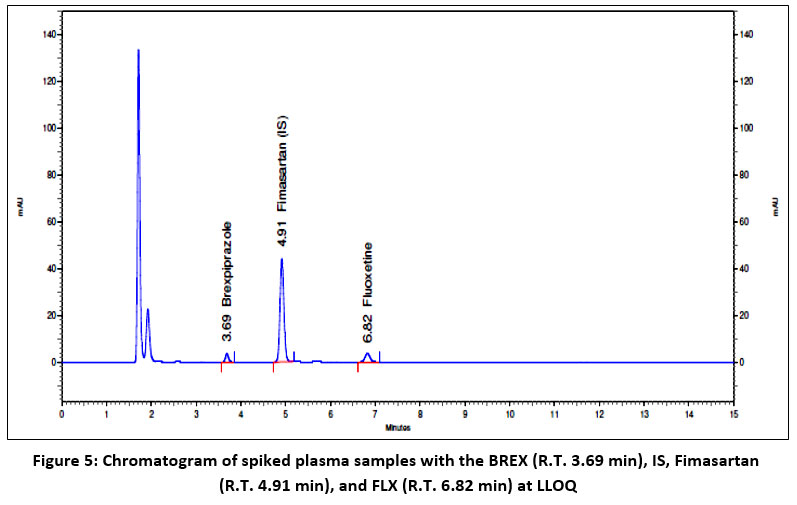 |
Figure 5: Chromatogram of spiked plasma samples with the BREX (R.T. 3.69 min), IS, Fimasartan (R.T. 4.91 min), and FLX (R.T. 6.82 min) at LLOQ
|
Sensitivity
Six replicates of the LLOQ obtained from the same plasma sample were used in a sensitivity test. 475 µL plasma were transferred into six dry, clean 15 mL tarson tubes. The tubes were vortexed for one minute after adding 25 µL of aqueous LLOQ solution to each tube. 50 µL of IS solution was then added, followed by vortexing for one minute. The mixture was vortexed for another minute after adding 20 µL of 2% formic acid. In order to precipitate the proteins, 1.0 mL of acetonitrile was added, and the samples were vortexed for two minutes. The samples were centrifuged for three minutes at 4000 rpm. The supernatant 0.5 mL was withdrawn and injected. (Table 1).
Table 1: Observation summary of sensitivity
| Area of BREX at LLOQ | Area of FLX at LLOQ |
| 272531 | 512634 |
| 294635 | 490531 |
| 296352 | 496124 |
| 271531 | 505417 |
| 286524 | 480634 |
| 257451 | 526524 |
| Mean 279837 | Mean 501977 |
| SD 15231.16716 | SD 16424.08373 |
| % CV 5.44 | % CV 3.27 |
Carryover
In order to measure carryover, the same blank sample was injected three times. The upper limit of quantification (ULOQ) injection was preceded by one blank injection and followed by two blank injections (Table 2).
Table 2: Observation summary of carryover
| Particulars | Area of BREX | Area of FLX | % Interference |
| Blank 1 | 0 | 0 | 0 |
| ULOQ | 9648992 | 17608790 | NA |
| Blank 2 | 0 | 0 | 0 |
| Blank 3 | 0 | 0 | 0 |
| LLOQ mean area from sensitivity | 279837 | 501977 | NA |
Accuracy and Precision
The accuracy and precision of the analytical method were determined using extracted blank samples, extracted blanks spiked with internal standard (IS), calibration curve standards, and QC samples. Four QC levels were examined in each analytical run: LLOQ, LQC, MQC, and HQC. Accuracy and precision were assessed by processing and analyzing six replicate samples at each QC level. Linearity was determined by plotting the analyte-to-IS peak area ratio against the actual concentrations. The accuracy and precision results are shown in Tables 3, 4, and 5Top of FormBottom of Form.
Table 3: Accuracy of calibration curve
| Standards | Actual Conc. (µg/mL) | Area of BREX | Area of
FLX |
Area of IS | % Accuracy
(BREX) |
% Accuracy
(FLX) |
| Blank | 0 | 0 | 0 | 0 | – | – |
| Blank + IS | 0 | 0 | 0 | 4534119 | – | – |
| STD A | 1.40 | 281369 | 507353 | 4551033 | 107.86 | 107.14 |
| STD B | 8.00 | 1466819 | 2608270 | 4703385 | 101.38 | 97.25 |
| STD C | 20.00 | 3615870 | 6518536 | 4685964 | 101.20 | 98.25 |
| STD D | 28.00 | 4781406 | 9130251 | 4594640 | 97.64 | 100.36 |
| STD E | 42.00 | 7285828 | 13964513 | 4603296 | 99.14 | 102.26 |
| STD F | 56.00 | 9648992 | 17608790 | 4507674 | 100.64 | 98.80 |
Table 4: Summary of accuracy and precision of BREX from quality control samples
|
Level |
Intra-day | Inter-day | ||||
| Recovered Conc.
(µg/mL) |
% Accuracy | % CV | Recovered Conc.
(µg/mL) |
% Accuracy | % CV | |
|
LLOQ |
1.28 | 91.43 | 5.65 | 1.28 | 91.43 | 4.83 |
| 1.39 | 99.29 | 1.31 | 93.57 | |||
| 1.36 | 97.14 | 1.31 | 93.57 | |||
| 1.44 | 102.86 | 1.35 | 96.43 | |||
| 1.27 | 90.71 | 1.28 | 91.43 | |||
| 1.45 | 103.57 | 1.45 | 103.57 | |||
|
LQC |
3.85 | 96.25 | 5.6 | 3.77 | 94.25 | 2.81 |
| 4.06 | 101.50 | 3.83 | 95.75 | |||
| 4.37 | 109.25 | 3.76 | 94.00 | |||
| 3.93 | 98.25 | 3.97 | 99.25 | |||
| 3.74 | 93.50 | 3.90 | 97.50 | |||
| 3.87 | 96.75 | 3.67 | 91.75 | |||
|
MQC |
27.84 | 99.43 | 1.38 | 26.72 | 95.43 | 1.92 |
| 27.44 | 98.00 | 26.76 | 95.57 | |||
| 27.58 | 98.50 | 27.00 | 96.43 | |||
| 28.13 | 100.46 | 26.82 | 95.79 | |||
| 27.37 | 97.75 | 27.67 | 98.82 | |||
| 27.04 | 96.57 | 27.94 | 99.79 | |||
|
HQC |
44.61 | 99.58 | 3.01 | 43.04 | 96.07 | 2.75 |
| 47.01 | 104.93 | 41.90 | 93.53 | |||
| 45.70 | 102.01 | 42.04 | 93.84 | |||
| 42.87 | 95.69 | 44.44 | 99.20 | |||
| 45.03 | 100.51 | 43.76 | 97.68 | |||
| 45.10 | 100.67 | 41.43 | 92.48 | |||
Table 5: Summary of accuracy and precision of FLX from quality control samples
|
Level |
Intra-day | Inter-day | ||||
| Recovered Conc.
(µg/mL) |
% Accuracy |
% CV | Recovered Conc.
(µg/mL) |
% Accuracy |
% CV | |
|
LLOQ |
1.59 | 113.57 | 4.74 | 1.37 | 97.86 | 5.45 |
| 1.50 | 107.14 | 1.32 | 94.29 | |||
| 1.51 | 107.86 | 1.41 | 100.71 | |||
| 1.49 | 106.43 | 1.48 | 105.71 | |||
| 1.40 | 100.00 | 1.29 | 92.14 | |||
| 1.41 | 100.71 | 1.46 | 104.29 | |||
|
LQC |
4.06 | 101.50 | 3.06 | 4.14 | 103.50 | 4.22 |
| 3.96 | 99.00 | 3.73 | 93.25 | |||
| 4.10 | 102.50 | 3.99 | 99.75 | |||
| 4.29 | 107.25 | 3.83 | 95.75 | |||
| 3.95 | 98.75 | 3.77 | 94.25 | |||
| 4.12 | 103.00 | 4.05 | 101.25 | |||
|
MQC |
29.49 | 105.32 | 2.07 | 28.88 | 103.14 | 3.05 |
| 29.65 | 105.89 | 28.04 | 100.14 | |||
| 29.15 | 104.11 | 27.46 | 98.07 | |||
| 28.97 | 103.46 | 28.25 | 100.89 | |||
| 28.28 | 101.00 | 29.76 | 106.29 | |||
| 28.22 | 100.79 | 27.59 | 98.54 | |||
|
HQC |
43.81 | 97.79 | 2.61 | 42.64 | 95.18 | 2.94 |
| 46.79 | 104.44 | 43.25 | 96.54 | |||
| 43.83 | 97.83 | 41.11 | 91.76 | |||
| 43.83 | 97.83 | 42.53 | 94.93 | |||
| 45.07 | 100.60 | 44.94 | 100.31 | |||
| 44.66 | 99.69 | 42.36 | 94.55 | |||
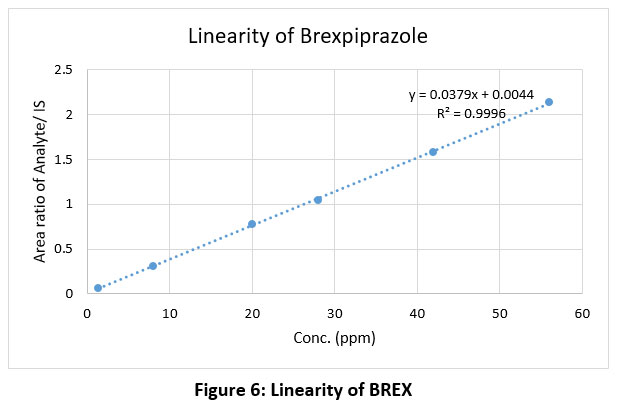 |
Figure 6: Linearity of BREX
|
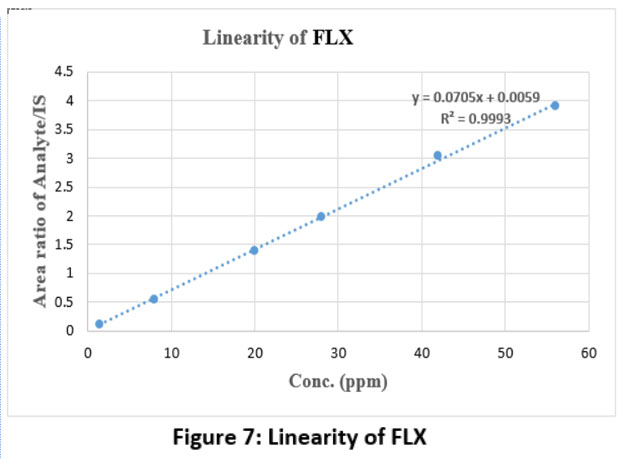 |
Figure 7: Linearity of FLX
|
Recovery
The extraction recovery of BREX, FLX, and IS was evaluated at low, medium, and high QC levels. A recovery vial was prepared by extracting blanks spiked with an analyte post-extraction. For recovery assessment, 952 µL of extracted plasma was added with 16 µL of aqueous LQC/MQC/MQC solution and 32 µL of aqueous internal standard solution and injected (Table 6).
Table 6. Recovery of BREX, FLX, and IS in QC samples
| Sample | BREX Area | FLX Area | IS Area | % Recovery
(BREX) |
% Recovery
(FLX) |
% CV
(BREX) |
% CV
(FLX) |
| LQC 1 | 835214 | 1421177 | 4671829 | 85.26 | 91.74 | 1.82 | 1.38 |
| LQC 2 | 840219 | 1432854 | 4752631 | ||||
| LQC 3 | 867859 | 1459782 | 4805631 | ||||
| Mean | 847764 | 1437938 | 4743364 | ||||
| MQC 1 | 5747275 | 9986527 | 4791791 | 82.57 | 94.05 | ||
| MQC 2 | 5685310 | 9925341 | 4785314 | ||||
| MQC 3 | 5702894 | 9865718 | 4629746 | ||||
| Mean | 5711826 | 9925862 | 4735617 | ||||
| HQC 1 | 9088968 | 15320092 | 4833144 | 85.19 | 93.86 | ||
| HQC 2 | 9153073 | 14024158 | 4798631 | ||||
| HQC 3 | 9134667 | 15859642 | 4682157 | ||||
| Mean | 9125569 | 15067964 | 4771311 |
Stability
The stability of drugs in human plasma was determined at different conditions to confirm the suitability of the analytical technique. For stability studies, three replicates were analyzed at LQC and HQC levels. To evaluate benchtop stability, spiked plasma samples were kept at room temperature for six hours before being processed and analyzed. In freeze-thaw stability, the spiked plasma samples were processed for three freeze-thaw cycles to identify any possible degradation during repeated freezing and thawing. For autosampler stability, spiked plasma samples were reinjected 24 hours after the initial injection time. The stability of processed extracted samples was examined by keeping the processed LQC and HQC samples on the bench for 6 hours prior to injection into the analytical system. In addition, stock solution stability was investigated by storing aqueous LQC and HQC stock solutions for 24 hours, after which fresh LQC and HQC samples were prepared from these stored solutions and analyzed (Table 7).
Table 7: Stability tests for BREX and FLX
| Sample | QC | Bench top stability | Freeze thaw stability | Autosampler Stability | Stability of processed extracted samples | Stock solution stability | |||||
| Accuracy | % CV | Accuracy | % CV | Accuracy | % CV | Accuracy | % CV | Accuracy | % CV | ||
| BREX | LQC 1 | 96.25 | 6.39 | 99.75 | 2.90 | 104.50 | 2.27 | 98.25 | 2.52 | 102.25 | 2.52 |
| LQC 2 | 101.5 | 104.25 | 102.25 | 93.5 | 97.25 | ||||||
| LQC 3 | 109.25 | 98.75 | 107.0 | 96.75 | 100.25 | ||||||
| HQC 1 | 99.58 | 2.62 | 101.74 | 1.52 | 99.29 | 2.37 | 95.69 | 2.86 | 101.81 | 1.04
|
|
| HQC 2 | 104.93 | 101.88 | 103.71 | 100.51 | 102.01 | ||||||
| HQC 3 | 102.01 | 99.15 | 99.89 | 100.67 | 100.09 | ||||||
| FLX | LQC 1 | 101.50 | 1.78 | 96 | 1.29 | 98 | 2.30 | 107.25 | 4.13 | 99 | 2.41 |
| LQC 2 | 99.00 | 98.5 | 100.5 | 98.75 | 94.5 | ||||||
| LQC 3 | 102.50 | 97.5 | 96 | 103 | 95.75 | ||||||
| HQC 1 | 97.79 | 3.83 | 98.55 | 0.69 | 96.14 | 1.54 | 97.83 | 1.42 | 98.53 | 1.79 | |
| HQC 2 | 104.44 | 97.34 | 98.95 | 100.6 | 98.88 | ||||||
| HQC 3 | 97.83 | 97.41 | 98.5 | 99.69 | 95.69 | ||||||
Table 8: Comparison between the proposed method and the previously reported method
| RT (min)
Proposed method |
RT (min)
Reported method |
LLOQ | Detection method | Matrix | Reference | |||
| Proposed method | Reported method | Proposed method | Reported method | Proposed method | Reported method | |||
| BREX – 3.69
FLX- 6.82 |
BREX- 4.538
FLX- 11.527 |
1.40 µg/mL | 5 µg/mL | HPLC-UV | HPLC-UV | Blood Plasma | Pharmaceutical Formulation | 27 |
Discussion
Since there is no reported sensitive bioanalytical method for the simultaneous estimation of BREX and FLX, the validated RP-HPLC method was developed for routine analysis in human plasma. The available methods were developed to assess drugs individually. Therefore, there is a need to develop a bioanalytical method for the estimation of these drugs in combination. The current method aims to develop a simple, accurate, and reliable method for the simultaneous estimation of BREX and FLX in human plasma. The method used protein precipitation with acetonitrile for the extraction of drugs from human plasma. Protein precipitation is cost-effective (using inexpensive organic solvents such as acetonitrile), has less analyte loss during extraction, does not require drying, and allows for the direct injection of the supernatant. The chromatographic conditions have been optimized during method development to achieve excellent separation of BREX and FLX. Short retention times of both drugs result in a high-throughput method suitable for processing many samples.
For method development and optimization, different mobile phase compositions were used. In the first trial, methanol and water (70:30, v/v) were used as the mobile phase, but the shape of the peak was not proper. For the second trial (70:30, v/v), acetonitrile and water were used. Drugs were eluted, but proper peak shape was not observed. The chromatographic peak in the third trial, with methanol and 0.05% orthophosphoric acid in water (70:30, v/v), was broad. For the fourth trial, the mobile phase consisting of acetonitrile and 0.05% orthophosphoric acid in water (50:50, v/v), a Gaussian-shaped peak was not observed. In the fifth trial, acetonitrile and 0.05% orthophosphoric acid in water (35:65, v/v) were tried and showed a well-resolved peak with a satisfactory response, improved symmetry, and an acceptable RT. The optimized chromatographic conditions were used to evaluate Fimasartan as an IS. A mixed solution containing 100 µg/mL of BREX, FLX, and IS was injected. Fimasartan showed acceptable peak symmetry, without interfering with the analyte peaks.
Selectivity was confirmed if interfering substances were less than 5% of the IS signal and less than 20% of the analyte signal at LLOQ. The results met the acceptance criteria, showing no peaks in the blank plasma chromatograms corresponding to BREX and FLX retention times. For sensitivity, the acceptance criteria was achieved, and the % CV was observed as 5.44 and 3.27 for BREX and FLX, respectively. For carryover, the acceptance criterion was met when the peak areas at the retention times of BREX and FLX in the second and third blanks did not exceed 20% of the corresponding LLOQ peak areas. Acceptable carryover was confirmed by the observed responses, which were below this limit.
With a correlation coefficient (r²) of 0.9996 and 0.9993 for BREX and FLX, respectively, the method showed good linearity over the concentration range of 1.40–56 µg/mL. The recovered concentration was used to determine the accuracy of the QC samples. Accuracy requirements for QC samples are ±20% for LLOQ and ±15% for other QC (LQC, MQC, HQC). The % CV for the recovered concentrations from six replicates at each QC level was used to determine precision. The % CV values were within permissible limits.
The extraction mean recovery was 84.34% for BREX, 93.22% for FLX, and 94.69% for IS. The % CV of BREX, FLX, and IS were found to be 1.82, 1.38, and 0.99, respectively. Across all evaluated stability conditions, the calculated accuracy at both LQC and HQC levels remained within 93.5% – 109.25% for BREX and 94.5% – 107.25% for FLX and the percent coefficient of variation (%CV) was observed from 1.04 to 6.39 for BREX and 0.69 to 4.13 for FLX. These results confirm the adequate stability of BREX and FLX throughout the assay.
Conclusion
A sensitive and easy reverse phase-high performance liquid chromatographic method was developed for the simultaneous estimation of BREX and FLX in human plasma. For the first time, a novel bioanalytical method has been successfully developed by RP-HPLC for evaluating BREX and FLX simultaneously. The developed method comprises a simple sample pretreatment, cost-effectiveness, protein precipitation without drying or reconstitution, and shorter retention times of both analytes, compared to reported methods for individual estimation of these drugs, enabling rapid analysis. The LLOQ of the method was 1.40 µg/mL, confirming the sensitivity of the method, but it is not suitable for therapeutic drug monitoring or bioequivalence studies. Bioanalytical method validation was performed according to USFDA and EMEA guidelines, and all validation parameters were within acceptable limits. BREX and FLX remained stable at different conditions, including bench-top, freeze-thaw, autosampler, stability of processed extracted samples, and stock solution stability. Hence, the developed method was adequate for the simultaneous quantification of BREX and FLX in human plasma.
Acknowledgement
The authors are thankful to SMBT College of Pharmacy, Nashik, and Savitribai Phule Pune University, Pune.
Funding Sources
The author(s) received no financial support for the research, authorship, and/or publication of this article.
Conflict of interest
The authors do not have any conflict of interest.
Data Availability Statement
This statement does not apply to this article.
Ethics Statement
This research did not involve human participants, animal subjects, or any material that requires ethical approval.
Informed Consent Statement
This study did not involve human participants, and therefore, informed consent was not required.
Clinical Trial Registration
This research does not involve any clinical trials.
Permission to reproduce material from other sources
Not Applicable
Authors Contributions
Manoj Ramesh Kumbhare: Preparation of the manuscript draft, writing and editing; Pravin Rangnath Dighe: Data collection and analysis, writing and editing.
References
- Liu Z., Kuai M. The global burden of depression in adolescents and young adults, 1990–2021: systematic analysis of the global burden of disease study. BMC Psychiatry. 2025;25(1):767.
CrossRef - Lee Y. B., Cho Y. J., Kim J. K. The unique role of fluoxetine in alleviating depression and anxiety by regulating gut microbiota and vagus nerve–mediated serotonin and melanocortin-4 receptors. Biomed Pharmacother. 2025;182:117748.
CrossRef - Reddy R. R. J., Kolli S. K., Salakolusu S., Kallam S. D. M., Raghupathi J. K., Katari N. K. Characterization and analytical method validation for potential impurities of fluoxetine hydrochloride. Biomed Chromatogr. 2025;39(2):e6069.
CrossRef - Feng Y., Qu X., Hao H. Effects of selective serotonin reuptake inhibitors on the reproductive system. Front Pharmacol. 2025;16:1567863.
CrossRef - Edinoff A. N., Akuly H. A., Hanna T. A., et al. Selective serotonin reuptake inhibitors and adverse effects: a narrative review. Neurol Int. 2021;13(3):387-401.
CrossRef - Scott F., Hampsey E., Gnanapragasam S., et al. Augmentation and combination treatments for early-stage treatment-resistant depression: a systematic review and meta-analysis. J Psychopharmacol. 2023;37(3):268-78.
CrossRef - Nunez N. A., Joseph B., Pahwa M., et al. Augmentation strategies for treatment-resistant major depression: a systematic review and network meta-analysis. J Affect Disord. 2022;302:385-400.
CrossRef - Kapadia S., Zhang Z., Ardic F., et al. Adjunctive brexpiprazole for major depressive disorder with partial or minimal antidepressant response. Int J Neuropsychopharmacol. 2025;28(10):pyaf074.
CrossRef - Nadella P. N., Ratnakaram V. N., Navuluri S. QbD-based UPLC method for quantification of brexpiprazole in the presence of impurities. J Chromatogr Sci. 2021;59(3):223-40.
CrossRef - Edinoff A. N., Wu N. W., Maxey B. S., et al. Brexpiprazole for schizophrenia and major depressive disorder. Psychopharmacol Bull. 2021;51(2):69-95.
CrossRef - Sasabe H., Koga T., Furukawa M., et al. In vitro evaluation of pharmacokinetic drug–drug interactions of brexpiprazole. 2021;51(5):522-35.
CrossRef - Kishi T., Sakuma K., Nomura I., et al. Brexpiprazole as adjunctive treatment for major depressive disorder: a systematic review and meta-analysis. Int J Neuropsychopharmacol. 2019;22(11):698-709.
CrossRef - Deodhar M., Rihani S. B. A., Darakjian L., Turgeon J., Michaud V. Mechanism of fluoxetine-mediated CYP2D6 inhibition. 2021;13(2):148.
CrossRef - Elmokadem A., Bruno C. D., Housand C., et al. Brexpiprazole pharmacokinetics in CYP2D6 poor metabolizers. J Clin Pharmacol. 2022;62(1):66-75.
CrossRef - Zou Q., Yan R., Liu W., Wei P. A validated quantification of brexpiprazole in dog plasma. J Chromatogr Sci. 2018;56(8):702-8.
CrossRef - Jagdale A. S., Pendbhaje N. S., Nirmal R. V., Bachhav P. M., Sumbre D. B. RP-HPLC estimation of brexpiprazole using quality by design. Future J Pharm Sci. 2021;7:142.
CrossRef - Nehal P. B., Ashok B. P., Mohana Rao S., et al. Stability-indicating RP-HPLC method for brexpiprazole bulk drug. J Chem Pharm Res. 2018;10:55-66.
- Kumar V. G., Mondal S. Stability-indicating RP-HPLC method for brexpiprazole estimation. J Drug Deliv Ther. 2019;9:214-22.
CrossRef - Bhawar H. S., Thete S., Shinde G. S. Stability-indicating RP-HPLC method for brexpiprazole in bulk and tablets. J Drug Deliv Ther. 2019;9(4):141-5.
CrossRef - Salama F. M., Attia K. A., Said R. A., El-Olemy A., Raoof A. RP-HPLC determination of brexpiprazole with oxidative degradation product. Asian J Pharm Health Sci. 2018;8:1886-93.
- Pulusu V. S., Routhu K. C., Chikkaswamy S. S. B. Quantitative RP-HPLC determination of brexpiprazole. Pharm Anal Acta. 2019;10:610.
CrossRef - Thakkar A. M., Chhalotiya U. K., Parekh N., Desai J. V., Shah D. A. Stability-indicating TLC method for brexpiprazole and content uniformity. J Chromatogr Sci. 2019;57(7):644-52.
CrossRef - Mondal S., Kumar V. G., Mondal P. Spectrophotometric estimation of brexpiprazole in tablet dosage form. Int J Pharm Sci Res. 2019;10:2451-5.
- Felemban R. A., Abduljabbar M. H., Alnemari R. M., et al. Spectrofluorimetric determination of brexpiprazole using erythrosine B quenching. Anal Methods. 2025;17(21):4334-43.
CrossRef - Derayea S. M., Zaafan A. A., Nagi D. A., Oraby M. Spectrofluorimetric assay of brexpiprazole based on photoinduced electron transfer inhibition. Spectrochim Acta A Mol Biomol Spectrosc. 2023;301:122948.
CrossRef - Al-Farhan B. S., Hamad A. A. Sustainable on–off fluorescence technique for brexpiprazole determination. J Fluoresc.
- Kabil N. A., Khalil H. M., El Ghwas H. E., et al. Eco-conscious chromatographic determination of an antidepressant free-dose combination. Anal Methods. 2025;17(21):4379-86.
CrossRef - Ghanem H. N., El-Zaher A. A., Mahmoud S. T., Taha E. A. Spectrophotometric determination of olanzapine and fluoxetine using chemometric methods. BMC Chem. 2024;18(1):201.
CrossRef - Ali E. A., Adawy A. M., El-Shahat M. F., Amin A. S. Spectrophotometric determination of fluoxetine and clomipramine. Egypt J Forensic Sci. 2016;6:370-80.
CrossRef - Constantinescu I. C., Florea M., Neagu A. F. Spectrophotometric determination of fluoxetine hydrochloride. 2015;63(6):816-20.
- Bioanalytical method validation guidance for industry. (2018). S. Department of health and human services food and drug administration, Center for drug evaluation and research (CDER), Center for veterinary medicine (CVM).
- Guideline on bioanalytical method validation. (2015). European medicines agency.
Accepted on: 20-02-2026
Second Review by: Dr. Nubila Nkoyo Imelda
Final Approval by: Dr. Eugene A. Silow


![]()
![]()
