
Analytical Quality by Design-driven Reversed Phase –high Performance Liquid Chromatography Method and Risk Mitigation for Fimasartan
 , Ramanlal Kachave2and Machindra Chavan3
 1Department of Pharmaceutical Chemistry, Amrutvahini College of Pharmacy, affiliated to Savitribai Phule Pune University, Maharashtra, India
2Department of Pharmaceutical Chemistry, GES’s Sir Dr. M. S. Gosavi College of Pharmaceutical Education and Research, affiliated to Savitribai Phule Pune University, Maharashtra, India
3Department of Pharmacognosy, Amrutvahini College of Pharmacy, affiliated to Savitribai Phule Pune University, Maharashtra, India
Corresponding author Email Id: kajal29191@gmail.com
DOI : http://dx.doi.org/10.13005/bbra/3491
Download this article as:
![]()
The study covers the Analytical Quality by Design driven method for the determining Fimasartan, an antihypertensive drug. Critical Quality Attributes, namely, retention time, peak area and theoretical plates, were identified and assessed for method performance. An Ishikawa diagram along with Failure Mode Effects Analysis were employed to analyze risk and identify variables having a significant impact on method performance as well as reliability. Critical Method Variables, namely, mobile phase composition, flow rate, and detection wavelength, were systematically optimized. The chromatographic conditions after optimization were methanol proportion in mobile phase: 79.59%v/v, flow rate of 0.8 mL min-1 and detection wavelength 264 nm. These conditions resulted in a response time of 5.5 min., with adequate system suitability, comprising adequate theoretical plates and peak symmetry. Validation of optimized method was accomplished using the ICH Q2 (R1) guidelines with consideration of recent revisions in Q2(R2)., displaying high linearity, accuracy, precision, and robustness. Precision data revealed that %RSD values that were well within acceptable ranges, indicating reproducibility of the method. Integration of Analytical Quality by Design allowed for a comprehensive understanding of method variability and control techniques. Such techniques can be utilized for chromatographic estimation of other drugs.
KEYWORDS:AQbD; Box Behnken Design; Critical Method Variables; Fimasartan; Risk Assessment
Introduction
Angiotensin II receptor blockers (ARBs) often referred to as sartans have been widely used for treatment of hypertension. 1,2 While, Losartan is the first drug of this class. Fimasartan (FM) is the ninth and latest drug of this class. It is a pyrimidin-4(3H)-one derivative of losartan giving it greater potency and a longer half-life as compared to losartan. With non-competitive, irreversible binding to the angiotensin 1 (AT1) receptor, FM exhibits a selective antagonistic effect on the AT1 receptor. FM stands out from other sartan derivatives due to its unique scaffolds, which comprise pyrimidinone rings and thioamide as main structural modifications.3 Its elimination half life is 7 to 10 hrs. Its main route of elimination is via bile, while less than 3% is eliminated via urine.4 FM is commercially available in potassium salt as well as trihydrate forms, that have very slight water solubility.5
Previous literature suggests few methods for estimation of FM, however there is no systematic approach to method development.6–9
One-Factor-at-a-Time (OFAT) optimization is a popular approach in HPLC method development. It involves meticulously changing a single factor at given time. It evaluates how the particular factor influences the desired outcome such as peak area, retention time, asymmetry factor, etc. The approach assists in determining the best parameters to attain the required chromatographic performance. However this approach primarily calls for a significant number of experimental trials and is often time consuming and tedious.10,11
To address the constraints of the old OFAT approach, the Quality by Design (QbD) framework has evolved as an advanced scientific and disciplined strategy for method and product development in the pharmaceutical sector.12
The use of QbD principles to analytical techniques is gaining popularity due to its effectiveness in improving the robustness and performance of techniques such as chromatography. Analytical Quality by Design (AQbD) has been recommended for systematic analytical procedure development in the ICH Q14 guidelines.13 AQbD identifies the analytical target profile (ATP), critical attributes of the method, and major factors which influence the method’s performance. AQbD is an organized pathway for method optimization, understanding method variability along with maintaining consistency through risk analysis and design controls.14–16 As a part of AQbD, Design of Experiments (DoE) is used to systematically scrutinize the effects and interactions of different method parameters.17
It measures the interactions between multiple factors. DoE helps to procure good amount of information while reducing the number of runs required by systematically altering different parameters. It increases the method’s reliability for routine analysis.18,19 Response Surface Methodology (RSM) designs like the central composite design (CCD) and the Box-Behnken design (BBD) can be employed for optimization.20 The BBD represents a second-order design and can investigate factors at three levels. BBD is especially effective when there are more than three components to optimize and study the interaction between those factors. In numerous investigations, BBD is utilized in the optimization of analytical methods.21
The objective of current study is to develop a precise, robust AQbD-based RP-HPLC technique for the quantification of FM, assuring improved method performance and regulatory compliance through comprehensive risk assessment and design space investigation.
Materials and Methods
Chemicals and reagents
HPLC grade methanol and o-phosphoric acid were procured from Merck, Mumbai, India. HPLC grade water was acquired from qualigens. Prior to use, it was filtered through 0.45 micron membrane filters followed by sonication for de-gassing purpose. API Fimasartan (potassium trihydrate) was kindly gifted by Ajanta Pharma Limited, Aurangabad. Fimasartan (potassium trihydrate) tablets 60 mg manufactured by Ajanta Pharma (Aurangabad, India) was purchased from the local vendor.
Instrumentation Set up and chromatographic parameters
The HPLC binary gradient system (Shimadzu Analytical, India) with a LC-20AD UFLC and a SPD-20 A detector. The software employed was LC solution (Version 1.21 SP1). Partitioning was performed employing Cosmosil C 18 column having dimensions (250 mm × 4.6 mm, and silica particle size: 5 µ). Mobile phase contained methanol and 10 mM phosphate buffer (pH adjusted to 3 using o-phosphoric acid) in isocratic mode. Flow rate being 0.8 mL min-1 while injection volume being 20 μL. All the samples were filtered with a membrane filter (0.45 μ).
Methods
Preparation of stock solutions and calibration standards
10 mg of FM was dissolved in 10 mL of methanol to acquire 1000 μg mL-1. It was subsequently diluted using mobile phase to obtain a concentration of 100 μg mL-1. From the above solution, calibration standards were prepared at 10 μg mL-1, 20 μg mL-1, 30 μg mL-1, 40 μg mL-1 and 50 μg mL-1.
Preparation of sample solution
To prepare the FM sample solution, 20 FM tablets (60 mg strength) were ground finely. An equivalent of 10 mg FM was dissolved in mobile phase to obtain 10 mL solution. The solution was used to evaluate FM in its marketed tablets.
Quality by Design
The analytical method was developed systematically using a QbD. In order to guarantee constant method performance, QbD is a science- and risk-based methodology that places a strong emphasis on method comprehension, identifying crucial method parameters, and creating a design space. In order to determine the key elements influencing method performance, the technique was designed by first defining an Analytical Target Profile (ATP) and then conducting a risk assessment. The impacts of these parameters were then investigated, and ideal chromatographic conditions were established, using DoE.
Analytical Target Profile (ATP) and Critical Quality Attributes (CQAs)
Defining an ATP is a significant initial phase in applying the QbD strategy. The ATP entails describing the specific quality criteria anticipated of an analytical technique, giving a structure to assure the method’s accuracy and precision.22 CQAs are measurable aspects of the chromatographic process that need to be kept under control to ensure the method’s accuracy, precision, and stability.23,24
Risk assessment
In accordance with the AQbD principles, FMEA was carried out in order to determine potential risk variables that could affect the HPLC method’s performance and robustness.25–27 This risk evaluation was done on the basis of prior information, literature, scientific reasoning, and practical experience. The five Ms, namely, Man, Machine, Material, Method, and Mother nature (Environment)—aided as the foundational categories for identifying and analyzing potential risks that can affect the method.28 Based on this, Ishikawa diagram as shown in Figure 1, was created.
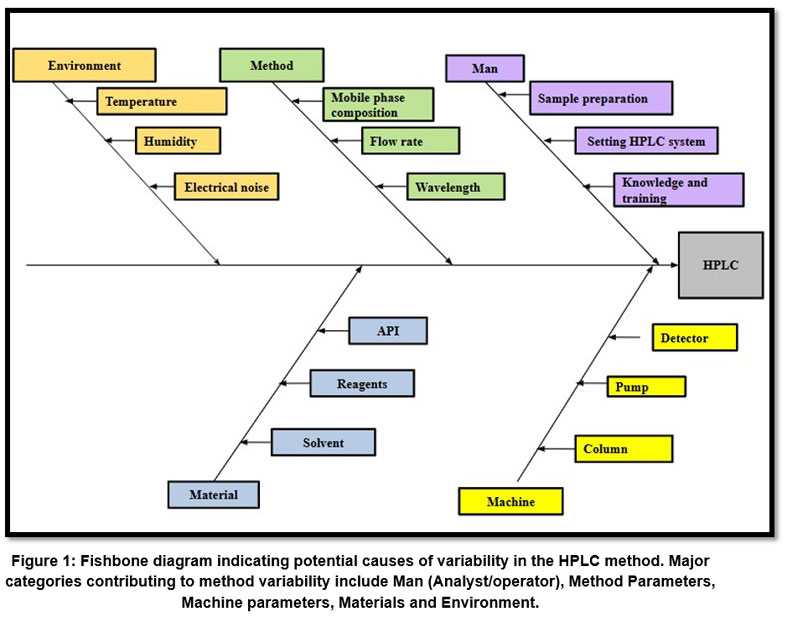 |
Figure 1: Fishbone diagram indicating potential causes of variability in the HPLC method.
|
The failure’s severity, likelihood of occurrence, and detectability were all graded on a scale extending from of 1 to 10, 1 being the minimum and 10, the maximum as indicated in Table 1. This table outlines the various failure modes associated with different variables while developing an HPLC technique for FM employing an AQbD approach. Each variable was evaluated for its severity (S), occurrence (O), and detectability (D), and the related Risk Priority Number (RPN) was computed.
RPN was determined by multiplying the scores given for S, O, D. Greater RPN value indicates a high criticality.29 The attributes were classified as high, moderate or low critical on the basis of RPN score. Higher RPN values imply a need for more control or investigation during the method optimization.30
Mobile phase composition, flow rate, and the wavelength of detection were determined to be high risk parameters as is evident in Table 1 and assigned as critical method variables (CMVs). In order to determine their effects and optimize the chromatographic conditions for enhanced method performance, these screened variables were entered as input factors in the BBD matrix.
Table I: Risk Assessment of different Parameters Using FMEA in AQbD-Based Development of Fimasartan Estimation Method
| Parameter | Step | Failure Mode | Effect | Cause | S | O | D | RPN |
| Man | Sample preparation | Inaccurate weighing and dilution | Inaccurate quantification | Poor weighing and pipetting technique |
7 | 4 | 4 | 112 |
| Setting HPLC system | Incorrect entry of parameters | Incorrect retention time | Human error | 7 | 3 | 4 | 84 | |
| Knowledge and training | Superficial knowledge of HPLC | Errors in procedure | Poor training absence of supervision |
8 | 3 | 4 | 96 | |
| Material | API | Impure API | Incorrect assay additional peaks |
Improper storage conditions storage for longer periods |
7 | 3 | 3 | 63 |
| Reagents and solvents | Poor grade | Additional peaks poor solubilityBaseline noise |
Improper storage conditions storage for longer periods |
6 | 3 | 2 | 36 | |
| Machine | Detector | Lamp failure | Low signal
No peaks |
Poor maintenance uncalibrated detectorLamp burnout |
9 | 2 | 2 | 36 |
| Pump | Air bubbles clogged filter |
Pulsed flow
Flow cut off |
Poor maintenance
Particulate contamination in solvents or mobile phase |
6 | 4 | 5 | 120 | |
| Column | Column degradation | Peak tailing | Poor purging and washing
Overuse |
8 | 3 | 3 | 72 | |
| Method | Mobile phase composition | In correct ratio of solvent
Incorrect pH |
Fluctuations in retention time
Poor resolution Tailing of peak |
Inaccurate measurement
pH meter malfunction Improper mixing/preparation |
8 | 5 | 6 | 240 |
| Flow rate | Unsteady flow rate | Tailing
Altered retention time |
Malfunctioning of pump | 7 | 5 | 5 | 175 | |
| Wavelength | Inaccurate wavelength | Poor peak detection and sensitivity
No peaks |
Technician error | 7 | 4 | 5 | 140 | |
| Environment | Temperature | Irregular lab temperature | Decomposition of solvents and drug
Altered retention time |
Inadequate air conditioning | 6 | 1 | 4 | 24 |
| Humidity | Excessive humidity | Peak broadening
Stationary phase hydrolysis |
Weather changes | 6 | 1 | 4 | 24 | |
| electrical noise | Electromagnetic interference | Base line noise signal instability |
Nearby equipment
Earthing issue |
3 | 2 | 5 | 30 |
Mitigation plan
A mitigation plan was developed to mitigate the high and moderate risk factors influencing performance of the method. The CMVs were addressed by specific controls, such as pH checking before every run, routine HPLC pump calibration, and method-defined wavelength locking as indicated in Table 2. This table summarizes the control strategies used for each detected CMV after the original FMEA. Mitigation measures were implemented based on the initial risk assessment to decrease the S, O and D of potential failure modes. Post-mitigation Risk RPNs are given to illustrate the effectiveness of the controls used in managing method robustness and promising method performance consistency.31
In addition to control strategy, DoE was used to systematically assess their influence as well as their interactions on method performance.
Table 2: Control Strategy and Post-Mitigation Risk Assessment of Critical Method Variables (CMVs) in the Estimation of Fimasartan
| Critical Method Variable |
RPN | S
post mitigation |
O
post mitigation |
D
post mitigation |
Control strategy | RPN post mitigation |
| Mobile phase composition | 240 | 8 | 3 | 6 | Deciding proper concentration and pH, Using freshly prepared buffer, Proper mixing, pH verification before analysis |
144 |
| Flow rate | 175 | 7 | 3 | 4 | Maintenance of pump, regular calibration of pump, flow rate validation. | 84 |
| Wavelength | 140 | 7 | 2 | 2 | Proper selection of wavelength System suitability check Training of technician |
28 |
Optimization of method by Box Behnken Design
BBD was implemented to forecast the implications of key technique parameters on analytical performance. BBD is a three-level response surface methodology that easily models second-order interactions avoiding the need for a full factorial design. The BBD comprised of 17 experimental runs, encompassing five center points to assess consistency and predict error. All three of the above mentioned dependent variables that had the most significant effect were studied at three levels, namely; high (+1), intermediate (0), and low (−1), respectively. The experimental feasibility and anticipated effect on chromatographic responses were considered while selecting the values. In this regard, percentage of mobile phase was varied at 70%, 80 % and 90%, flow rate was evaluated at 0.8 mL min-1, 0.9 mL min-1 as well as 1 mL min-1, while wavelength of detection was assessed at 260 nm, 262 nm and 264 nm. To methodically evaluate the separate and combined effects of CMVs on responses these levels were entered into the BBD matrix. Design expert® software (Version 13, Stat-Ease Inc., Minneapolis, MN, USA) was used for the same. The software was obtained from the official website of Stat-Ease Inc. It is a popular statistical program for RSM, optimization and DoE. Regression models, response surface and contour plots for method optimisation, the experimental design, and the effects of crucial method parameters were all created using the software. The optimization aimed to achieve a low retention time (R1) and asymmetry factor (R4) and a maximum peak area (R2) and number of theoretical plates (R3). Desirability function was used for optimizing the responses within the desired bounds. Response surfaces as well as contour plots were created to help explain the interactions between the variables to establish the best method conditions.32,33
Method validation
Specificity
The specificity was assessed by using the standard solution and the sample solution made from the commercial tablet formulation.13, 34 Standard and sample solutions were made as cited in the sample preparation section and injected in duplicate to verify for any additional responses at the analyte retention time.
Linearity
In order to evaluate linearity, standard drug solutions were made at concentrations ranging from 10 μg mL-1 to 50 μg mL-1. Calibration plot was prepared by plotting the area of corresponding peaks versus concentration. Linear regression analysis was applied to analyze the correlation between the analyte concentration and detector response by calculating slope, intercept, and coefficient of determination (R²).35
Accuracy
To assess the devised HPLC method’s accuracy, recovery studies using the standard addition method were conducted. Known quantities of the API were spiked into formulation samples at three concentration levels, 50%, 100% and 150% of the desired concentration. Accuracy was established by calculating the percent recovery of the spiked drug.36
Precision
Precision of the method was evaluated in accordance with ICH Q2(R1) guidelines at two levels: repeatability (intra-day precision) and intermediate precision (inter-day precision). Intra-day precision was measured by preparing and testing two separate sample preparations of similar concentration on the same day. Each preparation was injected in triplicate under the same chromatographic conditions. Inter-day precision was executed by repeating the procedure on two different days. Freshly prepared sample solutions were evaluated with the same instrument and procedure parameters. The %RSD values of peak areas recorded from both intra-day and inter-day experiments were determined to determine the method’s precision under standard laboratory circumstances.13
Sensitivity
The method’s sensitivity was determined by computing the limit of detection (LOD) and limit of quantification (LOQ). The LOQ represents the smallest amount of an analyte which can be measured with precision and accuracy, while the LOD being the minimum concentration which can be sensed, but not measured. These values are essential to determine the method’s ability to find and measure traces of analyte, ensuring its applicability for regular analysis as well as quality control37. As per the ICH Q2 guidelines13, LOD and LOQ were found using the standard deviation of the response (σ) and the slope of the calibration plot (S), using the mathematical equations 1 and 2:
LOD = 3.3 × (σ / S) ………..Equ. 1
LOQ = 10 × (σ / S) ………..Equ. 2
Using the y-intercepts of calibration plot, the standard deviation (σ) was computed. The mean of the linear regression equations was used to get the slope (S).
System Suitability
System suitability testing ensures that system functions consistently and produces reliable results. It is an essential part of validating chromatographic techniques 38. To test the suitability of the system, critical variables such as the asymmetry factor, theoretical plates, peak area, and retention duration were evaluated by injecting consecutive 6 injections of sample (30 μg mL-1). These parameters show the effectiveness, precision, and accuracy of the method, so were selected. The RSD should be less than 1% to verify precision, the tailing factor must be less than 2 to guarantee peak symmetry, and the theoretical plates should be more than 2000 to show column efficiency.
Robustness
In order to test the developed HPLC method’s robustness under typical analytical settings, two key parameters – wavelength and pH of the mobile phase were deliberately altered.39 In order to compensate for potential fluctuations that may arise during normal analysis, these modifications were made within a modest, acceptable range: ±0.2 units for pH and ±2 nm for wavelength. The impact of these changes on system suitability parameters were tracked.
Application to marketed formulation
The method was applied for estimating the drug in pharmaceutical dosage form (Fimasartan potassium trihydrate tablets). The sample analysis was done after extraction of the drug from the tablet as mentioned in the sample preparation section. The sample was analyzed in duplicate.40
Results
Analytical Target Profile (ATP) and Critical Quality Attributes (CQAs)
ATP required that the method should ensure accurate and exact measurement of the target analyte, maintain appropriate peak shape and consistency, achieve consistent analyte retention within the intended retention time of around 5.5 minutes and confirm that the method produces results in proportion to concentration.
The ATP served as the framework for defining and assessing CQAs, which were chosen based on regulatory requirements and method performance objectives.
The key CQAs identified and observed during method development included:
Retention Time (min): Target within 5.0–6.0 min for quick analysis.
Peak Area: Target minimum to ensure appropriate sensitivity, exact quantification, and consistent analyte detection over the baseline noise.
Theoretical plates: Target maximum to ensure optimal column efficiency
Asymmetry Factor: Target minimum for peak symmetry and reproducibility.
Risk assessment
By mapping the potential factors, the fishbone diagram served as a basis for FMEA and Design of Experiments (DoE) as well as assisted in distinguishing critical method variables (CMVs). As evident from the Table I, composition of mobile phase, flow rate as well as detection wavelength were identified as CMVs and used for further evaluation in BBD. It was determined that these parameters significantly affected key chromatographic responses such peak symmetry, resolution, and retention time and theoretical plates.
On the basis of risk assessment performed through FMEA, a control strategy as depicted in table 2 was put together to mitigate the high- and moderate-risk factors affecting method performance. The implementation of these controls helped to lower the projected RPNs after mitigation. This stage allowed for a structured QbD-driven development approach by ensuring a thorough awareness of the method’s risk environment.
Mitigation plan outcomes
The mitigation measures which were developed on the basis of risk assessment, improved the method’s robustness and dependability significantly. BBD results revealed that flow rate, organic phase composition, and column temperature had a considerable effect on CQAs. A design space was developed using response surface plots and desirability criteria. All experimental runs in the design space satisfied predetermined acceptance specifications, indicating mitigation strategy was effective. Furthermore, confirmatory experiments at the design space borders demonstrated method robustness, while the control strategy adopted reduced variability and provided constant system appropriateness.
Optimization
BBD was implemented to optimize the chromatographic method. The BBD matrix generated an overall of 17 experimental runs as shown in Table 3, including center points to evaluate model reproducibility. The experimental results were analyzed using multiple regressions to fit quadratic models. High R² values, non-significant lack-of-fit, and ANOVA statistics validated the models’ appropriateness.
Table 3: Experimental runs and results for the Box–Behnken design
| Factor 1 | Factor 2 | Factor 3 | Response 1 | Response 2 | Response 3 | Response 4 | |
| Run | A:Composition (%) | B:Flowrate (mL min-1) | C:Wavelength
( nm) |
Retention Time (min) | Area
(AU) |
Theoretical plates (Units) | Asymmetry Factor (Units) |
| 1 | 90 | 0.9 | 264 | 4.211 | 2881280 | 8890.98 | 1.198 |
| 2 | 70 | 0.8 | 262 | 8.692 | 3398130 | 9894.31 | 1.15 |
| 3 | 80 | 0.8 | 260 | 5.282 | 3380080 | 8480.69 | 1.268 |
| 4 | 80 | 0.9 | 262 | 4.736 | 2988760 | 7828.91 | 1.231 |
| 5 | 80 | 0.8 | 264 | 5.379 | 3350520 | 8710.82 | 1.232 |
| 6 | 80 | 0.9 | 262 | 4.736 | 2988760 | 7828.91 | 1.231 |
| 7 | 80 | 0.9 | 262 | 4.736 | 2988760 | 7828.91 | 1.231 |
| 8 | 80 | 0.9 | 262 | 4.736 | 2988760 | 7828.91 | 1.231 |
| 9 | 70 | 0.9 | 260 | 7.855 | 3033650 | 9137.05 | 1.147 |
| 10 | 70 | 1 | 262 | 7.16 | 2741130 | 8575.1 | 1.143 |
| 11 | 80 | 1 | 260 | 4.286 | 2699030 | 7275.01 | 1.231 |
| 12 | 70 | 0.9 | 264 | 7.887 | 3034430 | 9255.35 | 1.143 |
| 13 | 90 | 1 | 262 | 3.824 | 2603290 | 8204.68 | 1.213 |
| 14 | 80 | 0.9 | 262 | 4.736 | 2988760 | 7828.91 | 1.231 |
| 15 | 80 | 1 | 264 | 4.3 | 2719140 | 7300.1 | 1.245 |
| 16 | 90 | 0.8 | 262 | 4.76 | 3243080 | 9567.92 | 1.182 |
| 17 | 90 | 0.9 | 260 | 4.218 | 2887080 | 8901.97 | 1.197 |
Statistical Analysis of Data
The empirical information collected from the Box-Behnken Design (BBD) was put to statistical analysis employing Design-Expert software. A second-order polynomial model was applied to examine the effect of independent variables i.e. percentage of methanol in mobile phase (X₁), flow rate (X₂), and detection wavelength (X₃)—on the CQAs i.e. response variables, including retention time, peak area, number of theoretical plates, and asymmetry factor. For all the responses retention time (R1), peak area (R2), number of theoretical plates (R3) and asymmetry factor (R4), model F value was found to be 1385.79, 18156.98, 1675.86 and 57.66 respectively. The adjusted R2 value assesses the model’s goodness of fit. Higher numbers indicate a stronger correlation between expected and real values. Table 4 displays the statistically analyzed data and model fit for R1, R2, R3 and R4.
The proposed equations for response R1, R2, R3 and R4 using coded factors is as follows:
R1=4.736−1.8226A−0.5679B+0.017C+0.149AB−0.00975AC−0.02075BC+1.302A2+0.071
B2+0.00475C2 ……..Equ. 3
R2=2988760.8−74077.5A−326151.5B−1809C+4302AB−1647.5AC+12419.5BC−35219.4A2+42865.1
B2+5568.6C2 ……..Equ. 4
R3=7828.9098−162.0304A−662.3579B+45.3175C−11.007AB−32.3233AC−51.2588BC+1168.1371A2+63.4556
B2+49.2899C2……..Equ. 5
R4=1.231+0.02588A+0B−0.00313C+0.0095AB+0.00125AC+0.0125BC−0.06588A2+0.00688
B2+0.00613C2……..Equ. 6
Where A, B and C are the critical variables.
Table 4: Analysis of Variance for Box Behnken design
| Response model | Factor | Factor coefficient | P value | R2 | Adjusted R2 | Model F-value |
| R1: Retention Time (min) | Intercept | 4.736 | 0.9910 | 0.9987 | 1385.789
|
|
| A – Methanol proportion | -1.82263 | < 0.0001 | ||||
| B – Flow rate | -0.56788 | < 0.0001 | ||||
| C – Detection wavelength | 0.017 | 0.4036 | ||||
| AB | 0.149 | 0.0009 | ||||
| AC | -0.00975 | 0.729122 | ||||
| BC | -0.02075 | 0.4681 | ||||
| A2 | 1.302 | < 0.0001 | ||||
| B2 | 0.071 | 0.0309 | ||||
| C2 | 0.00475 | 0.8621 | ||||
| R2: Area | Intercept | 2988761 | 0.9999 | 0.9999 | 18156.980 | |
| A – Methanol proportion | -74077.5 | < 0.0001 | ||||
| B – Flow rate | -326152 | < 0.0001 | ||||
| C – Detection wavelength | -1809 | 0.0666 | ||||
| AB | 4302 | 0.0082 | ||||
| AC | -1647.5 | 0.2049 | ||||
| BC | 12419.5 | < 0.0001 | ||||
| A2 | -35219.4 | < 0.0001 | ||||
| B2 | 42865.1 | < 0.0001 | ||||
| C2 | 5568.6 | 0.0019
|
||||
| R3: Theoretical plates | Intercept | 7828.91 | 0.9995 | 0.9989 | 1675.859 | |
| A – Methanol proportion | -162.03 | < 0.0001 | ||||
| B – Flow rate | -662.358 | < 0.0001 | ||||
| C – Detection wavelength | 45.3175 | 0.0014 | ||||
| AB | -11.007 | 0.4123 | ||||
| AC | -32.3233 | 0.0375 | ||||
| BC | -51.2588 | 0.0048 | ||||
| A2 | 1168.137 | < 0.0001 | ||||
| B2 | 63.4556 | 0.0013 | ||||
| C2 | 49.28985 | 0.0052 | ||||
| R4: Asymmetry Factor | Intercept | 1.231 | 0.9866
|
0.9696
|
57.665
|
|
| A – Methanol proportion | 0.025875 | < 0.0001 | ||||
| B – Flow rate | 0 | 1 | ||||
| C – Detection wavelength | -0.00313 | 0.2416 | ||||
| AB | 0.0095 | 0.0285 | ||||
| AC | 0.00125 | 0.7282 | ||||
| BC | 0.0125 | 0.0085 | ||||
| A2 | -0.06588 | < 0.0001 | ||||
| B2 | 0.006875 | 0.0805 | ||||
| C2 | 0.006125 | 0.1118
|
Response surface plots
The response surface plots showed clear interaction between CMVs as well as their relationship with the responses. Figure 2A depicts the 3D-response surface plot for R1 (Retention time). Factor A and B, i.e. methanol % in mobile phase and flow rate, have a negative influence on retention time individually, but their interaction has a slightly positive impact on retention time when flow rate (factor C) is fixed at an intermediate level. Same is reflected in the quadratic equation 1. Effect of interaction between factor A and B while keeping C constant, on R2 i.e. peak area is shown in Figure 2B. Peak area falls as the methanol proportion in the mobile phase increases along with The response surface plots showed clear interaction between CMVs as well as their relationship with the responses. Figure 2A depicts the 3D-response surface plot for R1 (Retention time). Factor A and B, i.e. methanol % in mobile phase and flow rate, have a negative influence on retention time individually, but their interaction has a slightly positive impact on retention time when flow rate (factor C) is fixed at an intermediate level. Same is reflected in the quadratic equation 1. Effect of interaction between factor A and B while keeping C constant, on R2 i.e. peak area is shown in Figure 2B. Peak area falls as the methanol proportion in the mobile phase increases along with flow rate. However, when both the factors are combined, it has a positive influence on the peak area. The coefficients in quadratic equation 2 also confirm this. Increasing methanol concentration and flow rate, negatively influences the number of theoretical plates, i.e. they decrease when both these factors are increased individually.
Additionally, in combination also these factors have a negative influence on the number of theoretical plates when factor 3 is kept constant as depicted in Figure 2C. Same can be confirmed from equation 3. Figure 2D demonstrates the influence of factor A and B on the R4 i.e. asymmetry factor. There is a positive effect of factor A on asymmetry. Although factor B has no direct impact, the asymmetry increases when flow rate and methanol percentage rise at the same time. Coefficients in equation 4 reflect the same as well.
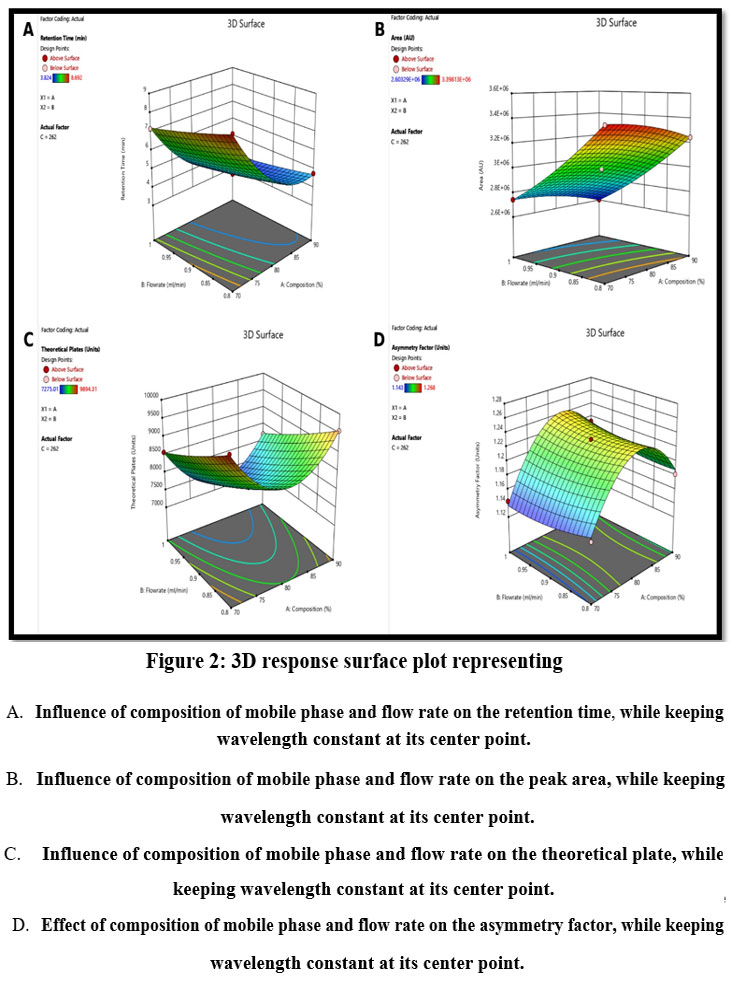 |
Figure 2: 3D response surface plot representing.
|
Confirmation of optimized method and its validity
The goal of the method was to minimize the retention time and asymmetry factor, while maximizing the theoretical plates and peak area. The optimal approach aimed to maximize the theoretical plates and peak area while minimizing the retention time and asymmetry factor. A desirability value of 0.891 was achieved for an optimized method. The optimized conditions for CMVs were: methanol proportion (factor A): 79.59% v/v, flow rate (factor B): 0.8 ml min-1 and detection wavelength: 264 nm (factor C). Responses were retention time (R1): 5.50 min., peak area (R2): 3352309.064, number of theoretical plates (R3): 8709.954 and asymmetry factor 1.228. The overlay plot is depicted in Figure 3. A standard chromatogram at the optimized condition is depicted in Figure 4.
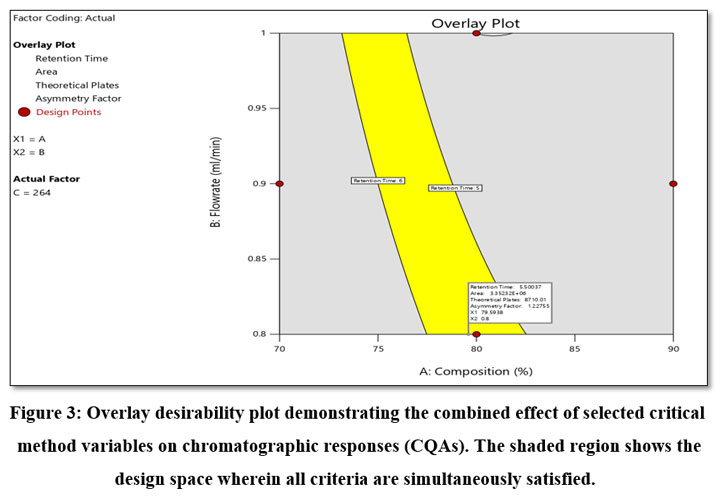 |
Figure 3: Overlay desirability plot demonstrating the combined effect of selected critical method variables on chromatographic responses (CQAs).
|
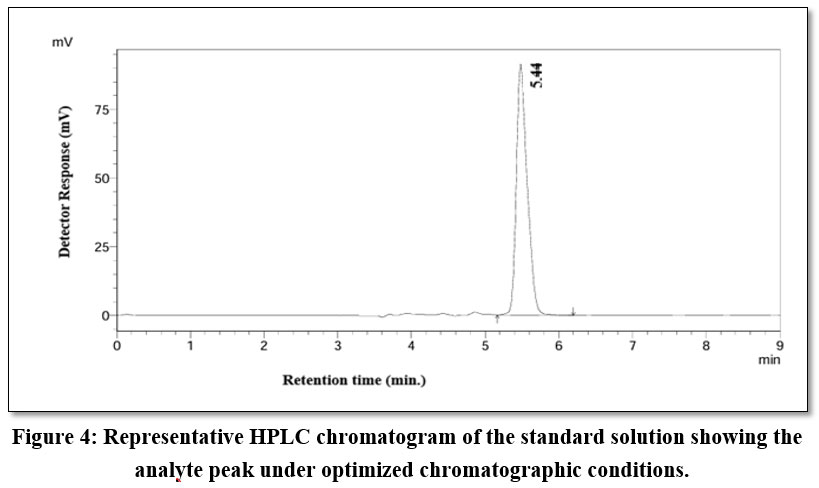 |
Figure 4: Representative HPLC chromatogram of the standard solution showing the analyte peak under optimized chromatographic conditions.
|
The Box-Behnken Design (BBD) model’s predictive capability was evaluated by comparing the experimental values derived from confirmatory runs with the predicted responses (retention time, resolution, and peak area). The formula below was used to get the percentage error:
Percent Error = [(Predicted Value−Experimental Value)/Predicted value] ×100%
On comparing experimental values with predicted values of the Box-Behnken Design model, the percent error for peak area was determined to be about ten percent. This value is regarded as acceptable in the context of method development, where variables like injection variability, detector sensitivity, and possible matrix effects can contribute to response variability, even though it is marginally higher than the usual threshold for quantitative analytical accuracy. With fewer % errors and high predicted R2 values, the model demonstrated great predictive performance for retention time, theoretical plates and asymmetry factor. The model’s dependability is supported by a consistent prediction trend across multiple responses as depicted in table 5.
Table 5: Calculation of Percent Error Between Experimental and Predicted Responses Based on Box–Behnken Design (BBD) Model.
| Optimized conditions | Response | Predicted value | Experimental value | Percent error |
| Mobile phase- Methanol: phosphate buffer (79.60: 21.40%v/v),
Flow rate: 0.8mL min-1 Detection wavelength: 264 nm |
Retention Time | 5.50 | 5.44 | 1.09 |
| Area | 3352308.39 | 3756788 | 12.06 | |
| Theoretical plates | 8709.95 | 8801.55 | 1.05 | |
| Asymmetry Factor | 1.22 | 1.19 | 2.46 |
Specificity
The chromatogram of the standard solution showed a well defined peak for the analyte at a retention time of 5.4 minutes. In the formulation sample’s chromatogram, analyte peak was seen at same retention time with no other interfering peaks near this region as shown in Figure 5. This shows that measurement of the analyte was not hindered by usual excipients in the formulation.
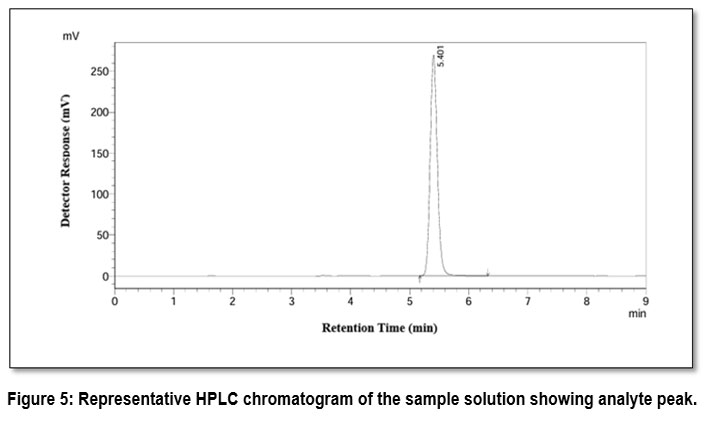 |
Figure 5: Representative HPLC chromatogram of the sample solution showing analyte peak.
|
Validation
Linearity
Employing standard drug solutions having concentrations that ranged from 10 μg mL-1to 50 μg mL-1, the analytical method’s linearity was evaluated. The regression equation was: y=(7.097×10^4±1.10×10^3)x+(1.76×10^5±3.65×10^4). The coefficient of determination (R²) was 0.999. Linearity overlay chromatogram is shown in Figure 6.
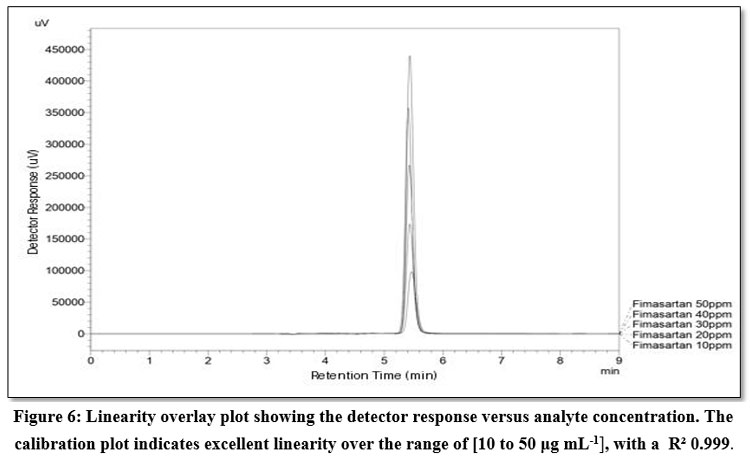 |
Figure 6: Linearity overlay plot showing the detector response versus analyte concentration. The calibration plot indicates excellent linearity over the range of [10 to 50 μg mL-1], with a R² 0.999.
|
Accuracy
The recovery study results showed recoveries in the range of 99.18% to 99.29%. The average recoveries for each level were determined to be within acceptable ranges. Furthermore, the %RSD for all recovery levels was less than 2%, confirming the precision and reliability of the findings. These data validate the method’s reliability for routine evaluation and show that the formulation matrix did not cause any substantial interference during quantification.
Precision
Data for precision is shown in the Table 6. The RSD for intraday precision and interday precision was less than 2%. The % RSD results were in the acceptable range of ICH guideline Q2 (R1), indicating the method is precise.
Table 6: Intra-day and inter-day precision data
| Conc.
μg mL-1 |
Mean Area | SD | %RSD | ||
| Intra Day | Morning | 30 | 2246093 | 16820.86 | 0.75 |
| Afternoon | 2275667
|
3523.74 | 0.27 | ||
| Inter Day | Day 1 | 2246093
|
16820.87 | 0.75
|
|
| Day 2 | 2272016
|
6114.39 | 0.15
|
Sensitivity
LOD and LOQ were determined to be 0.098 and 0.298 μg mL-1, respectively. The results show that the approach is adequately sensitive to identify and quantify low amounts of the analyte with adequate precision and accuracy.
System Suitability
The chromatographic column’s efficiency was demonstrated by the enormous number of theoretical plates seen, which exceeded 2000 and reached over 8500. Higher theoretical plate values correlate with sharper peaks and higher resolution. Furthermore, the tailing factor was around 1.195, indicating high peak symmetry and meeting acceptable requirements. The asymmetry factor, peak area, and theoretical plates were within allowed limits as demonstrated in Table 7. The chromatographic method seemed efficient and well suited for analysis, with a consistent peak area, acceptable tailing factor, and a large theoretical plate count.
Table 7: System Suitability results to Ensure Chromatographic Method Performance (n=6)
| Parameter | Mean | SD | %RSD |
| Peak Area | 2246093 | 16820.87 | 0.75 |
| Retention Time (min) | 5.421 | 0.0095 | 0.17 |
| Tailing Factor | 1.195 | 0.075 | 6.12 |
| HETP (mm) | 0.0283 | 0.0002 | 0.87 |
| Theoretical Plates (N) | 8804 | 76.30 | 0.87 |
Robustness
On altering the pH of mobile phase and detection wavelength, results showed that all system suitability parameters remained within acceptable bounds. This shows that these intentional changes did not have any obvious impact on the method’s performance. This demonstrates the method’s stability and ability to provide reliable results in typical laboratory settings.
Application of the method to marketed formulation
Fimasartan (potassium trihydrate) in a commercially available tablet formulation was successfully estimated employing the developed method. The amount of drug was found to be 99.28 % of the labeled amount.
Discussion
The present research effectively developed and optimized a robust HPLC method for the estimation of Fimasartan using QbD driven DoE approach, specifically the BBD.
Initially, a risk assessment and identification of potential factors affecting method performance were conducted using an Ishikawa diagram. This provided the basis for FMEA, which assisted in ranking high-risk factors and identifying CMVs for subsequent investigation in the DoE study. Systematically evaluation of the CMVs assisted by BBD greatly reduced the number of tests needed and improved the robustness and reliability of the technique. 3 independent variables— mobile phase composition, flow rate, and wavelength of detection, were chosen based on preliminary investigations and their known effects on chromatographic performance. The response surface approach showed that all three parameters considerably influenced retention time and peak area. The mobile phase composition had the highest impact, showing its importance in achieving optimum retention time and peak symmetry. The optimized approach gave a retention time of around 5.5 minutes, which is consistent with the system suitability requirements. Validation was performed employing ICH Q2(R1) guidelines. Method demonstrated linearity across the stated range, with a R² greater than 0.999. Accuracy evaluations showed a recovery rate of 99.18% to 99.29%, confirming the method’s reliability. Precision (%RSD) was within acceptable ranges (<2%). Furthermore, robustness testing demonstrated that the approach is resistant to slight deliberate changes in analytical conditions. Also the method was effectively applied to marketed formulation.
Apart from the chromatographic factors examined, other variables such as column age, instrument performance, and formulation excipients may have an impact on system appropriateness and peak characteristics. However, the results remained within acceptable bounds, demonstrating that the suggested approach is reliable under optimal conditions. To summarize, incorporating AQbD into the HPLC method development for the estimation of FM proved to be an effective strategy which not merely saved time as well as resources, but also yielded an accurate, precise and robust method for routine quality control purposes.
Conclusion
In this study, AQbD approach was effectively used to develop as well as optimize a robust and reliable HPLC technique for the analysis of antihypertensive drug, Fimasartan. CMVs and their impact on method performance were meticulously identified and optimized through the use of risk assessment tools and DoE. The technique demonstrated great specificity, linearity, accuracy, precision, and robustness while meeting all predetermined ATP requirements. In addition to improving method knowledge, our AQbD-based approach built a logical control mechanism that ensured method consistency throughout its lifecycle. The strategy supports regulatory requirements for the development of risk-and science-based methods and is in line with current ICH Q14 and Q2(R2) recommendations. For regular quality control analysis of Fimasartan the established technology is suitable.
Acknowledgement
The authors are thankful to Amrutvahini College of Pharmacy, Sangamner for their support.
Funding Sources
The author(s) received no financial support for the research, authorship, and/or publication of this article.
Conflict of Interest
The authors declare no financial, personal, or professional conflicts of interest that could have influenced the work reported in this paper.
Data Availability Statement
This statement does not apply to this article.
Ethics Statement
This research did not involve human participants, animal subjects, or any material that requires ethical approval.
Statement of Informed Consent
All authors involved in this manuscript have given their consent for its publication.
Clinical Trial Registration
This research does not involve any clinical trials.
Permission to Reproduce Material from other Sources
Not applicable
Author Contributions
Kajal Baviskar: Conceptualization, planning, data collection, data analysis, experimental work, Writing-Original draft, review and editing.
Ramanlal Kachave: Conceptualization, planning, data analysis, project supervision, Draft review.
Machindra Chavan: Conceptualization, supervision, draft review.
References
- Baviskar KP, Kachave RN. Spectroscopic and Chromatographic Estimation of Some Sartans andtheir Combinations with Thiazide Diuretics: A Review. Curr Pharm Anal. 2023;19(8):610-628. doi:10.2174/0115734129255763230927115653
CrossRef - Ladhari A, La Mura G, Di Marino C, Di Fabio G, Zarrelli A. Sartans: What they are for, how they degrade, where they are found and how they transform. Sustain Chem Pharm. 2021;20:100409. doi:10.1016/j.scp.2021.100409
CrossRef - Dangre P, Avhad P, Gurumukhi V, Katolkar U, Chalikwar S. Solidification of deep eutectic solvent containing fimasartan through wet impregnation and exploration of flow attributes by modified SeDeM-SLA expert system. Eur J Pharm Biopharm. 2024;201:114381. doi:10.1016/j.ejpb.2024.114381
CrossRef - PubChem. Fimasartan. Accessed May 6, 2025. https://pubchem.ncbi.nlm.nih.gov/compound/9870652
- Shin DC, Cho JH, Ud Din F, Jin SG, Choi HG. Novel Fimasartan Fluidized Solid Dispersion and Its Tablet: Preparation, Crystallinity, Solubility, Dissolution, and Pharmacokinetics in Beagle Dogs. Eur J Drug Metab Pharmacokinet. 2024;49(6):723-732. doi:10.1007/s13318-024-00919-y
CrossRef - Moon HW, Yousaf AM, Cho KH, Yong CS, Kim JO, Choi HG. Evaluation of stability and simultaneous determination of fimasartan and amlodipine by a HPLC method in combination tablets. asian journal of pharmaceutical sciences. Asian J Pharm Sci 2014;9(3):123-8. doi:10.1016/j.ajps.2014.04.002
CrossRef - Akabari AH, Mistry P, Patel SK, Surati J, Patel SP, Shah U. Simultaneous estimation of fimasartan potassium trihydrate and atorvastatin calcium with greenness assessment using HPLC and UV spectrophotometric methods. Green Anal Chem. 2023;6:1-11. doi: 10.1016/j.greeac.2023.100067
CrossRef - Pandya CP, Rajput SJ. Validated stability indicating RP-HPLC method for the determination of Fimasartan in presence of degradation products. Indo Am J Pharm Res. 2017;7(11):929-946.
- Sojitra RG, Chotaliya UJ. Analytical method development and validation for simultaneous estimation of Fimasartan Potassium Trihydrate and Cilnidipine in synthetic mixture by HPLC for the treatment of hypertension stage-II. Future J Pharm Sci. 2021;7(1):189. doi:10.1186/s43094-021-00336-x
CrossRef - Kotadiya R. Enhancing Pharmaceutical Analysis with Analytical Quality by Design in UHPLC: A Review of Methodological Innovations (2014–2025). Crit Rev Anal Chem. 2025:1-21. doi:10.1080/10408347.2025.2516607
CrossRef - Müller ALH, De Oliveira JA, Prestes OD, Adaime MB, Zanella R. Design of experiments and method development. In: Solid-Phase Extraction. Elsevier; 2020:589-608. doi:10.1016/B978-0-12-816906-3.00022-4
CrossRef - Peraman R, Bhadraya K, Padmanabha Reddy Y. Analytical Quality by Design: A Tool for Regulatory Flexibility and Robust Analytics. Int J Anal Chem. 2015:1-9. doi:10.1155/2015/868727
CrossRef - ICH Official web site : ICH. Accessed May 6, 2025. https://www.ich.org/page/quality-guidelines
- Chiarentin L, Gonçalves C, Augusto C, Miranda M, Cardoso C, Vitorino C. Drilling into “Quality by Design” Approach for Analytical Methods. Crit Rev Anal Chem. 2024;54(8):3478-3519. doi:10.1080/10408347.2023.2253321
CrossRef - Ramalingam P, Jahnavi B. QbD Considerations for Analytical Development. In: Pharmaceutical Quality by Design. Elsevier; 2019:77-108. doi:10.1016/B978-0-12-815799-2.00005-8
CrossRef - Bairagi A, Kothrukar R, Chikhale H, Kosanam S, Borse L. AQbD-novel strategy for analytical methods. Future J Pharm Sci. 2024;10(1):138. doi:10.1186/s43094-024-00706-1
CrossRef - Ameen SA, Pappula N. Analytical QBD approach to redefine the quality of pharmaceuticals: A review. J Pharm Res. 2023;22(4):179.
CrossRef - Ganorkar SB, Shirkhedkar AA. Design of experiments in liquid chromatography (HPLC) analysis of pharmaceuticals: analytics, applications, implications and future prospects. Rev Anal Chem. 2017;36(3). doi:10.1515/revac-2016-0025
CrossRef - MoInar I, Rieger HJ, Kormany R. Modeling of HPLC Methods Using QbD Principles in HPLC. Adv Chromatogr. 2017;53:331-350.
- Szpisják-Gulyás N, Al-Tayawi AN, Horváth ZsH, László Zs, Kertész Sz, Hodúr C. Methods for experimental design, central composite design and the Box–Behnken design, to optimise operational parameters: A review. Acta Aliment. 2023;52(4):521-537. doi:10.1556/066.2023.00235
CrossRef - Sarisaltik Yasin D, Arslantürk Bi̇Ngül A, Karaküçük A, Teksi̇N ZŞ. Development and Validation of an HPLC Method Using an Experimental Design for Analysis of Amlodipine Besylate and Enalapril Maleate in a Fixed-dose Combination. Turk J Pharm Sci. 2021;18(3):306-318. doi:10.4274/tjps.galenos.2020.89725
CrossRef - Borman P, Campa C, Delpierre G, et al. Selection of Analytical Technology and Development of Analytical Procedures Using the Analytical Target Profile. Anal Chem. 2022;94(2):559-570. doi:10.1021/acs.analchem.1c03854
CrossRef - Randive KH, Maste MM, Kempwade AA. Exploration of AQbD Approach for Development of RP-HPLC Method of Nebivolol. Int J Pharm Investig. 2024;14(3):915-927. doi:10.5530/ijpi.14.3.101
CrossRef - Tiwari R, Mahalpure GS, Dahiya M, Kalaiselvan V. Analytical Quality by Design (AQbD) for Quality and Risk Assessment of Pharmaceuticals to Immunomarkers. J Pharm Biopharm Res. 2025;7(1):511-524. doi:10.25082/JPBR.2025.01.001
CrossRef - Guiñón L, Soler A, Gisell Díaz M, et al. Analytical performance assessment and improvement by means of the Failure mode and effect analysis (FMEA). Biochem Medica. 2020;30(2):250-256.. doi:10.11613/BM.2020.020703
CrossRef - Deidda R, Orlandini S, Hubert P, Hubert C. Risk-based approach for method development in pharmaceutical quality control context: A critical review. J Pharm Biomed Anal. 2018;161:110-121. doi:10.1016/j.jpba.2018.07.050
CrossRef - Kelley B, Cromwell M, Jerkins J. Integration of QbD risk assessment tools and overall risk management. Biologicals. 2016;44(5):341-351. doi:10.1016/j.biologicals.2016.06.001
CrossRef - Kumah A, Nwogu CN, Issah AR, et al. Cause-and-Effect (Fishbone) Diagram: A Tool for Generating and Organizing Quality Improvement Ideas. Glob J Qual Saf Healthc. 2024;7(2):85-87. doi:10.36401/JQSH-23-42
CrossRef - Prajapati P, Patel A, Shah S. DoE-Based Analytical Quality Risk Management for Enhanced AQbD Approach to Economical and Eco-Friendly RP-HPLC Method for Synchronous Estimation of Multiple FDC Products of Antihypertensive Drugs. J Chromatogr Sci.2021;60(8):786-799. doi:10.1093/chromsci/bmab123
CrossRef - Kim KO, Zuo MJ. General model for the risk priority number in failure mode and effects analysis. Reliab Eng Syst Saf. 2018;169:321-329. doi:10.1016/j.ress.2017.09.010
CrossRef - Karia P, Ayre A, Khan A. Critical Review of Risk Assessment Tools in Pharmaceutical Quality by Design. Indian J Pharm Educ Res. 2024;58(4s):s1145-s1155. doi:10.5530/ijper.58.4s.113
CrossRef - Venkatachari KM, Ramasamy V. Box -Behnken Design Approach to Method Development for Irinotecan Hydrochloride Trihydrate by Using RP-HPLC Method. Biomed Pharmacol J. 2025;18(1):617-624. doi:10.13005/bpj/3113
CrossRef - Haque SM, Rahman H, Rahman N, et al. Application of Box–Behnken design combined response surface methodology to optimize HPLC and spectrophotometric techniques for quantifying febuxostat in pharmaceutical formulations and spiked wastewater samples. Microchem J. 2023;184:108191. doi:10.1016/j.microc.2022.108191
CrossRef - Validation of Chromatographic Methods of Analysis. In: Profiles of Drug Substances, Excipients and Related Methodology. Vol 32. Elsevier; 2005:243-259. doi:10.1016/S0099-5428(05)32009-0
CrossRef - Araujo P. Key aspects of analytical method validation and linearity evaluation. J Chromatogr B. 2009;877(23):2224-2234. doi:10.1016/j.jchromb.2008.09.030
CrossRef - Alquadeib BT. Development and validation of a new HPLC analytical method for the determination of diclofenac in tablets. Saudi Pharm J. 2019;27(1):66-70. doi:10.1016/j.jsps.2018.07.020
CrossRef - Locatelli M, Melucci D, Carlucci G, Locatelli C. Recent hplc strategies to improve sensitivity and selectivity for the analysis of complex matrices. Instrum Sci Technol. 2012;40(2-3):112-137. doi:10.1080/10739149.2011.651668
CrossRef - Epshtein NA. System Suitability Requirements for Liquid Chromatography Methods: Controlled Parameters and their Recommended Values (Review). Pharm Chem J. 2020;54(5):518-525. doi:10.1007/s11094-020-02231-w
CrossRef - Dejaegher B, Heyden YV. Ruggedness and robustness testing. J Chromatogr A. 2007;1158(1-2):138-157. doi:10.1016/j.chroma.2007.02.086
CrossRef - Sahu PK, Ramisetti NR, Cecchi T, Swain S, Patro CS, Panda J. An overview of experimental designs in HPLC method development and validation. J Pharm Biomed Anal. 2018;147:590-611. doi:10.1016/j.jpba.2017.05.006
CrossRef
AQbD Analytical Quality by Design
AT1 Angiotensin 1
ATP Analytical Target Profile
BBD Box Behnken Design
CCD Central Composite Design
CMV Critical Method Variable
CQA Critical Quality Attributes
D Detectability
DoE Design of Experiments
FM Fimasartan
FMEA Faliure Mode and Effects Analysis
ICH International Conference on Harmonization
LOD Limit of Detection
LOQ Limit of quantification
OFAT One-Factor-at-a-Time
QbD Quality by Design
QTPP Quality Target Product Profile
RPN Risk Priority Number
RP – HPLC Reversed Phase – High Performance Liquid Chromatography
HPLC High Performance Liquid Chromatography
RSM Response Surface Methodology
S Severity
SOP Standard Operating Procedure
Accepted on: 14-02-2026
Second Review by: Dr. Shahin Vahora
Final Approval by: Dr. Wagih Ghannam


![]()
![]()
