
Development and Validation of a Rp-Hplc Method for the Quantification of Favipiravir and its Impurities in Pharmaceutical Dosage Forms
 , Murugan Nithya1, Naga Haritha Pamujlua2, Sareesh Kankanala1and Rajini Kolure3
 1Department of Pharmaceutical Analysis, St. Pauls College of Pharmacy, Turkayamjal, Hyderabad, Telangana, India.
2Department of Pharmaceutics, St. Pauls College of Pharmacy, Turkayamjal, Hyderabad, Telangana, India.
3Department of Pharmacology, St. Pauls College of Pharmacy, Turkayamjal, Hyderabad, Telangana, India.
Corresponding Author E-mail: sunilpadavala@gmail.com
DOI : http://dx.doi.org/10.13005/bbra/3469
Download this article as:
![]()
An effective reversed phase high performance liquid chromatographic approach has been developed and validated for the determined for Favipiravir and its impurities, which may coexist in bulk drugs and solid pharmaceutical dosage forms. Using a mobile phase of pH 5.8 phosphate buffer and methanol (Gradient Program) at a flow rate of 1 ml/min at a wavelength of 325 nm, the separation was accomplished by an Inspire column (3.0*150mm, 5µ). Favipiravir recovery percentages at the three target concentrations were 99.67, 99.87, and 99.925, with a mean recovery of 99.59. The method's linearity varied from 0.1 to 0.5 PPM. This met the requirements for approval. The %RSD of 1.01, 0.63, and 0.95 for favipiravir, IMP-A, and IMP-B, respectively, showed how accurate the method was. The method's sensitivity is demonstrated by the LOD and LOQ values of 2.81 and 8.78, respectively. The method was validated as per ICH guidelines to prove its worth in order to adopt by pharmaceutical industries as a part of their routine quality control analysis.
KEYWORDS:Favipiravir; ICH guidelines; Method development; RP-HPLC; Validation
Introduction
Favipiravir an anti-viral agent (C5H4FN3O2, 6-fluoro-3-hydroxypyrazine-2-carboxamide, its molecular weight is 157.104g/mol, available as tablet dosage form useful in the management of SARs infections. Triphosphorylated favipiravir stops the viral genome from replicating by specifically inhibiting RNA polymerase. Favipiravir inhibits viral growth and elongation when it gets integrated into a developing RNA strand. A few studies on the competitiveness between purine nucleosides and favipiravir for RdRp binding have been published. The catalytic domain is favipiravir’s principal target, and it is anticipated to be comparable for different RNA viruses, contributing to its wide range of activity, despite it was first introduced to the market as an anti-influenza medication.1-5
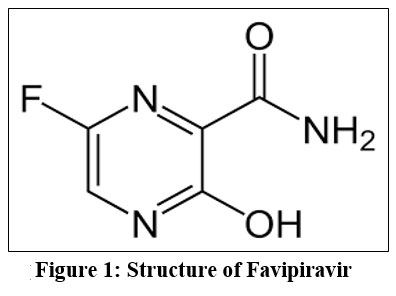 |
Figure 1: Structure of Favipiravir
|
Favipiravir –impurity A is 6-Fluoro-3,5-dihydroxypyrazine-2-carboxamide with molecular formula C5H4FN3O3 and molecular weight 173.1g/mol which is stored at 2-8°C.
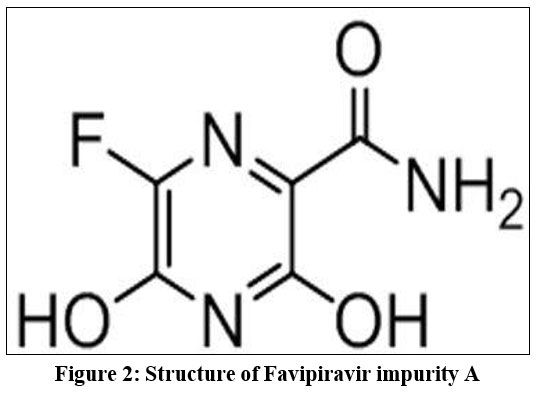 |
Figure 2: Structure of Favipiravir impurity A
|
Favipiravir –impurity B is 6-Fluoro-3-oxo-3,4-dihydropyrazine-4,5-d2 carboxamide- N,N-d2with molecular formula C5D4FN3O2and molecular weight 171.13g/mol which is stored at 2-8°C.
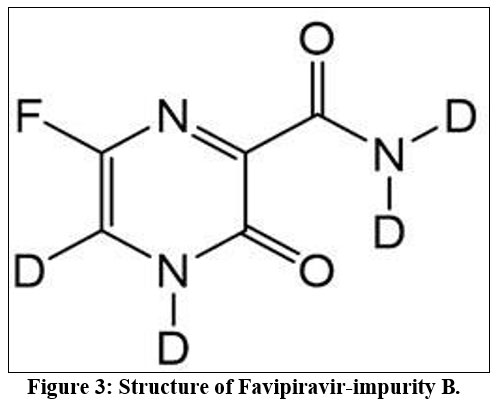 |
Figure 3: Structure of Favipiravir-impurity B.
|
A thorough review of the literature revealed that several analytical techniques were approved for the estimation of favipiravir and its related compounds using RP-HPLC and other analytical techniques 6-12 This study’s main objective is to create and validate a liquid chromatographic approach that could separate and measure favipiravir and its related compounds in a single run. The approach will be straightforward, precise, cost-effective, and need minimal run time for regular quality control testing. Using ICH principles as a guide, the established approach was transferred for validation and applied to routine quantitative analysis.
Materials and Methods
For this investigation, a Waters HPLC with a PDA detector was used. The columns employed were Phenomenex, YMC, the Inertsil-C18 ODS Plastil etc. Every glassware used in this investigation is borosil. A gift sample of Favipirair was obtained from Glenmark. MERCK chemicals are where we acquire HPLC quality water, methanol, acetonitrile, and potassium dihydrogen phosphate.
Method development
Standard solution
Precisely weighed 25 mg of the standard favipiravir, together with 1 mg of each of the impurities A and B, were taken into a 25 ml volumetric flask. 10 mL of diluent was added sonicated to fully dissolve the contents, and additional solvent was added to bring the volume to required level. 0.3 ml of the above stock solutions was taken into a 10-ml standard flask, diluted with diluent to the level.
Preparation of Impurity solution
The equivalent weight of 1 milligram of impurity A and 1 mg of impurity B was precisely weighed, transferred, and added to a 10 ml clean and a dry flask. Next, around 7 mL of diluent was added, and volume was then adjusted using the same. Additionally, 1 ml of the aforementioned stock solutions was pipetted into a 10 ml standard flask, diluted it to level with diluent.
Method Optimization
At first, varied ratios of methanol, orthophosphoric acid buffer, phosphate buffer, and acetonitrile to methanol were explored as the mobile phase. Ultimately, the gradient program’s mobile phase had been modified to comprise 0.1% ortho phosphoric acid buffer and acetonitrile.
The process of developing the approach was started utilizing a variety of columns, including the C18, Phenomenex, YMC, and Inertsil ODS columns. At last, the method was refined using Platsil (4.6*250mm, 5µ) at a flow rate of 1.0 ml/min. The chromatogram is shown in 4.
Method validation
Specificity
A Standard solution was prepared by using Favipiravir spiked with impurities as per test method and Injected into the chromatographic system. The chromatograms were shown in figures 5 and 6
Assay
The following formula was used.

Linearity
Using favipiravir spiked with impurities as a working standard, a series of solutions were created. Peak areas were measured for replicate samples. The r2 value was calculated from a graph Table 3, Figures 7, 8, and 9 present the results of favipiravir, IMP-A, and IMP-B, respectively.
Accuracy
The newly created method’s accuracy was assessed using recovery studies at three distinct levels, in triplicates which correspond to 50, 100, and 150%. The % recovery for favipiravir is given in Table 4.
Precision
Repeatability
Six duplicate injections were made, and each injection’s peak area was recorded. The results showed that the percentage RSD for the six replicate injections fell between the acceptable limits. The table 5 displayed the outcomes for favipiravir, IMP-A, and IMP-B.
Intermediate Precision
A study was conducted on different days maintaining the same parameters. The results showed that the percentage RSD complied with the acceptable limits. Table 6 presented the findings for favipiravir, IMP-A, and IMP-B.
Limit of Detection and Limit of Quantification
Determined by using the following formulae
LOD = 3.3 σ / S.
LOQ = 10 σ/S.
Robustness
A study was carried out to ascertain the impact of changes in the mobile phase and flow rate . Using flow rates of 0.9 ml/min and 1.1 ml/min, standard solution prepared and introduced into the HPLC system. The mobile phase composition was varied by 10% in the same investigations. The results were reported in fig 10 to 13 and in tables 7 and 8.
Results
Optimized conditions
Column: Platsil(3.0*150mm, 5µ)
Mobile phase: pH 5.8 Phosphate buffer: Methanol (Gradient)
Flow rate: 1.0 ml per min
Injection volume: 10 l
Run time: 20 min.
Table 1: Gradient programme for optimized method.
| Time | Mobile Phase-A % | Mobile Phase-B % |
| 0 | 70 | 30 |
| 3 | 60 | 40 |
| 7 | 55 | 45 |
| 12 | 50 | 50 |
| 16 | 45 | 55 |
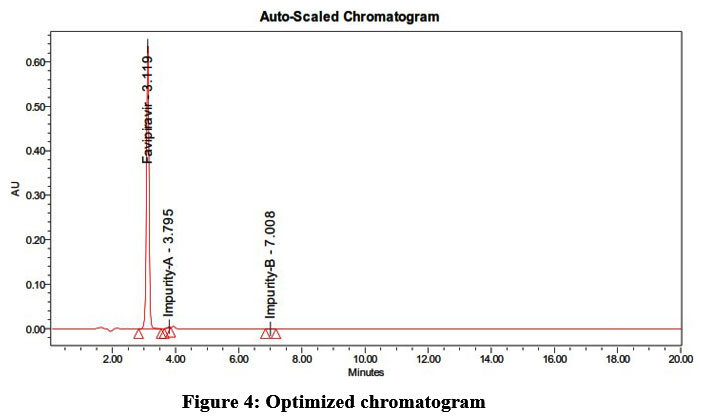 |
Figure 4: Optimized chromatogram
|
Table 2: Results of Optimized chromatogram
| Peak Name | Retention time | Area | USP Plate count | USP Tailing |
| Impurity-A | 4.366 | 67829 | 5219 | 1.2 |
| Favipiravir | 5.234 | 194265 | 2899 | 1.7 |
| Impurity-B | 8.448 | 45771 | 2766 | 1.5 |
The aforementioned trail was deemed optimized since it had a plate count of above 2000 and a USP tailing of less than 2.
Method Validation
Specificity
It is studied to assess ability of the method to measure the analyte of interest without any interference.
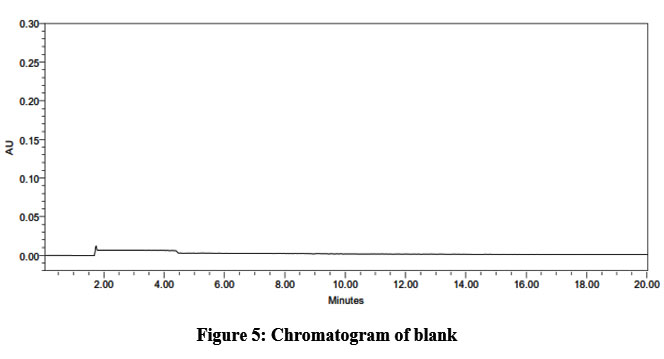 |
Figure 5: Chromatogram of blank
|
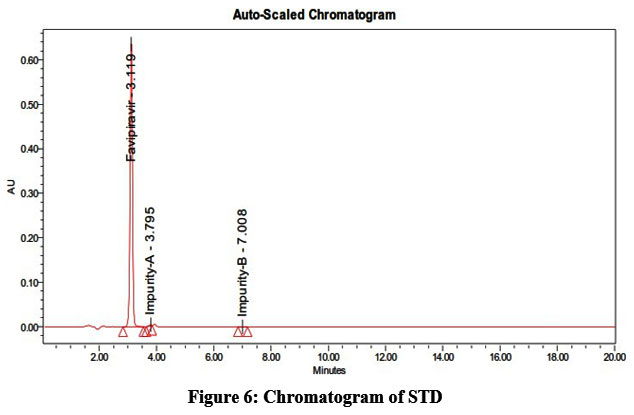 |
Figure 6: Chromatogram of STD
|
Assay Results
194317/194265 x 25/25 x 0.3/10 x 5/20 x 10/0.3 x 2/0.5 x 99.8/ 100 x 100 = 99.8%
The percentage purity of favipiravir was found to be 99.8% which fells in acceptable range of 98.0% – 102.0%.
Linearity
It was determined at five different levels for favipiravir and its impurities by replicate injections.
Table 3: Table for linearity of favipiravir and its impurities
| Level | Concentration of Imp. A (ppm) | Peak Areas of Favipiravir | Peak Areas of Imp. A | Peak Areas of Imp. B |
| Level-1 | 0.1 | 1168012 | 3850 | 937 |
| Level-2 | 0.2 | 2308831 | 8699 | 1659 |
| Level-3 | 0.3 | 3458390 | 12695 | 2542 |
| Level-4 | 0.4 | 4580110 | 16991 | 3279 |
| Level-5 | 0.5 | 5567203 | 20999 | 4179 |
| Correlation Coefficient | 0.999 | 0.999 | 0.999 | |
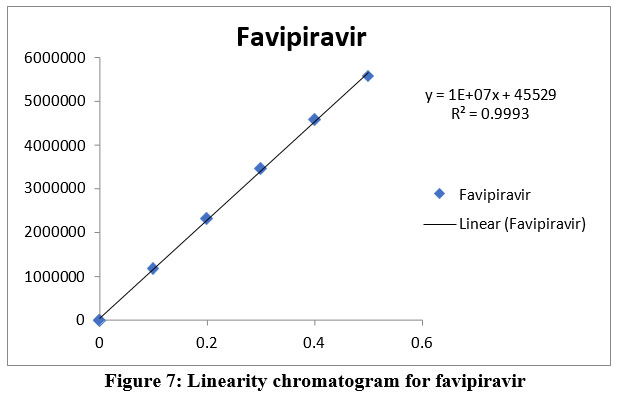 |
Figure 7: Linearity chromatogram for favipiravir
|
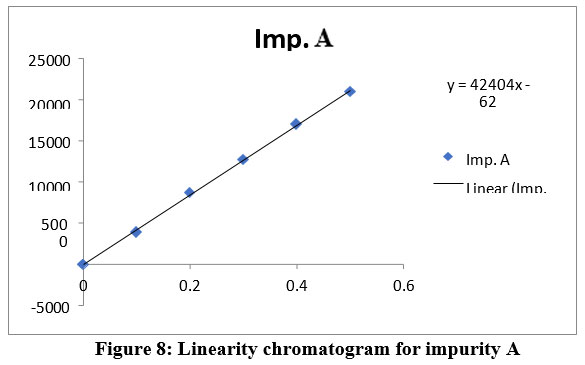 |
Figure 8: Linearity chromatogram for impurity A
|
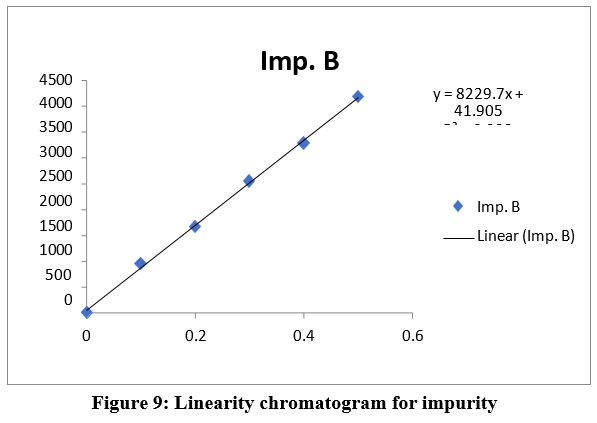 |
Figure 9: Linearity chromatogram for impurity
|
The acceptance criteria were met by the correlation coefficient of favipiravir, Imp-A, and Imp-B, which was found to be 0.999
Accuracy
Assessed by recovery studies at three different concentrations with respect to target concentrations.
Table 4: Recovery Studies of favipiravir
| Target level | Spiked (mg) | Recovered (mg) | % Recovery | Mean Recovery |
| 50% | 12.5 | 12.35 | 99.67 | 99.59 |
| 100% | 25 | 24.91 | 99.87 | |
| 150% | 37.5 | 37.45 | 99.25 |
With a mean recovery of 99.59, the percentage recovery of favipiravir at 50%, 100%, and 150% was determined to be 99.67, 99.87, and 999.25, respectively, and it was in compliance with the acceptance criteria.
Precision
Precision was determined by injecting six replicate injections and peak areas were measured.
Table 5: Precision results of favipiravir and Impurity A & B
| Injection | Areas of Favipiravir | Areas for IMP_A | Areas For IMP_B |
| Injection-1 | 3215992 | 26695 | 5392 |
| Injection-2 | 3216832 | 26725 | 5321 |
| Injection-3 | 3263239 | 26321 | 5319 |
| Injection-4 | 3255759 | 26462 | 5420 |
| Injection-5 | 3289296 | 26923 | 5324 |
| Injection-6 | 3227621 | 26751 | 5364 |
| Average | 3244790 | 26646.17 | 5356.667 |
| Standard Deviation | 29486.3 | 217.2 | 42.6 |
| %RSD | 0.91 | 0.82 | 0.80 |
The results showed that the six injections of favipiravir, IMP-A, and IMP-B had %RSDs of 0.91, 0.82, and 0.80%, respectively, which met acceptance criteria.
Intermediate Precision
Table 6: Table for ID precision results of Favipiravir and Its impurities A & B
| Injection | Areas of Favipiravir | Areas for IMP_A | Areas for IMP_B |
| Injection-1 | 3215986 | 26692 | 5381 |
| Injection-2 | 3216843 | 26825 | 5461 |
| Injection-3 | 3283392 | 26521 | 5329 |
| Injection-4 | 3245729 | 26682 | 5420 |
| Injection-5 | 3289127 | 26523 | 5338 |
| Injection-6 | 3225621 | 26952 | 5355 |
| Average | 3246116 | 26699.17 | 5380.667 |
| Standard Deviation | 32937.4 | 169.0 | 51.3 |
| %RSD | 1.01 | 0.63 | 0.95 |
The %RSD for ID precision of favipiravir, IMP-A and IMP-B was found to be 1.01, 0.63 and 0.95 respectively which was in compliance with acceptance criteria.
Limit of Detection
S/N = 146/52 = 2.81
Limit of Quantifictaion (Loq)
S/N = 562/64 = 8.78
With the LOD & LOQ values 2.81 and 8.78 respectively the method was proven to be sensitive.
Robustness
It was dedicated to know how the variations in rate of flow and mobile phase affects the credibility of the method.
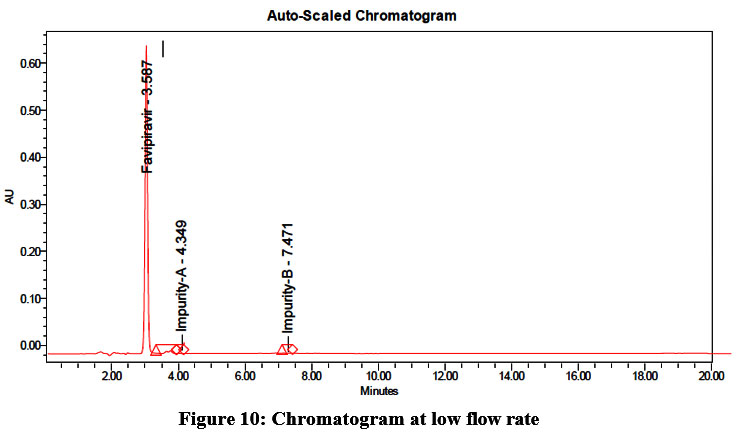 |
Figure 10: Chromatogram at low flow rate
|
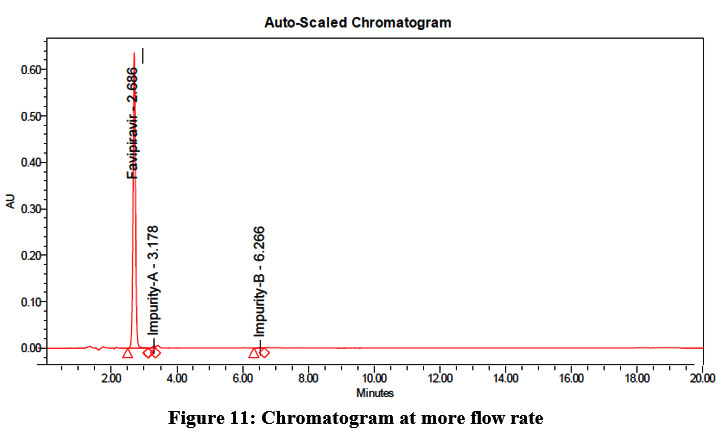 |
Figure 11: Chromatogram at more flow rate
|
Table 7: Impact of variation in flowrate
| S. No | Flow Rate | USP Plate Count | USP Tailing |
| 1 | 0.9 | 3928.16 | 1.26 |
| 2 | 1.0 | 4417.64 | 1.12 |
| 3 | 1.3 | 4326.12 | 1.14 |
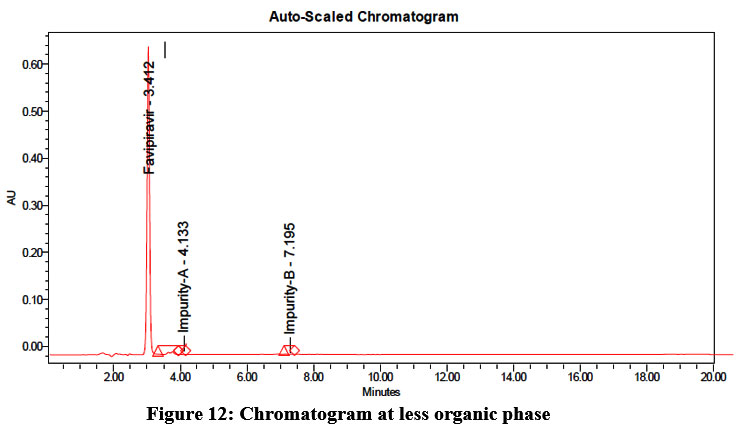 |
Figure 12: Chromatogram at less organic phase
|
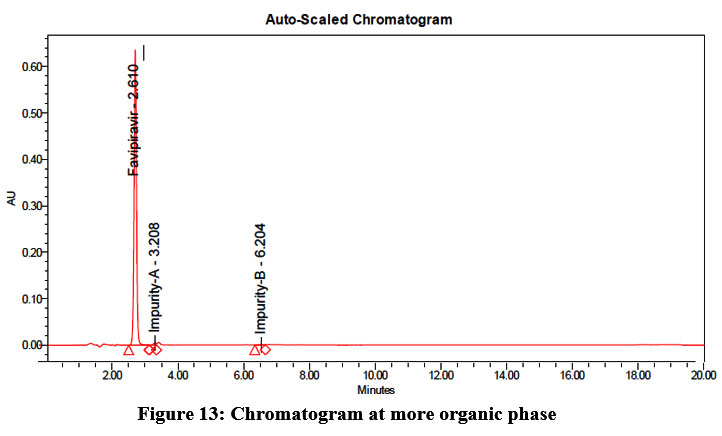 |
Figure 13: Chromatogram at more organic phase
|
Table 8: Impact of variation in organic phase composition
| Variation in organic phase | USP Plate Count | USP Tailing |
| ˂10% | 3920.12 | 1.24 |
| *Actual | 4425.61 | 1.16 |
| >10% | 4325.11 | 1.32 |
Discussion
Favipiravir and its related substances were estimated using a novel, adaptable technique. Using a Platsil column (4.6*250mm, 5µ) with acetonitrile and 0.1% orthophosphoric acid buffer in a gradient program, the procedure was optimized at a flowrate of 1.0 ml/min. This particular mobile phase is suitable to achieve high resolution separations for ionizable compounds The gradient program was selected to reduce the analysis time, enhance sensitivity, resolution and most importantly in the present study it was selected to elute the strongly retained impurities. The method has been validated in accordance with ICH guidelines.
At the three target concentrations, the percentage recovery of favipiravir was 99.67, 99.87, and 99.925, with a mean recovery of 99.59. The linearity of the approach ranged between 0.1 and 0.5 PPM This complied with the standards for acceptance. The precision of the approach was demonstrated by the %RSD of 1.01, 0.63, and 0.95 for favipiravir, IMP-A, and IMP-B, respectively. The method was found to be sensitive than the existing methods as the LOD and LOQ values were 2.81 and 8.78, respectively.
Conclusion
The development of an RP-HPLC method for favipiravir quantification in the presence of its contaminants has been considered because of its therapeutic significance. A Waters HPLC with a PDA detector was used in this investigation. The technique was optimized using Platsil (4.6*250mm, 5µ) at a flow rate of 1.0 ml/min. Lastly, the gradient program’s mobile phase was optimized using acetonitrile and 0.1% ortho phosphoric acid buffer. According to ICH rules, the procedure was validated, and all of the results were deemed to be in compliance with the acceptance requirements. In light of the above findings, we recommend the proposed method is adoptable in regular quality control analysis to identify and estimate favipiravir and its impurities as it is more suitable than existing methods. The scope of the method can be elaborated by performing forced degradation studies which ensures the stability of the method.
Acknowledgement
The authors are thankful to management, St.Pauls college of Pharmacy for providing the necessary facilities.
Funding Sources
The author(s) received no financial support for the research, authorship, and/or publication of this article.
Conflict of Interest
The authors do not have any conflict of interest.
Data Availability Statement
This statement does not apply to this article.
Ethics Statement
This research did not involve human participants, animal subjects, or any material that requires ethical approval.
Informed Consent Statement
This study did not involve human participants, and therefore, informed consent was not required.
Clinical Trial Registration
This research does not involve any clinical trials.
Permission to reproduce material from other sources
Not Applicable
Authors Contribution
Sunil Kumar Chaitanya Padavala: Conceptualization- Methodology , Writing -Original draft
Murugan Nithya : Conceptualization- Methodology, Data collection, Analysis.
Naga Haritha Pamujula : Visualization, Supervision, Project Administration.
Sareesh Kankanala: Visualization, Supervision, Project Administration
Rajini Kolure: Writing- Review and editing.
References
- Hsieh HP, Hsu JT: Strategies of development of antiviral agents directed against influenza virus replication. Curr Pharm Des. 2007;13(34):3531-42. https://doi.org/10.2174/138161207782794248
CrossRef - Furuta Y, Komeno T, Nakamura T. Favipiravir (T-705), a broad-spectrum inhibitor of viral RNA polymerase. Proc Jpn Acad Ser B Phys Biol Sci. 2017;93(7):449-463. doi: 10.2183/pjab.93.027.
CrossRef - Venkataraman S, Prasad BVLS et al. RNA Dependent RNA Polymerases: Insights from Structure, Function and Evolution. Viruses.2018;1010(2):76.doi: 10.3390/v10020076.
CrossRef - Hayden FG, Shindo N: Influenza virus polymerase inhibitors in clinical development. Curr Opin Infect Dis. 2019; 32(2):176-186. doi: 10.1097/QCO.0000000000000532.
CrossRef - Madelain V, Nguyen TH et al.Ebola Virus Infection: Review of the Pharmacokinetic and Pharmacodynamic Properties of Drugs Considered for Testing in Human Efficacy Trials. Clin Pharmacokinet. 2016;55(8):907-23. doi: 10.1007/s40262-015-0364-1.
CrossRef - Nandeesha Itigimath, Hadagali Ashok et al.LC-MS/MS Method development and validation for determination of favipiravir pure and tablet dosage forms. Turk J Pharm Sci. 2023;20(4):226-233. Doi: 10.4274/tips.galenos.2022.75470.
CrossRef - Nagaraju Bandaru,Naga Venkata Indira Devi Jajula et al. Stability Indicating RP-HPLC Method Development and Validation for Quantification of Favipiravir and its Related Substances.IJPQA.2024;15(3):1450-1454. https://doi.org/10.25258/ijpqa.15.3.55
CrossRef - Maryana salmah, Bence sipos et al. Development and validation of novel isocratic RP-HPLC method using a QBD approach for the quantification of Favipiravir. European Journal of Phamaceutical Sciences. 2024; 214:107276. DOI: 10.25258/ijpqa.15.3.55
CrossRef - Mohammed W Nassar, Ahmed Serag,et al. Development and Validation of a RP-HPLC method for simultaneous determination of five Covid 19 antiviral drugs in pharmaceutical formulations. Scientific Reports. 2025; 15(1):24570. org/10.1038/s41598-025-09904-0.
CrossRef - Mohammad Hailat, Israa Al-Ani et al.Development and Validation ofHPLC-DADMethod for the Determination of Favipiravir and Studying the Impact of Vitamin Con the Pharmacokinetics of COVID-19 AntiviralDrug Favipiravir. Separations. 2022; 9(10): doi.org/10.3390/separations9100303.
CrossRef - Sayyed Nazifa Sabir Ali, Lajporiya Mobina1 et al .Analytical Method Development and Validation and Forced Degradation Stability-Indicating Studies of Favipiravir by RP-HPLC and UV in Bulk and Pharmaceutical Dosage Form.JPRI.2021;33(48B):254-271, DOI: 10.9734/JPRI/2021/v33i48B33283.
CrossRef - Moammal Qurt, Rania Eshtayyeh, Hani Naseef, Abdullah Rabba, Abdallah Damin Abukhalil, Numan Malkieh , and Maher Kharouf. Quantitative Analysis of Favipiravir by HPLC: Developmentand Validation. International Journal of Analytical Chemistry.2023.org/10.1155/2023/8847958
CrossRef
Accepted on: 25-11-2025
Second Review by: Dr. Makhabbah Jamilatun
Final Approval by: Dr. Eugene A. Silow


![]()
![]()
