
Formulation and Evaluation of Papain Transdermal Patches Using Central Composite Design
 , Sumakanth and Aparna Peri
 Department of Pharmaceutical Sciences, RBVRR Women’s college of Pharmacy, Hyderabad, India
Corresponding Author E-mail: mpkusuma@gmail.com
DOI : http://dx.doi.org/10.13005/bbra/3458
Download this article as:
![]()
This study deals with the formulation of transdermal patches containing Papain using the solvent evaporation method employing central composite design of experiments. 27 formulations were done using different combinations using hydrophilic polymers (HPMCK15, PVP, Eudragit) and hydrophobic polymers (ethyl cellulose), along with solvents (methanol, distilled water, dichloromethane), plasticizer (PEG), and backing membrane (glycerine). The formulations were evaluated based on thickness, folding endurance, transparency, in vitro drug release, and physicochemical properties. Through comprehensive analysis, formulations F10 to F27 were eliminated, and the remaining formulations (F1-F10) were compared. F1 exhibited the highest folding endurance and invitro drug release at 7h were in the order F1>F6>F3>F4>F2>F5>F7>F9>F8. The above results are in good agreement with DOE.Thus developing a transdermal system of papain is more selective for site-specific analgesic avoiding gastrointestinal incompatibility. These findings were in agreement with the predicted model, demonstrating the optimised nature of the F1 formulation. Ex vivo studies validated the in vitro results, indicating stability for up to 3 months and maximum antioxidant activity.
KEYWORDS:Antioxidant; Central composite design; Eudragit; Papain; Polymers; Transdermal patch
Introduction
Transdermal Patches are one class of drug delivery which provides prolonged drug release compared with that of ointments, gels and creams. They provide controlled and sustained release of drugs over an extended period, helps maintain therapeutic drug levels in the bloodstream, reducing the need for reapplication thus providing a consistent therapeutic effect.1
Papain is known for its anti-inflammatory, analgesic and anti-oxidant actions.2,3 As prolonged sustained drug release is required for exhibiting anti inflammatory action, with additional physicochemical properties(molecular weight and solubility,10mg/ml) makes it suitable for the formulation of transdermal patches by solvent evaporation method. In order to study the effect of multiple variables on the response and to develop cause and effect relationship, response surface methodology was opted
Materials and Methods
In this research, we utilized response surface methodology(central composite design) to examine how altering the quantities of two specific polymers might influence the results. One of the polymers, HPMCK15 , was maintained at a constant level, while the other polymers, namely Ethyl cellulose, Polyvinyl pyrrolidine, and Eudragit, were examined at two different levels. The primary focus was to analyze the effects of these polymers on two response variables: in vitro release (Y1) and folding endurance (Y2). By manipulating the levels of these polymers, the study aimed to determine their influence on the desired properties of the formulation(Table1-4).
Table 1: Factors used in the design of expert
| Factor | Name | Type | Subtype | Minimum | Maximum | Coded low | CodedHigh | Mean | Std. Dev |
| A | HPMCK15 | NUMERIC | CONTINUOUS | 0.0396 | 0.1104 | +1-0.05 | +1-0.10 | 0.0750 | 0.0204 |
| B | EUDRAGIT | NUMERIC | CONTINUOUS | 0.0793 | 0.2207 | +1-0.010 | +1-0.020 | 0.1500 | 0.0408 |
Formulation of Transdermal Patches of Papain
Transdermal patches were done using the solvent evaporation method, following a formulation design recommended by the Design Expert software. Different formulations were prepared by varying ratios of polymers. Hydrophilic polymers like HPMCK15, PVP and Eudragit and hydrophobic polymer ethyl cellulose, solvents like methanol, distilled water and dichloromethane were used in this study. PEG is used as a plasticizer and glycerine is used as a backing membrane (Table 2&4).
Table 2: Composition of formulations F1 to F9
| Ingredients | F1 | F2 | F3 | F4 | F5 | F6 | F7 | F8 | F9 |
| Papain( gm) | 0.2 | 0.2 | 0.2 | 0.2 | 0.2 | 0.2 | 0.2 | 0.2 | 0.2 |
| HPMCK15( g) | 0.2 | 0.15 | 0.22 | 0.2 | 0.1 | 0.15 | 0.1 | 0.15 | 0.079 |
| PVP ( g) | 0.1 | 0.15 | 0.15 | 0.2 | 0.1 | 0.079 | 0.2 | 0.22 | 0.15 |
| Eudragit ( g) | – | – | – | – | – | – | – | – | – |
| EC ( g) | – | – | – | – | – | – | – | – | – |
| Methanol (mL) | 10 | 10 | 10 | 10 | 10 | 10 | 10 | 10 | 10 |
| Distilled water (mL) | 10 | 10 | 10 | 10 | 10 | 10 | 10 | 10 | 10 |
| Dichloromethane (mL) | – | – | – | – | – | – | – | – | – |
| PEG (gm) | 0.4 | 0.4 | 0.4 | 0.4 | 0.4 | 0.4 | 0.4 | 0.4 | 0.4 |
| Glycerine (mL) | q. s | q. s | q. s | q. s | q. s | q. s | q. s | q. s | q. s |
Table 3: Composition of formulation F10 to F18
| Ingredients | F10 | F11 | F12 | F13 | F14 | F15 | F16 | F17 | F18 |
| Papain (gm) | 0.2 | 0.2 | 0.2 | 0.2 | 0.2 | 0.2 | 0.2 | 0.2 | 0.2 |
| HPMCK15(gm) | 0.2 | 0.15 | 0.22 | 0.2 | 0.1 | 0.15 | 0.1 | 0.15 | 0.079 |
| PVP (gm) | – | – | – | – | – | – | – | – | – |
| Eudragit (gm) | – | – | – | – | – | – | – | – | – |
| EC (gm) | 0.1 | 0.15 | 0.15 | 0.2 | 0.1 | 0.079 | 0.2 | 0.22 | 0.15 |
| Methanol (mL) | 10 | 10 | 10 | 10 | 10 | 10 | 10 | 10 | 10 |
| Distilled water (mL) | 10 | 10 | 10 | 10 | 10 | 10 | 10 | 10 | 10 |
| dichloromethane(mL) | – | – | – | – | – | – | – | – | – |
| PEG (gm) | 0.4 | 0.4 | 0.4 | 0.4 | 0.4 | 0.4 | 0.4 | 0.4 | 0.4 |
| Glycerine (mL) | q. s | q. s | q. s | q. s | q. s | q. s | q. s | q. s | q. s |
Table 4: Composition of formulation F19 to F27
| Ingredients | F19 | F20 | F21 | F22 | F23 | F24 | F25 | F26 | F27 |
| Papain (gm) | 0.2 | 0.2 | 0.2 | 0.2 | 0.2 | 0.2 | 0.2 | 0.2 | 0.2 |
| HPMCK15(gm) | 0.2 | 0.15 | 0.22 | 0.2 | 0.1 | 0.15 | 0.1 | 0.15 | 0.079 |
| PVP (gm) | – | – | – | – | – | – | – | – | – |
| Eudragit (gm) | 0.1 | 0.15 | 0.15 | 0.2 | 0.1 | 0.079 | 0.2 | 0.22 | 0.15 |
| EC (gm) | – | – | – | – | – | – | – | – | – |
| Methanol (mL) | – | – | – | – | – | – | – | – | – |
| Distilledwater (mL) | 10 | 10 | 10 | 10 | 10 | 10 | 10 | 10 | 10 |
| dichloromethane(mL) | 10 | 10 | 10 | 10 | 10 | 10 | 10 | 10 | 10 |
| PEG (gm) | 0.4 | 0.4 | 0.4 | 0.4 | 0.4 | 0.4 | 0.4 | 0.4 | 0.4 |
| Glycerine (mL) | q. s | q. s | q. s | q. s | q. s | q. s | q. s | q. s | q. s |
Evaluation Test for Transdermal Patches
To determine the impact of the different polymer combinations, all of the prepared formulations are put through a preliminary screening process.
Thickness
Using a screw gauge with the lowest count, the average thickness of prepared transdermal films was measured at five distinct points.4
Folding Endurance
By folding the same film patch multiple times until it breaks, the patches’ folding endurance was tested. It depends on the number of times the same area on the film is folded before the film breaks or becomes visibly cracked.5
Weight Variation
By weighing each of the ten randomly chosen patches individually and then determining the average, the patches were subjected to weight variation.6
Percentage Moisture Content
The films were checked for weight separately and kept in the desiccator with calcium chloride at the room temperature for about 24h.7 The films then were reweighed after 24 h, and percentage content of moisture is determined
Percentage Moisture Uptake
The films are placed in a desiccator with a saturated potassium chloride solution for 24 h at room temperature8. These films are reweighed after 24h, and percentage moisture uptake is obtained using the formula below:
Final weight -Initial weight / Final weight× 100
Drug Content
The patch is divided into a 2 cm by 2 cm section, which is disintegrated in the 100 mL of H20 (distilled water) and agitated constantly about around 24 h. The entire solution is sonicated for 15 minutes. After filtering, the amount of medication was measured spectrophotometrically at a 280 nm wavelength.8
In Vitro Drug Release Parameters
For the in vitro drug release testing, a Franz diffusion cell was employed. This cell includes a receptor compartment with a volume of 50 mL. In this setup, a cellulose acetate membrane, with a pore size of 0.45, was inserted between the two compartments. On the surface of this membrane, the transdermal film was positioned. The receptor compartment of the diffusion cell was filled with a phosphate buffer solution having a pH of 7.4. To ensure proper mixing, magnetic beads were employed to continuously agitate the solution. Moreover, the temperature was carefully maintained at 32±0.5°C to simulate the conditions similar to that of human skin.The entire setup is positioned on a hot plate magnetic stirrer. The samples are taken out at different intervals and their drug concentration is spectrophotometrically analysed. The receptor solution was replaced with an equivalent volume of the phosphate buffer for each sample removal.9,10
Ex vivo drug release Studies
Ex vivo drug release research was conducted using a Franz diffusion cell with a 50 mL capacity in the receptor compartment. An animal skin membrane was placed between the donor and receptor compartments of the diffusion cell. This animal skin membrane was coated with the formulated transdermal film. The receptor compartment of the diffusion cell contained a phosphate buffer solution with a pH of 7.4. To ensure thorough mixing, magnetic beads were used, and they were positioned on a hot plate magnetic stirrer. The samples are taken at various intervals, and the drug concentration is examined spectrophotometrically.11
Determination of permeability coefficient
Similar to in vitro diffusion studies, ex vivo diffusion tests were carried out on goat skin. Goat skin membrane was used in place of the dialysis membrane. The average cumulative amount of drug penetrated per unit surface area of skin is displayed versus time using the Ex vivo parameters. The following equation was used to determine the effective permeability coefficient and flux values in steady state.12
Flux = permeability coefficient × concentration of donor solution (mg mL-1)
Determination of Antioxidant activity
In the test tubes, 0.25 mL samples/standard solutions are mixed with 0.625 mL potassium buffer (0.2 mL) and 0.625 mL 1% potassium ferricyanide solution at varied concentrations. The reaction mixture was incubated at 500C for 20 minutes to complete the reaction. The test tubes were then filled with 0.625mL of a 10% trichloroacetic acid solution. After centrifuging the final mixture at 3000 rpm for 10 minutes, 0.36 mL of ferric chloride solution and made upto volume with distilled water. A calorimeter and a blank were used to measure the solution’s absorbance at 695 nm. The identical solution mixture and incubation conditions were employed for a typical blank solution devoid of a standard.13
Stability and Kinetic studies
The transdermal patches were subjected to stability studies by keeping at 2500C with 65% relative humidity and 400 degrees Celsius with 75% relative humidity for roughly three months after being encapsulated in polyethylene-coated aluminium foils. They were also subjected to kinetic studies.14
Results
Papain was visually inspected for its appearance and color, and these observations were compared to the values reported on DrugBank. Furthermore, it was assessed for its solubility in water, methanol, and dichloromethane.
Development of calibration curve for Papain
Standard plot of papain was plotted at 280nm, the regression equation obtained using Microsoft Excel by setting Y intercept 0. There is a positive correlation between Papain concentration and absorbance values (correlation coefficient, R2 = 0.995)(Graph 1).
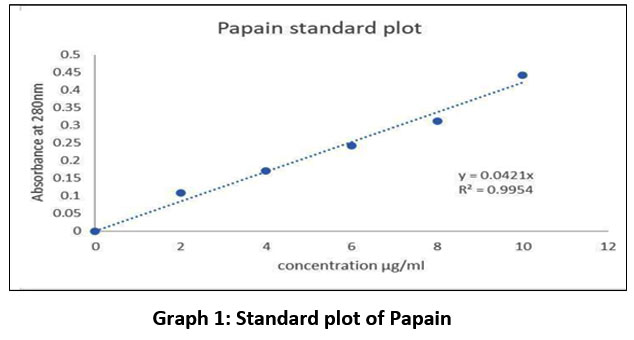 |
Graph 1: Standard plot of Papain |
Thickness
All formulations were evaluated for thickness, with values ranging from 0.11 to 0.17mm. The high thickness could be due to the insolubility and uneven distribution of polymers such as ethyl cellulose and eudragit (Table 5).
Transparency and percentage moisture content
Formulations F1 to F9 appear to be entirely transparent, Formulations F10 to F18 were translucent, and Formulations F19 to F27 were opaque, probably as a result of ethyl cellulose and eudragit insolubility. The results of percentage moisture determination test, which evaluates a film’s physical stability and integrity in high humidity circumstances, range from 17.01 to 20.50%. (Table 5).
Percentage moisture uptake The moisture uptake percentage for each formulation was examined, and the findings varied from 19.01 to 20.60% (Table 5).
Percentage Drug content
All prepared transdermal formulations are subjected to the conventional method of drug content analysis, and results are shown in the (Table 5). The drug content ranges consistently between 91.28 to 99.73% .This suggests that the method used to create the films can deliver consistent content with little variation.
Table 5: Evaluation parameters of papain transdermal patch
| Formulation | Thickness | Transparency | %Moist | %Moist | %Drug |
| Code | (mm) | content | uptake | content | |
| F1 | 0.11±0.01 | ++ | 17.90±0.01 | 20.60±0.01 | 99.40±0.01 |
| F2 | 0.14±0.01 | ++ | 17.94±0.01 | 20.60±0.01 | 94.30±0.02 |
| F3 | 0.11±0.01 | ++ | 18.01±0.01 | 20.60±0.02 | 97.60±0.01 |
| F4 | 0.11±0.01 | ++ | 17.94±0.01 | 20.60±0.01 | 95.20±0.02 |
| F5 | 0.13±0.01 | ++ | 17.01±0.01 | 20.01±0.01 | 93.20±0.01 |
| F6 | 0.11±0.02 | ++ | 17.95±0.02 | 20.06±0.02 | 98.40±0.01 |
| F7 | 0.12±0.01 | ++ | 17.01±0.01 | 20.60±0.01 | 91.30±0.01 |
| F8 | 0.11±0.02 | ++ | 17.95±0.01 | 20.60±0.01 | 98.10±0.01 |
| F9 | 0.13±0.01 | ++ | 18.85±0.02 | 20.60±0.02 | 90.10±0.01 |
| F10 | 0.14±0.01 | + | 18.01±0.01 | 20.01±0.01 | 90.23±0.01 |
| F11 | 0.15±0.01 | + | 20.01±0.01 | 20.01±0.01 | 98.50±0.01 |
| F12 | 0.13±0.01 | + | 20.00±0.02 | 20.01±0.01 | 95.98±0.01 |
| F13 | 0.11±0.02 | + | 20.22±0.01 | 20.20±0.01 | 99.90±0.02 |
| F14 | 0.16±0.01 | + | 20.50±0.01 | 20.50±0.01 | 93.98±0.01 |
| F15 | 0.16±0.01 | + | 20.02±0.01 | 20.10±0.01 | 99.75±0.01 |
| F16 | 0.16±0.01 | + | 20.50±0.02 | 20.10±0.01 | 93.95±0.01 |
| F17 | 0.14±0.01 | + | 19.50±0.01 | 19.50±0.01 | 91.95±0.01 |
| F18 | 0.14±0.01 | + | 19.00±0.01 | 19.01±0.02 | 96.86±0.01 |
| F19 | 0.16±0.01 | – | 20.85±0.02 | 20.01±0.01 | 99.01±0.02 |
| F20 | 0.16±0.01 | – | 20.50±0.01 | 20.01±0.02 | 97.67±0.01 |
| F21 | 0.16±0.01 | – | 20.21±0.01 | 20.01±0.01 | 92.78±0.01 |
| F22 | 0.15±0.01 | – | 20.30±0.01 | 20.01±0.01 | 96.65±0.01 |
| F23 | 0.16±0.01 | – | 20.25±0.01 | 20.05±0.01 | 98.98±0.02 |
| F24 | 0.16±0.01 | – | 20.01±0.01 | 20.10±0.01 | 90.02±0.02 |
| F25 | 0.16±0.01 | – | 20.01±0.01 | 20.12±0.01 | 95.87±0.01 |
| F26 | 0.16±0.01 | – | 20.08±0.01 | 20.01±0.01 | 91.17±0.01 |
| F27 | 0.17±0.01 | – | 20.18±0.01 | 20.01±0.01 | 94.45±0.01 |
++ patch is fully transparent
+ patch is translucent
– patch is opaque
Based on the values of thickness, folding endurance and transparency, formulations F10 to F27 were eliminated for further analytical tests.
Test for Folding Endurance
Folding endurance determines the effectiveness of plasticizer and thus durability of patch. The results range between 130 to 295 indicating that prepared patches can endure mechanical pressure and remain flexible, the formulation with the best folding resistance is F1. The outcomes are viewed as a response in design expert software (Y2).
Table 6: Test for Folding endurance
| Formulation Code | Folding endurance |
| F1 | 295±0.01 |
| F2 | 150±0.01 |
| F3 | 260±0.01 |
| F4 | 265±0.01 |
| F5 | 260±0.02 |
| F6 | 290±0.01 |
| F7 | 280±0.01 |
| F8 | 285±0.01 |
| F9 | 280±0.01 |
The F-value of the model, which is 108.97, demonstrates that the ANOVA findings demonstrate the model’s significance. An F- value this large could only be brought on by noise 0.01% of the time. In this instance, the important model terms were AB, A2, and B2 (Table 7).
Table 7: Results of Folding endurance ANOVA from Design expert
| Source | Sum of squares | df | Mean square | F-value | p-value | |
| Model | 45484.88 | 5 | 9096.98 | 108.97 | <0.0001 | Significant |
| A-A | 17.82 | 1 | 17.82 | 0.2135 | 0.6581 | |
| B-B | 189.34 | 1 | 189.34 | 2.27 | 0.1758 | |
| AB | 1406.25 | 1 | 1406.25 | 16.85 | 0.0045 | |
| A2 | 23814.57 | 1 | 23814.57 | 285.28 | <0.0001 | |
| B2 | 25870.12 | 1 | 25870.12 | 309.90 | <0.0001 | |
| Residual | 584.35 | 7 | 83.48 | |||
| Lack of fit | 584.35 | 3 | 194.78 | |||
| Pure error | 0.0000 | 4 | 0.0000 | |||
| Cor Total | 46069.23 | 12 |
Similarly, there’s a minor deviation of less than 0.2 between the expected R-squared value R2 of 0.9098 and the adjusted R2 of 0.9783. This suggests that the signal-to-noise ratio measurement is sufficiently accurate, as the ideal ratio exceeds 4. Consequently, this model is suitable for exploring the design space. These findings collectively affirm the model’s appropriateness.
When expressing the equation in terms of actual factors, it becomes a useful tool for predicting the response at specific levels of each factor. It’s important to specify these levels in the original units corresponding to each factor. However, it’s crucial to note that this equation isn’t suitable for assessing the relative impact of each factor. This is because the coefficients have been adjusted to match the units of each factor, and the intercept is not centered within the design space. Nonetheless, the equation does reveal that both HPMC and PVP exhibit a similar influence on the flexibility of the patch, especially at higher concentrations.
Y2 = 149.99 – 2.11X1 + 6.87X2 – 37.49X1 X2 + 116.65X1 2+ 121.58X22___Eq 1
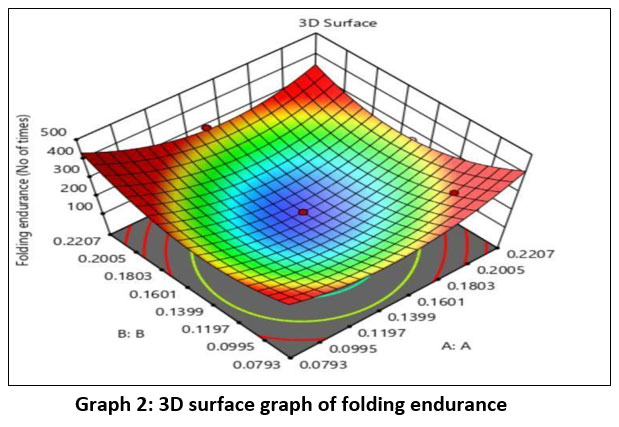 |
Graph 2: 3D surface graph of folding endurance |
The results indicate that the influence of factors (HPMC and PVP) on folding endurance, Both the polymers were having comparable effect on the flexibility of the transdermal patch. Relatively PVP was showing little greater impact than HPMC (Graph 2.)
In vitro drug release studies of transdermal patch
The in vitro drug release, was studied using Franz diffusion cell it was observed that the drug release was greatest at higher HPMC concentrations and decreased as concentration of PVP increases. The creation of gelatinous pores as a result of the dissolving of a soluble portion of the polymer nature, which reduces the length of drug molecules diffusion into the diffusion medium and increases release rate, may be the cause of aqueous drug release2. The kind and concentration of the polymer in a formulation maintaining sufficient thickness and good folding endurance determines the rate of drug release from it. In vitro release of formulation follows the order: F1>F6>F3>F4>F2>F5>F7>F9>F8 (Table 8). The findings indicate that the F1 formulation is showing maximum drug release at 7 hrs.
Table 8: Invitro drug release of formulations (F1 – F9)
| Time | F1 | F2 | F3 | F4 | F5 | F6 | F7 | F8 | F9 |
| (hrs) | |||||||||
| 1 | 31.04 ±0.01. |
26.68 ±0.01. |
24.49± 0.01 | 21.90 ±0.01. |
23.20 ±0.01. |
33.01 ±0.01 |
21.20 ±0. |
18.90 ±0. |
20.18 ±0.02 |
| 2 | 44.54 ±0.01 |
35.90 ±0. |
38.90 ±0.01 |
32.01 ±0.01. |
33.09 ±0.01. |
42.90 ±0.01 |
31.29 ±0.01 |
25.90 ±0.01 |
31.13 ±0.01 |
| 3 | 56.68 ±0. |
45.78 ±0. |
48.79 ±0.01 |
41.80 ±0.01 |
45.89 ±0.01. |
52.86 ±0.01 |
44.54 ±0.01 |
33.87 ±0.02 |
45.65 ±0.01. |
| 4 | 69.01 ±0. |
55.90 ±0. |
53.78 ±0.01 |
54.31 ±0.01 |
59.01 ± 0.01. |
67.79 ±0.01 |
50.90 ±0.02 |
43.76 ±0.02 |
55.65 ±0.02. |
| 5 | 78.64 ±0.01. |
69.89 ±0.01. |
62.10 ±0.01. |
67.09 ±0.02 |
69.05 ±0.01. |
77.89 ±0.01 |
64.48 ±0.01 |
56.09± 0.01 | 64.32 ±0.01. |
| 6 | 85.05 ±0.01 |
74.32 ±0.01 |
78.01 ±0.01. |
75.20 ±0.02 |
73.20 ±0.01. |
89.09 ±0.01 |
75.01 ±0.01 |
69.69 ± 0.01. |
73.27 ±0.02. |
| 7 | 95.66 ±0.01 |
84.30 ±0.01 |
87.60 ±0.01 |
85.20 ±0.02 |
83.20 ±0.01 |
93.4 ±0.01 |
81.3 ±0.02 |
72.6 ±0.01 |
80.1 ±0.01 |
Table 9: Results of Invitro ANOVA from Design expert
| Source | Sum of squares | df | Mean square | F-value | p-value | |
| Model | 240.72 | 2 | 120.36 | 17.23 | 0.0006 | Significant |
| A-A | 82.60 | 1 | 82.60 | 11.82 | 0.0063 | |
| B-B | 158.12 | 1 | 158.12 | 22.63 | 0.0008 | |
| Residual | 69.87 | 10 | 6.99 | |||
| Lack of fit | 5012 | 6 | 8.35 | 1.69 | 0.3179 | |
| Pure error | 19.75 | 4 | 4.94 | |||
| Cor Total | 310.59 | 12 |
According to the table, the model’s F-value of 17.23 signifies its significance. There is only a 0.06% probability that such a substantial F-value could arise from random variability.
Model terms with p-values below 0.0500 are considered significant. In this instance, terms A and B are indeed significant. Conversely, p-values exceeding 0.1000 suggest that certain model terms, excluding those essential for supporting hierarchy, could be omitted to potentially enhance the model.
The lack of fit value of 1.69 suggests that the lack of fit is not notably significant compared to the pure error. There is a 31.79% probability that a lack of fit F-value of this magnitude could arise due to random variations. Having a non-significant lack of fit is desirable, as it indicates that the model fits well .
This observation aligns with the fit statistics in Table 9, where the predicted R-squared value of 0.5743 closely approximates the adjusted R-squared value of 0.7301. In other words, the difference between these two values is less than 0.2, indicating a reasonably good agreement.
The equation (Eq. 2) can be used to predict reaction for the specific amounts of each of the factor in terms of actual factors. In this equation, the effect of HPMC on drug release is larger. The same is shown in the illustration.
Y2 = 89.70412 +64.22430X1 – 88.87092X2 ———— Eq.2
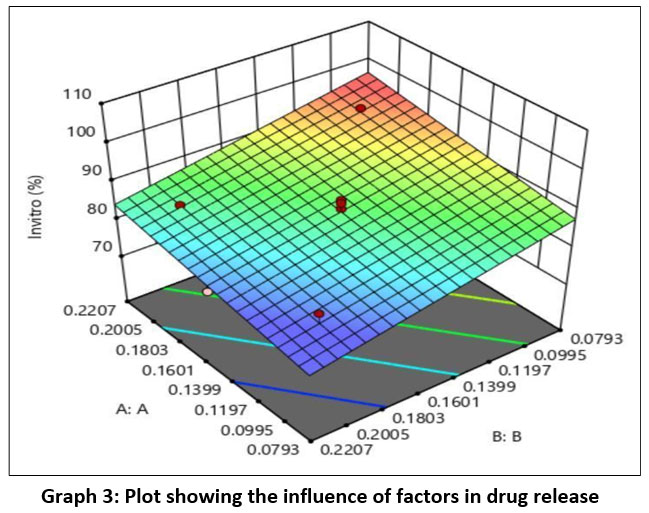 |
Graph 3: Plot showing the influence of factors in drug release |
Optimization
Optimization was performed by design based on obtained responses by the numerical and the graphical representation
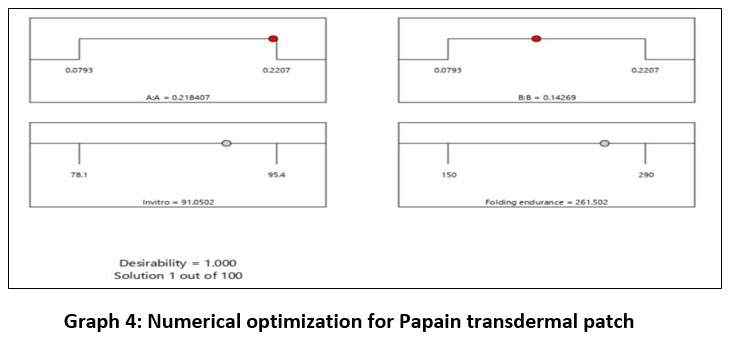 |
Graph 4: Numerical optimization for Papain transdermal patch |
Based on the minimum and maximum drug release rates are given. The formulation with greater value is considered. The overlay plot clearly illustrates this. The response requirements can be met at a certain point, according to the overlay plot. The overlay plot’s area that doesn’t adhere to the requirements gets darkened out. The flag is set up as a representation of completeness. The areas shown in yellow are those where factors can be set up to satisfy the conditions for all responses(Graph 5).
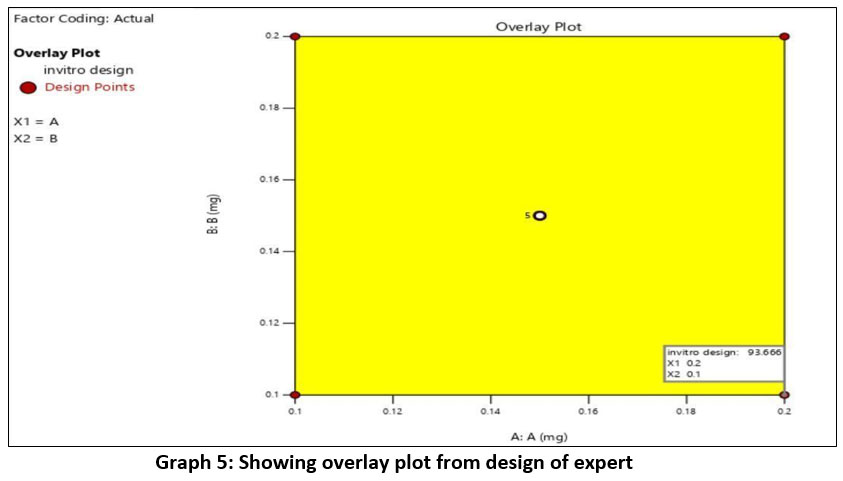 |
Graph 5: Showing overlay plot from design of expert |
Ex-vivo drug release profile
By using the Franz diffusion cells and goat skin, ex-vivo drug release for formulation F1 is examined and contrasted with invitro drug release. After 7 h, slight variation in the release rate between invitro and exvivo is observed (Table 10).
Table 10: In-vitro and ex-vivo drug release profile for formulation F1
| Time in Hrs | In Vitro drug release of F1 | Ex-vivo drug release of F1 |
| 1 | 31.04±0.01 | 33.10±0.01 |
| 2 | 44.54±0.02 | 45.54±0.01 |
| 3 | 56.68±0.01 | 57.98±0.01 |
| 4 | 69.01±0.01 | 71.85±0.02 |
| 5 | 78.64±0.02 | 79.65±0.02 |
| 6 | 85.05±0.01 | 87.88±0.01 |
| 7 | 93.66±0.01 | 95.69±0.01 |
Kinetic models for optimized formulations
Release kinetics and drug release mechanism of the optimised formulations was studied and it was observed that R2 values, the formulation (F1) employs first order release and stable upto 3 months.
Permeability coefficient
Permeation coefficient and flux was determined and the results were tabulated (Table 11)
Table 11: Permeability coefficient and Flux
| Formulation code | Flux (mg mL-1) | Permeation coefficient (cm/hr) |
| F1 | 1.14 mg mL-1 | 0.0057 mg/sq.cm |
Determination of Antioxidant activity of optimized formulation
The optimized formulation F1 is subjected to antioxidant activity and the concentration of ascorbic acid which is produced was compared with that of pure drug. It was observed that there is no much significant variation in antioxidant activity comparative to the pure drug. This demonstrates the intrinsic activity of the papain thus showing sustained release when formulated in the form of gel.
Table 12: Determination of Antioxidant activity of optimized formulation
| Absorbance at 695nm | Concentration of ascorbic acid(µg/mL) | |
| Pure Papain | 1.09 | 210.07 |
| Formulation F1 | 1.01 | 196.01 |
Discussions
The present study emphasis formulation of transdermal patches of papain using solvent evaporation method with the utilization of Design of experiments. Different formulations were prepared by varying ratios of polymers. Hydrophilic polymers like HPMCK15, PVP and Eudragit and hydrophobic polymer ethyl cellulose, solvents like methanol, distilled water and dichloromethane were used in this study. Based on the values of thickness, folding endurance and transparency, formulations F10 to F27 were eliminated for further analytical tests. Out of which formulation F1 reveals maximum folding endurance. The results correlated with the model predicted by DOE. As per the results of the DOE, the influence of PVP was greater than HPMC. With increase in the concentration of PVP, folding endurance increased relative to HPMC indicating optimum flexibility and good tensile strength offered by PVP. Out of the selected formulations, invitro drug release at 7h were in the order F1>F6>F3>F4>F2>F5>F7>F9>F8. The above results are in good agreement with DOE.
Conclusion
Thus developing a transdermal system of papain is more selective for site-specific analgesic avoiding gastrointestinal incompatibility.
Acknowledgement
The authors acknowledge the management of RBVRR Women’s college of Pharmacy for providing all the facilities for the study.
Funding Sources
The author(s) received no financial support for the research, authorship, and/or publication of this article.
Conflict of Interest
The authors do not have any conflict of interest.
Data Availability Statement
This statement does not apply to this article.
Ethics Statement
This research did not involve human participants, animal subjects, or any material that requires ethical approval.
Informed Consent Statement
This study did not involve human participants, and therefore, informed consent was not required.
Clinical Trial Registration
This research does not involve any clinical trials.
Permission to reproduce material from other sources
Not Applicable
Authors contribution
Mellacheruvu Punyavathi Kusuma: Resources, Supervision
Vedha Sree: Conceptualization, Methodology, Writing – Original Draft
Sumakanth: Project administration
Aparna Peri: Final review and drafting
References
- Lima CSA, Varca JPRO, Nogueira KM et al.,. Semi-Solid Pharmaceutical Formulations for the Delivery of Papain Nanoparticles. Pharmaceutics.2020,12(12),1170, https://doi.org/3390/pharmaceutics12121170
CrossRef - Santi TD, Wound healing activity of transdermal patches of Carica papaya, Chromolaena odorata and Averrhoa bilimbi leaf extracts. TIS Journal/Walailak Univ Sci Tech Inst. 2023 10.48048/tis.2023.6944.
CrossRef - Kim H-M, Kang Y-M, Lee M, An H-J. Papain Suppresses Atopic Skin Inflammation through Anti-Inflammatory Activities Using In Vitro and In Vivo Models. Antioxidants. 2024;13(8):928.10.3390/antiox13080928
CrossRef - Suneetha Cherukuri, Uma Rajeswari Batchu,Kiranmai Mandava et al., Formulation and evaluation of transdermal drug delivery of topiramate. Int J Pharm Investig. 7(1), 10–17 ,https://doi.org/10.4103/jphi.JPHI_35_16.
CrossRef - Kumar S.S, Behury B and Sachinkumar P. Formulation and Evaluation of Transdermal Patch of Stavudine. Dhaka Univ J Pharm Sci. 2013,12(1),63–69 https://doi.org/10.3329/dujps.v12i1.16302
CrossRef - El-Gendy, Nashwa & Sabry et al., Transdermal delivery of salbutamol sulphate: Formulation and evaluation.Dev.Technol. 2009,14. 216-25. doi:10.1080/10837450802572383
CrossRef - Liu C, Fang L. Drug in Adhesive Patch of Zolmitriptan: Formulation and In vitro / In vivo Correlation. AAPS Pharm Sci Tech. 2015,16(6),1245–53.doi:1208/s12249-015-0303-3
CrossRef - Costa P, Lobo JMS. Modeling and comparison of dissolution profiles. Eur J Pharm Sci. 2001;13(2):123–33.doi: 10.1016/S0928-0987(01)00095-1.
CrossRef - Singh A, Bali A. Formulation and characterization of transdermal patches for controlled delivery of duloxetine hydrochloride. J Anal Sci Technol. 2016;7:25. DOI: 10.1186/s40543-016-0105-6
CrossRef - Dhiren S. & Chainesh S. Microsponges: A Revolutionary Path Breaking Modified Drug Delivery of Topical Drugs. Int J Pharm Res. 2014;6(2):1–13.
- Bharkatiya M. Development and characterization of transdermal patches of metoprolol tartrate. Asian J Pharm Clin Res. 2010;3(2):130–134.
- Patel B, Shah C. Fabrication and in-vitro characterization of transdermal matrix patch of Ketoprofen for transdermal therapeutic system. Indo Am J Pharm Sci. 2016;3(9):960–73.
- Supriya, Ch. Sivareddy, M. Basaveswarao et al. Anti-bacterial, anti-fungal and analgesic activity of papain conjugated quercetin. EJPBS. 2017;4(4):280–285.
- ICH Harmonized Tripartite Guidelines, Stability Testing of New Drug Substances and Products. ICH Committee 2003; 8
Accepted on: 08-12-2025
Second Review by: Dr. Shahin Vahora
Final Approval by: Dr. Eugene A. Silow


![]()
![]()
