

Manuscript accepted on : 10 May 2012
Published online on: --
Correlation Analysis of Irrigation Water Quality Data in Huraimla governorate, Saudi Arabia
Mohammed A. Al-Sulaiman
Community College, Huraimla, Shaqra University, P.O. Box 300, Huraimla 119 62, Saudi Arabia.
ABSTRACT: Water used for irrigation can vary greatly in quality depending upon type and quantity of dissolved salts. Irrigation water samples from different farms located in north, south, west and east of Huraimla, Saudi Arabia have been analyzed. Source of all samples is ground water. The present study attempts to bring an awareness among the framers about the quality of ground water for irrigation purposes. The water quality parameters such as pH, electrical conductivity, TDS, total hardness, nitrate and iron were considered. There are differences among water parameters based on their location. The results are compared with standards of FAO. A systematic correlation and regression study showed significant linear relationship among different pairs of water quality parameters. The usefulness of these linear regression equations in predicting the irrigation water quality is an approach, which can be applied in any other locations.
KEYWORDS: Water quality; TDS; irrigation; correlation; regression; Huraimla; Saudi Arabia
Download this article as:| Copy the following to cite this article: Al-Sulaiman M. A. Correlation Analysis of Irrigation Water Quality Data in Huraimla governorate, Saudi Arabia. Biosci Biotech Res Asia 2012;9(1) |
| Copy the following to cite this URL: Al-Sulaiman M. A. Correlation Analysis of Irrigation Water Quality Data in Huraimla governorate, Saudi Arabia. Biosci Biotech Res Asia 2012;9(1). Available from: https://www.biotech-asia.org/?p=9465 |
Introduction
To evaluate the suitability of a water supply for irrigation, information is required on quality and quantity (George, 2004). Evaluation of water quality depends on its specific use. The water quality evaluation in an area is carried out to determine their suitability for agricultural purposes. The suitability of ground water for irrigation is contingent on the effects on the mineral constituents of the water on both the plant and the soil.
For evaluating the suitability of ground water for different purposes, understanding the chemical composition of ground water is necessary (Khodapanah et al.,2009). However, in agriculture, water quality is related to its effects on soils, crops and management necessary to compensate problems linked to water quality (Kirda, 1997). Moreover, in arid and semi arid areas, irrigation is very essential for successful agriculture. Quality of irrigation water is an important factor of crop production (Patel et al., 2010). Also, water quality assessment is an important activity in agricultural water management. The ionic composition of water has significant influence on plant growth. Irrigation with water of insufficient quality might retard plant growth and may contaminate soil, rendering it less suitable for agriculture because of its salinity (Tutmez et al.,2006). Quality of water is of immense importance because poor quality of both surface and ground water is not only a limiting factor in crop production but also its constant and indiscriminate use cause secondary salinization (Pervaiz et al.,2003).
Al-Omran et al. (2005) investigated the ground water quality in Riyadh region. Water samples from 200 wells were collected around Riyadh region. EC, pH and TDS were determined, and based on the values of EC these well waters were divided in four groups. The nitrate ranged from 0-2.55 ppm.
Joshi et al. (2009) reported that to analyze the water quality of river Ganga in Haridwar district for irrigation purpose, the study area has been divided into three seasons: winter (November-February), summer (March to June) and rainy (July to October). Water samples were collected from 5 sampling stations The results indicated that river water in rainy season is not suitable for irrigation purpose because of high values of total dissolved salts.
Al-Omran (1987) reported that in arid areas as Saudi Arabia where irrigation water (ground water) are commonly medium to saline .
Al-Darby et al. (1993) illustrated that, it is important to consider the interactive effects of water quality on the selection and management of the soil gel-conditioners to be used.
Al-Omran (no date) reported that water research studies in Saudi Arabia clearly showed sever depletion of groundwater and deterioration of ground water quality in certain area of the country, where salinity became a major problem in old agricultural oasis. Therefore, the scientifically applied research program related to water saving, conservation and salinity in agriculture is essential, where agricultural activities account for more than 85% of the total water consumed.
Hussain and Alshammary (2008) reported that there is effect of water salinity on the survival and growth of landscape trees and soil properties.
Saeed et al. (2001) reported that quality of irrigation water is of particular interest as the use of low quality water for irrigation purposes may result in reduction of crop yields. The Saudi agriculture depends mainly on groundwater supply for irrigation. The suitability of groundwater for agricultural purposes is contingent to the presence of dissolved constituents in water. The presence of salts may harm plant growth physically by limiting the uptake of water through modification of osmotic processes, or chemically by metabolic reactions such as those caused by toxic constituents..
The concentrations of dissolved ions in ground water are governed by lithology, ground water flow, nature of geochemical reactions, residence time, solubility of salts, and human activities (Nisi et al. 2008). Moreover, the ground water quality is mostly affected by either natural geochemical processes such as mineral weathering, dissolution/precipitation reactions, ion exchange, or various manmade activities such as agriculture, sewage disposal, mining and industrial wastes, etc. The surface runoff from the agricultural field is one of the main sources for nutrients and salinity in the groundwater (Stites and Kraft 2001).
Mirabbasi et al. (2008) reported that sutibality of water for various uses dependes upin on type and concentration of dissolvied minerals. Ground water has more minerals concentration in comparesion with surface water. All ground water contiens minearls carried from the ground earth. Type and concentration of minerals depend on the environment, movement and source of the ground water. The degree and type of mineralization of groundwter determines its sutiability for municipal, industrial, irrigation and other uses. In general, standared of water quality have been established for almost every water use. Several crteriea for water quality requirements had been developed through the years, which serve as guidelines in determining the suitability of water for various uses
Gupta et al. (2009) reported that the quality of ground water depends on various chemical constituents and their concentration, which are mostly derived from the geological data of the particular region.
Khanfar (2008) reported that ground water is very important as the only source of water to supply human needs especially in arid regions like Saudi Arabia where there is scarce surface water and the rainfall is scarce, irregular and the evaporation rates are very high. Hence, the groundwater is a key resource for urban and rural supplies and it is considered as the only source, which can supply domestic and agricultural needs in town and villages.
Al-Omran et al. (2010) showed that low quality water for irrigation can impose a major environmental constraint to crop productivity.
In Saudi Arabia, saline water is one of the most frequent environmental stresses that face growing plants. This because groundwater represents more than 90% of water used in agricultural irrigation and it classified as very saline water (Falatah et al., 1999). They found that the salinity (EC) of groundwater from 400 samples represent eight agricultural regions of Saudi Arabia ranged between 0.2 and 29.3 dS/m. Recently, Al-Matroud (2003) reported that salinity of groundwater from Riyadh Region (Central part of Saudi Arabia) has electrical conductivities (EC) ranged between 1.34 and 7.84 dS/ m and dominated by sodium chloride cations.
In Saudi Arabia, the quality of water is currently receiving some attention from environmentalist and water scientists (Abdel Majed, 1997; Al- Redhaiman and Abdel Majed, 2002; Al-Turki and Abdel Majed, 2003; Al-Abdula’aly, 1997; Al-Abdul’aly et al., 2003 ; Sharaf and Hussein,1996; Al-Zarah, 2008; Al-Turki,2009; Al-Hawas, 2002; Abdel-Aal et al.,1997).
The quality of water for irrigation is determined by its chemical composition and the condition of use. Many researchers have evaluated water quality in different regions of Saudi Arabia such as (Bazuhair and Alkaff,1989; Faruq et al., 1996; Mee,1993).
Chemical analysis were conducted on ground water samples collected from 18 wells in Buraydah in 1986 by Abdelmonem et al. (1990). They reported that the total salinity ranged between 521-1664 ppm which is high salinity for water use.
Chemical analysis for water samples collected from 72 wells of Jilh area, northern Saudi Arabia was achieved by Saeed et al. (2001). Their results of the analysis indicated that 7% of the wells had permissible water quality for agriculture without any hazard.
Alaa-el-Din et al. (1994) studied the quality of 4255 well samples during 1984-1989 in Saudi Arabia. Nitrate levels of >45 ppm were observed in 8% of the well samples in 1989.
Allael-Din et al. (1993) investigated the quality of water from 388 wells in 6 regions in Saudi Arabia with respect to pH, total dissolved salts (TDS), nitrite, ammonium, nitrate, and faecal coliforms. Concentration of TDS varied widely, from 180 to 9350 ppm, with a mean of 754 ppm. Of the 388 wells, 72 (18.6%) were above the WHO limit of 1000 ppm. The levels of nitrate varied significantly, ranging from 0.0 to 95.2 ppm, with an average value of 20.7 ppm. About 7.7% of the tested wells had nitrate content above the WHO limit of 45 ppm.
Water quality is one of the main characteristics in the planning stages. Water quality has to be simulated and predicted. If predicted quality is not satisfying, some changes or precaution measures must be implemented (Misaghi and Mohammadi,2003). The main aim of this study is to evaluate the possibility that a smaller group of water quality parameters/locations may provide sufficient information for water quality assessment. A systematic correlation and regression study among different pairs of water quality parameters will be studied. The usefulness of these linear regression equations in predicting the irrigation water quality is an approach, which can be applied in any other locations.
Materials and Merhods
Samples of irrigation water from nine different farms in Huraimla Governorate during winter season of 2011 are collected. The farms are located in north, south, east and west of Huraimla. The map of the studied area is depicted in Figure (1). While, characteristics of Huraimla Governorate, Saudi Arabia are shown in Table (1).
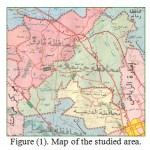 |
Figure 1: Map of the studied area.
|
In this study, routine drinking water quality analysis was applied according to standards by the local laboratory in studied area, which belongs to Ministry of Water. The linear regression approach has applied to develop a relationship between total dissolved solids for different water quality variables. For this purpose, regression equations were computed taking different water quality constituents as dependent variable and total dissolved solids as independent variable. A typical linear regression model is used by the expression of
Y = a + b X………………………………………(1)
Where Y is dependent variable, X is independent variable and a , b are regression coefficients. Excel spreadsheet is used in the analysis.
Figure (1). Map of the studied area.
http://www.riyadh.gov.sa/RiyadhPlaceProvinces.asp?Prov=17
Table 1: Characteristic of Huraimla Governorate, Saudi Arabia
| Latitude** | 25° 08’ N | |
| Longitude** | 46° 08’ E | |
| Altitude | Approximately 800 m above sea level | |
| Area** | 1480 square km | |
| Climate* | Rainfall | Annual rainfall of 84.4 mm. |
| Humidity | The rate of humidity is33.1%. | |
| Temperature | The rate of temperature is 25 °C. | |
| Population** | 12569 (2004 census) | |
* http://www.imaratarriyadh.gov.sa/mentaqa_ruh.htm
**http://ar.wikipedia.org/
Results and Discussion
In the studied area, water used for irrigation purposes is mainly irrigated date palm trees. However, due to limited analysis, the results also are limited but they focused on total dissolved solids, which is considered a main criterion for assessment suitability of irrigation water in this study.
Total dissolved salts (TDS)
The dissolved or soluble fraction of the water’s total solids load is referred to as total dissolved solids, known as TDS, normally the weight of this material. The electrical conductivity provides a simple measure of TDS and is the measure of the water’s ability to conduct an electric conductivity (Memon et al.,2008). Water used for irrigation can vary greatly in quality depending upon type and quantity of dissolved salts (Jothivenkatachalam et al.,2010). Table (2) illustrates limitations of electric conductivity for water according to different resources. However, the following equation is used to determine the electric conductivity of water in the studied area (Al-Omran et al.,2005).
TDS ( ppm)= EC(dS/m) ×875.8−302.3……………………………………(2)
Table 2: Limitations of irrigation water electric conductivity according to FAO (Ayers and Westcot,1994).
| Class | Rang (dS/m) |
| Excellent | <0.7 |
| Good | 0.7-3.0 |
| Unsuitable | >3.0 |
Salts are present in irrigation water in relatively high. They originate from dissolution or weathering of the soil, including dissolution of lime, gypsum and other slowly dissolved soil minerals (Jothivenkatachalam et al.,2010). These salts are carried with the water to wherever it is used. In the case of irrigation, the salts are applied with the water and remain behind in the soil as water evaporates or is used by the crop. A salinity problem exists if salt accumulates in the crop root zone to a concentration that causes a loss in yield. Yield reductions occur when the salts accumulate in the root zone to such an extent that the crop is no longer able to extract sufficient water from the salty soil solution, resulting in a water stress for a significant period of time. If water uptake is appreciably reduced, the plant slows its rate of growth (Jothivenkatachalam et al.,2010). Water with TDS less than 450mg/l is considered good and that with greater than 2000 mg/l (ppm) is unsuitable for irrigation purpose (Jothivenkatachalam et al.,2010).
Figure (2 ) illustrates variation of TDS with sample location. However, in north location , the mean of TDS is 1414.3 ppm, in South location, the mean of TDS is 1566 ppm, in West location, the mean of TDS is 1404 and in East location, the mean of TDS is 1522. Generally, the values of TDS in different locations are converged. In the present study all samples TDS are less than 2000 ppm. Also, according to FAO classes, the irrigation water in studied area is good as illustrated in Figure (3). The analyzed water samples viz., mean, standard deviation and coefficient of variation have been presented in Table (3). The coefficient of variation observed for TDS value in the present study is found to be 38.9%, which is very high.
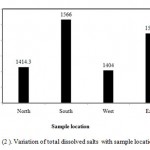 |
Figure 2: Variation of total dissolved salts with sample location.
|
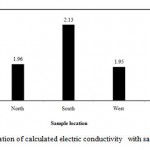 |
Figure 3: Variation of calculated electric conductivity with sample location.
|
Table 3: Statistical analysis of irrigation ground water samples.
| Parameter | Mean | Maximum | Minimum | Standard deviation | Coefficient of variation (%) |
| pH | 7.6 | 7.99 | 7.10 | 0.4 | 4.7 |
| TDS (ppm) | 1477.9 | 2225.0 | 778.0 | 574.7 | 38.9 |
| Total hardness (ppm) | 740.0 | 1010.0 | 340.0 | 274.1 | 37.0 |
| Nitrate (ppm) | 30.1 | 55.0 | 6.0 | 18.3 | 60.7 |
| Iron (ppm) | 0.4 | 2.21 | 0.05 | 0.8 | 213.9 |
pH
The pH value of water is an important index of acidity or alkalinity. A number of minerals and organic matter interact with one another to give the resultant pH value of the sample (Jothivenkatachalam et al.,2010). In the present study, pH ranges from 7.10-7.99, which lies in the range prescribed by Saudi Standard. If pH value are higher than the permissible limit , this will affect adversely alkalinity of soils , microbial life and corrosion (Shaikh and Mandre,2009). The coefficient of variation observed for pH value is found to be 4.7% (Table 3). It shows that variation in this parameter among its measured values at different locations is not high and variation is very narrow. However, Figure (4) illustrates variation of pH with sample location. There is no remarkable variation of pH is found with reference to location. In north location , the mean of pH is 7.25, in South location, the mean of pH is 7.87 in West location, the mean of pH is 7.91 and in East location, the mean of pH is 7.62. However, Al-Salamah and Nassar (2009) reported that for Saq aquifer, Qassim Region, Saudi Arabia, the pH in all water samples ranged from 6.77 to 7.28 with a mean of 7.02. Also, Al-Ahmadi (2005a) reported the pH of ground water in some villages in Jeddah city ranges from 6.2 to 7.8 with an average of 7.1 and inspection of these values reveals that all samples lie within the permissible range of 6.5 – 8.5. (WHO, 1993).
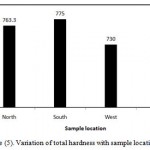 |
Figure 4: Variation of pH with sample location.
|
Total hardness
Water hardness is the traditional measure of the capacity of water to react with soap, hard water requiring considerably more soap to produce lather. Hardness is one of the very important properties of ground water from utility point of view for different purposes (Gupta et al.,2009). In the present study water was very hard and crossed the permissible limits cording to Todd (1980) as listed in Table (4). It is well known that hardness is not caused by a single substance but by a variety of dissolved polyvalent metallic ions, predominantly calcium and magnesium cation, although other cation likes barium, iron, manganese, strontium and zinc also contribute (Gupta et al.,2009). The high concentration of total hardness in water samples may be due to dissolution of polyvalent metallic ions from sedimentary rocks, seepage and run off from soil (Gupta et al.,2009). The total hardness is an important parameter of water quality whether it is to be used for domestic, industrial or agricultural purposes. The total hardness ranges between 340-1010 ppm (Table 3), while Saudi standards permit any value less than 250 ppm. In all samples total hardness exceeds beyond the maximum acceptable limit.
Table 4: Classification of the water samples on the basis of total hardness (Todd,1980).
| Description | Total hardness (ppm) |
| Soft | 0-75 |
| Moderately hard | 75-150 |
| Hard | 150-300 |
| Very hard | Over 300 |
The coefficient of variation observed for total hardness value is found to be 37% (Table 3). It shows that variation in this parameter among its measured values at different locations is high and variation is very high. However, Figure (5) illustrates variation of total hardness with sample location. In north location , the mean of total hardness is 763.3 ppm, in South location, the mean of total hardness is 775 ppm in West location, the mean of total hardness is 730 ppm and in East location, the mean of total hardness is 675 ppm.
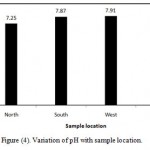 |
Figure 5: Variation of total hardness with sample location.
|
Nitrate
Inorganic fertilizers from agricultural runoff are the main source of nitrate in water supplies but it can occur from natural sources. Vasanthaviga et al. (2010) reported that nitrogen is a plant nutrient that stimulates crop growth, when applied in excess affects the crop by over stimulation of growth, delayed maturity and poor quality of crop yield. In the present study, the nitrate ranges between 6-55 ppm (Table 3), while Saudi standards permit any value less than 50 ppm. In most samples nitrate less beyond the maximum acceptable limit. The coefficient of variation observed for nitrate value is found to be 37% (Table 3). It shows that variation in this parameter among its measured values at different locations is high and variation is very high. However, Figure (5) illustrates variation of nitrate with sample location. In north location , the mean of nitrate is 25 ppm, in South location, the mean of nitrate is 28 ppm in West location, the mean of nitrate is 42 ppm and in East location, the mean of nitrate is 34 ppm.
Iron
Fipps (2003) reported that iron is not toxic to plants in aerated soils, but can contribute to soil acidification and loss of essential phosphorus and molybdenum. In the present study, the iron ranges between 0.05-0.8 ppm (Table 3), while Saudi standards permit any value less than 0.3 ppm. In most samples iron less beyond the maximum acceptable limit. The coefficient of variation observed for iron value is found to be 213.9% (Table 3). It shows that variation in this parameter among its measured values at different locations is high and variation is very high. However, Figure (6) illustrates variation of iron with sample location. In north location , the mean of iron is 0.79 ppm, in South location, the mean of iron is 0.08 ppm in West location, the mean of iron is 0.05 ppm and in East location, the mean of iron is 0.12 ppm.
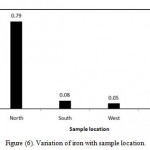 |
Figure 6: Variation of iron with sample location.
|
The correlation matrix for different ground water quality variables is depicted in Table (5). It is evident that distribution of total hardness and nitrate were significantly correlated (r > 0.5) with TDS in the study locations. Highly positive correlation is observed between total hardness and TDS (0.97). Also, highly positive correlation is observed between nitrate and TDS (0.87). Meanwhile, negative correlation is seen between pH and iron (-0.46), positive correlation is seen between pH and TDS (0.43), positive correlation is seen between pH and nitrate (0.44). No correlation is seen between iron and TDS (0.18) and between iron and total hardness (0.31) and between iron and nitrate (0.31).
Table 5: Correlation coefficients among various water quality parameters.
| pH | TDS | Total hardness | Nitrate | Iron | |
| pH | 1 | ||||
| TDS | 0.43 | 1 | |||
| Total hardness | 0.41 | 0.97 | 1 | ||
| Nitrate | 0.44 | 0.87 | 0.86 | 1 | |
| Iron | -0.46 | 0.18 | 0.31 | 0.31 | 1 |
The linear regression analyses have been carried out for the water quality parameters which are found to have better and higher level of significance in their correlation coefficient. The regression equations obtained from the analysis are given in the Table (6). The different dependent characteristics of water quality were calculated using the regression equation and by substituting the values for the independent parameters in the equations. The experimentally estimated and predicted values using the regression equations are given in Table (7) for total hardness using regression equation developed using better correlated parameters values of water samples based on locations. Hence it can be concluded that the correlation studies of the water quality parameters have a great significance in the study of water resources.
Table 6: Linear correlation coefficient and regression equation for some pairs of parameters which have significant value of correlation.
| Pair of parameters | Correlation Coefficient | Regression coefficient | Regression equation | |
| a | b | |||
| Total hardness and TDS | 0.952 | 68.98 | 0.454 | Total hardness=68.98+0.454TDS |
| Nitrate and TDS | 0.876 | -11.05 | 0.027 | Nitrate=-11.05+0.027 TDS |
| Nitrate and Total hardness | 0.866 | 348.7 | 12.98 | Nitrate=348.7+12.98 Total hardness |
| Iron and pH | 0.539 | 8.902 | -1.128 | Iron=8.902-1.128pH |
Table 7: The observed and predicted total hardness (using regression equation developed using better correlated parameters) values of water samples based on locations.
|
Total hardness observed |
Total hardness predicted | |||
| North | South | West | East | |
| 950 | 822.6 | |||
| 930 | 888.5 | |||
| 410 | 422.2 | |||
| 1000 | 1079.1 | |||
| 550 | 480.8 | |||
| 730 | 706.4 | |||
| 1010 | 1045.1 | |||
| 340 | 474.9 | |||
Conclusion
This study aimed in mapping the relations between various water quality parameters using regression analysis. The results from regression analysis provided different empirical equations for total hardness, nitrate and iron. The water quality parameters such as pH, electrical conductivity, TDS, total hardness, nitrate and iron were considered. There are differences among water parameters based on their location. The nitrate ranges between 6-55 ppm, the iron ranges between 0.05-0.8 ppm, the total hardness ranges between 340-1010 ppm. In north location , the mean of TDS is 1414.3 ppm, in South location, the mean of TDS is 1566 ppm, in West location, the mean of TDS is 1404 and in East location, the mean of TDS is 1522. Generally, the values of TDS in different locations are converged.
Acknowledgment
Author wishes to thank the Water Branch (Ministry of Electricity and Water, Saudi Arabia) in Huraimla for achieving the chemical analysis of water samples in its laboratory to carry this study .
References
- Abdel Magid, H.M. (1997). Assessment of drinking water quality in AI-Qassim Region of Saudi Arabia. Environ Intema., 23 (2):247-251.
- Abdel-Aal, S.I., R.K. Rabie and H.M. Abdel Magid (1997). Evaluation of groundwater quality for irrigation in Central Saudi Arabia. Arab Gulf. Sci. Res., 15: 361-377.
- Abdelmonem, A.E., M.A. El-Meleigi and A.A. Al-Rokaibah (1990). Chemical characteristics and bacterial contamination of ground water in Buraydah, Saudi Arabia. J. King Saud Univ.,2:279-290.
- Al-Abdula’aly, A.I. (1997). Fluoride content in drinking water supplies of Riyadh, Saudi Arabia. Environmental Monitoring and Assessment, 48:261-272.
- Al-Abdula’aly, A.I., Al-Rehali, A. AI-Zara’a and M. Khan (2003). Study of nitrate in drinking water sources in Riyadh, AI-Qassim and Hail areas. Presented in the 6th Gulf Conference for water insynchronization with the 2nd Seminar on the rationalization of water use in Saudi Arabia. Organized by Ministry of water, water Science and technology Society, Secretarial General of G.C.C during 5-9 Muharam 1424 H (8-12 March 2003G) Riyadh, Kingdom of Saudi Arabia. PP. 259-266 (in Arabic with an English abstract).
- Al-Ahmadi, M. E. (2005a). Groundwater quality in some villages northeast of Jeddah city, Saudi Arabia. Ninth International Water Technology Conference, IWTC9 2005, Sharm El-Sheikh, Egypt:387-394.
- Al-Ahmadi, M. E. (2005b). Groundwater investigation in Hadat Ash Sham area, Western Saudi Arabia. Journal of Environmental Science, 29:21:36.
- Al-Amoud, A. I., M. A. Bacha and A. M. Al-Darby (2000). Seasonal water use of date palms in the central region of Saudi Arabia. Agricultural Engineering Journal. 9(2): 51-62.
- Al-Darby, A.M., A.M. Al-Omran and A.A. Shalaby (1993). Influence of water quality on water absorption capacity of soil gel-conditioners. J. King Saud Univ., Vol. 5, Agri.Sci. (1):111-117.
- Al-Hawas, I. A. (2002). Irrigation water quality evaluation of Al_Hassa springs and its predictive effects on soil properties. Pakistan Journal of Biological Siences, 5(6):651-655.
- Allael-Din, M,N., I.M. Madany, A. Al-Tayaran, A. H. Al-Jubair and A. Gomaa (1994). Trends in quality of some wells in Saudi Arabia,1984-1989. Sci. Total Environ,143:173-181.
- Allael-Din, M,N., I.M. Madany, A. Al-Tayaran, A. H. Al-Jubair and A. Gomaa (1993). Quality of water from some wells in Saudi Arabia. Water, Air and Soil Pollution,66(1):135-143.
- Al-Matroud S. S. 2003. Evaluation of Irrigation Water Quality and its Effect on Soil Infiltration Rate in Riyadh Region. MSc. thesis. College of Agriculture, King Saud University, Saudi Arabia.
- Al-Omran, A. (no date). Effect of saline water and drip irrigation on tomato yield in sandy calcareous soils amended with natural conditioners. 2nd International Salinity Forum Salinity, water and society–global issues, local action:1-3
- Al-Omran, A.M. (1987). Evaluation of some irrigation water in central of Saudi Arabia. J, Coll. of Agric., King Saud Univ., 9 No 2:363-369.
- Al-Omran, A.M., A.M. Falatah. and S.S. Al-Matrood (2005). Evaluation of irrigation well water quality in Riyadh region, Saudi Arabia. Journal of King Abdulaziz Univ. 16(2):23-40.
- Al-Omran,A. M., A. R. Al-Harbi, M. A. Wahb-Allah, M. Nadeem, and A. Al-Eter (2010).Impact of irrigation water quality, irrigation systems, irrigation rates and soil amendments on tomato production in sandy calcareous soil. Turk J Agric For 34 (2010) 59-73.
- Al-Redhaiman, K.N. and H. M. Abdel Magid (2002). The applicability of the local and international water quality guidelines to Al-Gassim region of central Saudi Arabia. Water, Air and Soil Pollution,137:235-246.
- Al-Salamah, I.S. and I.N. Nassar (2009). Trends in drinking water quality for some wells in Qassim, Saudi Arabia, 1997-2009. J. Applied Sci., 9: 3555-3561.
- Al-Turki, A. I. (2009). Evaluation of well water quality in Hael region of central of Saudi Arabia. Thirteenth International Water Technology Conference, IWTC 13 2009, Hurghada, Egypt .
- Al-Turki, A.I. and H. M Abdel Magid (2003). Nitrate content of drinking and irrigation water in AI-Qassim Region – central Saudi Arabia. Mansura. J. Agric. Sci. 11(27): 7943-7950.
- Al-Zarah, A.I. (2008). Chemistry of ground water of Al-Ahsa Oasis Eastern region Saudi Arabia and its predictive effects on soil properties. Pakistan Journal of Biological Sciences, 11 (3):332-341.
- Ayers, R.S. and D.W. Westcot (1994). Water quality for agriculture. FAO Irrigation and Drainage paper 29 (Rev.).
- Bazuhair, A.S. and A. Alkaff (1989). Evaluation of ground water quality in Wadi Al-Yamaniyah Saudi Arabia. Arab Gulf J. Sci. Res.,7:21-38.
- Domenico, P.A. (1972). Concepts and models in groundwater hydrology. McGraw-Hill, New York
- Falatah, A.M. A.M. Al-Omran, M.S. Nadeem and M.M. Mursi (1999). Chemical composition of irrigation ground water used in some agricultural regions of Saudi Arabia. Emirates Journal for Agricultural Sciences. 11: 1-23. In Arabic. .
- Faruq, I. M., M. jahangir and A.S. Al-Shareef (1996). Chemical charactersitics of Saudi ground water, Al-Qassim. Biol. Sci. (Saudi Biol. Soc. J.), 4:123-140.
- Fipps, G. (2003). irrigation Water Quality Standards and Salinity Management. Texas Cooperative Extension, The Texas A&M University System. B-1667 4-03 10M, Reprint.
- George, P.R (2004). Agricultural Water Quality Criteria Irrigation Aspects. Resource Management Technical Report No.30 Department of Agriculture Western Australia 2004.
- Gupta, D. P., D.P. Sunita and J. P. Saharan (2009). Physiochemical Analysis of Ground Water of Selected Area of Kaithal City (Haryana) India. Researcher, 1(2):1-5.
- Hussain, G. and S. F. Alshammary (2008). Effect of water salinity on survival and growth of landscape trees in Saudi Arabia. Arid Land Research and Management, 22 (4):320 – 333.
- Hussein, M.T. (2004). Hydrochemical evaluation of groundwater in the Blue Nile Basin, eastern Sudan, using conventional and multivariate techniques. Hydrogeol J 12:144–158.
- Joshi, D. M., A. Kumar and N. Agrawal (2009). Assessment of the irrigation water quality of river Ganga in Haridwar district. RASAYAN J. Chem., 2(2):285-292.
- Jothivenkatachalam, K. , A. Nithya and S. C. Mohan (2010). Correlation analysis of drinking water quality in and around Perur block of Coimbatore district, Tamil Nadu, India. RASAYAN J. Chem.,3 (4): 649-654.
- Khanfar, A.R. (2008). Groundwater Investigation in Bel-Ahmar, Assir, Kingdom of Saudi Arabia. Saudi Journal of Biological Sciences, 15 (2):289-296.
- Khodapanah, L. , W.N.A. Sulaiman and N. Khodapanah (2009). Groundwater Quality Assessment for Different Purposes in Eshtehard District, Tehran, Iran. European Journal of Scientific Research, 36(4):543-553.
- Kirda, C.(1997). Assessment of irrigation water quality. Options Méditerranéennes, Sér. A /n031, 1997 Séminaires Méditerranéens.
- Mee, J.M. (1983). Saudi ground water chemistiry and significance. Arab Gulf J. Sci. Res.,1:113-120.
- Memon, N.. A., M.A. Unar, A.K. Ansari, G.B.Khaskheli and B. A. Memon (2008). Prediction of parametric value of drinking water of Hyderabad city by artificial neural network modeling. WSEAS TRANSACTIONS on ENVIRONMENT and DEVELOPMENT, 4(8):707-716.
- Mirabbasi, R., S.M. Mazloumzadeh and M.B. Rahnama (2008). Evaluation of irrigation water quality using fuzzy logic. Research Journal of Environmental Sciences, 2(5):340-352.
- Misaghi, F. and K. Mohammadi (2003). estimating water quality changes in the Zayandeh_Rud river using artificial neural network model. Paper No. 03-115, CSAE/SCGR 2003 Meeting Montréal, Québec July 6 – 9.
- Nisi, B., A. Buccianti, O. Vaselli, G. Perini, F. Tassi and A. Minissale (2008). Hydrogeochemistry and strontium isotopes in the Arno River Basin (Tuscany, Italy): constraints on natural controls by statistical modeling. J Hydrol 360:166–183.
- Patel, K.C., K.B. Vyas and M.V. Hathi (2010). Studies on quality of irrigation water of Satalasana Taluka of Mehsana district. International Journal of Chemistry, 1 (1):52-56.
- Pervaiz, Z., S.S. H. Kazmi and K.H. Gill (2003). Characterization of irrigation quality of ground water in Mandi Baha-ud-Din district. Asian Journal of Plant Sciences, 2(7):523-525.
- Saeed, M. M., M. Ashraf and M. Iqbal (2001). Assessment of regional groundwater quality for irrigation: A case study of Jilh aquifer in Saudi Arabia. Journal of Drainage and Water Management, 5(2):9-18.
- Schuh, W.M., D. L. Klinekebiel, J. C. Gardner and R. F. Meyar (1997). Tracer and nitrate movements to groundwater in the Norruem Great Plains. J Environ Qual 26:1335–1347.
- Shaikh, A.M. and P.N. Mandre (2009). seasonal study of physico-chemical parameters of drinking water in Khed (Lote) industrial area. International Research Journal, II(7):169-171.
- Sharaf, M. A. and M. T. Hussein (1996). Ground water quality in the Saq aquifer , Saudi Arabia. Hydro. Sci. J., 41:683-696.
- Stites, W. and G. J. Kraft (2001). Nitrate and chloride loading to groundwater from an irrigated North-Central U.S. Sand-plain vegetable field. J Environ Qual 30:1176–1184.
- Todd, D.K. (1980). Groundwater Hydrology. 2nd Ed., John Willey & Sons Inc., U.S.A., pp. 535, 1980.
- Tutmez, B., Z. Hatipoglu and U. Kaymak (2006). Modeling electrical conductivity of groundwater using an adaptive neuro-fuzzy inference system. Computers & Geosciences, 32:421–433.
- Vasanthaviga, M., K. Srinivasamoorthy, R. R. Ganthi, K. Vijayaraghavan and V. S. Sarma (2010). Characterization and quality assessment of groundwater with a special emphasis on irrigation utility: Thirumanimuttar sub-basin, Tamil Nadu, India. Arab J Geosci DOI 10.1007/s12517-010-0190-6.
- WHO (World Health Organization) (1993) .World Health organization ., Guidelines for drinking water quality, Recommendations. 2nd Edition. Geneva, Vol. 1, (1993).

This work is licensed under a Creative Commons Attribution 4.0 International License.


