

Manuscript accepted on : 21 November 2011
Published online on: --
S. A. Mirbagheri, M. Abbaspour, A. H. Javid, A. H. Hasani and S. Kardar
Department of Environment and Energy, Science and Research Branch, Islamic Azad University, Tehran Iran.
Corresponding Author E-mail: Kardar1976@yahoo.com
ABSTRACT:
Today, discharging the wastewaters into the river is the main factor of water pollution and associated with environmental impacts. There are several methods for wastewater treatment. The natural ways like wastewater stabilization pond (WSP) is apply in a lot of countries especially in under developed countries because no needed to high technology.The WSP’s are suitable for wastewater treatment in small societies and some special industries like slaughterhouse, dairy products and meat products and etc. The advantages of this way are high efficiency in treatment of pathogens, toxic and organic materials.These ponds treat the wastewater naturally by alga and bacterial reactions. Ecological condition and wastewater properties affect the efficiency of WSP. Furthermore the efficiency of WSPs depends to several factors like the temperature, light, alga and bacterial reactions and Etc and must be analyzed before construction. In this regard the quality parameters in Tehran WSP simulated with CE-QUAL-W2.The model has been calibrated and evaluated on the basis of collected data from Tehran WSP and the ability of the model analyzed to optimum the efficiency. Furthermore the concentration trend of parameters analyzes during the day in different hours to determine the effects of solar radiation and the others parameters on them. The results shows BOD concentration increase at noon and decrease at night that shows it depends to solar radiation. Alga also is a function of solar radiation and the concentration increase in noon and decrease in afternoon. The trend of phosphate and nitrate is the same and since these two parameters are used for growth process of algae so in noon decrease and in night increased. Because at night the growth process of algae is limited and no need for phosphate and nitrate exist so the concentration increased. The results of modeling with CE-QUAL-W2 show good agreement between the experiments and the simulation data and CE-QUAL-W2 is a suitable model for analyzing the quality parameters in WSP and can be used for design of new stabilization ponds or for improving the effluent quality of existing ponds. @JASEM.
KEYWORDS: Water pollution; Environmental impacts; Wastewater stabilization pond; Tehran
Download this article as:| Copy the following to cite this article: Mirbagheri S. A, Abbaspour M, Javid A. H, Hasani A. H, Kardar S. Simulation of Wastewater Parameters in Stabilization Ponds (Case Study: Tehran Wastewater Stabilization Pond). Biosci Biotech Res Asia 2011;8(2) |
| Copy the following to cite this URL: Mirbagheri S. A, Abbaspour M, Javid A. H, Hasani A. H, Kardar S. Simulation of Wastewater Parameters in Stabilization Ponds (Case Study: Tehran Wastewater Stabilization Pond). Biosci Biotech Res Asia 2011;8(2). Available from: https://www.biotech-asia.org/?p=9428/ |
Introduction
Today, pollution of water resources with wastewater is one of the main environment impacts of the wastewater. The human activities have different effects on environment and to minimum the impacts the new methods and management works needs in all programs (Khodadadi et al. 2005). It is estimated that 1 cubic meter domestic wastewater can pollute about 40 to 60 cubic meter fresh water (Farzad kia et al. 2003). Furthermore the wastewater stabilization ponds can provide satisfactory sewage treatment especially in rural areas (Pirooz et al. 2010). High efficiency in removing the pathogens and organic materials are the advantages of WSP. Furthermore, wastewater treatment points are not very sensitive to shock loading (Mirbagheri et al. 2004). Also the experiments shows numerical methods are a suitable ways to simulate the pollution parameters (Abaspour et al. 1996).
Materials and Methodology
Case Study: The study area is situated in the south of Shahr rey City within Tehran province. The average elevation is 980m in the area (Figure 1).
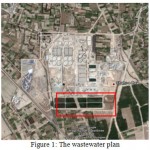 |
Figure 1: The wastewater plan.
|
Meteorological Conditions
The efficiency of wastewater stabilization ponds is in relate with meteorological conditions. The study area situate in semi-arid district with hot summer and cold winter. The maximum temperature is more than 42 C and the minimum temperature is less than 10 C. The mean temperature is 10 C. the relative humidity is about 15% in summer and 75% in winter. The wind direction is from west and southwest to east in whole of the year and the average is 20 Km per hour (TPWW, 1998).
Background on numerical models
CE-QUAL-W2 is a laterally averaged,2-D hydrodynamic and transport model designed for long-term, time-varying water quality simulations of lakes, reservoirs, and estuaries (Cole at al. 1995). Formulations of the fundamental equations, the structure of the computations, and summaries of applications are described in (Buchak et al. 1988and Cole 1994). CE-QUAL-W2 model is based on the assumption that flow and transport phenomena in water body with a distinct flow direction and a regular bathymetry can be computed from the laterally integrated Navier–Stokes equations (Bloss et al . 1988 and Edinger et al. 1978).
CE-QUAL-W2 uses the laterally averaged equations of continuity, momentum and transport. The main formulations involve a vertically varying, longitudinal momentum balance, vertical momentum in the form of the hydrostatic approximation and local continuity, and longitudinal and vertical transport of the different constituents. The continuity equation used in CE-QUAL-W2 is of the form
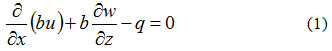
where x and z the horizontal and vertical coordinates, b the width of the water body, u the laterally averaged longitudinal velocity, w the laterally averaged vertical velocity, and q the lateral inflow or outflow per unit area.
In the CE-QUAL-W2 model, variations in width with depth are taken into consideration. Eqs. (2a) and (2b) represent the horizontal momentum equation in the CE-QUAL-W2 model, respectively.
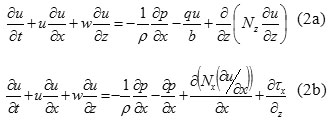
where is the vertical eddy viscosity, p the pressure, the density of water, t the time, the longitudinal momentum dispersion coefficient and (in ) is the shear stress per unit massresulting from the vertical gradient of the horizontal velocity, u The second term on the RHS of Eq. (2b) of CE-QUAL-W2 is the horizontal dispersion of momentum. In the CE-QUAL-W2 model, the effect of stratification on vertical eddy diffusivity is not included. The longitudinal pressure gradient used in model results from the hydrostatic
pressure assumption (vertical momentum equation)
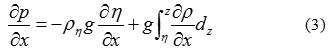
Where g is gravitational acceleration and the free water surface elevation. The transport equation in CE-QUAL-W2 is given by
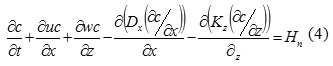
Where is the longitudinal temperature or constituent dispersion coefficient and the source or sink term for the particular constituent. The fourth term in Eq. (4) of the CE-QUAL-W2 model represents the horizontal diffusion term for transport of a constituent. In CE-QUAL-W2, there is an additional equation for free water surface elevation.
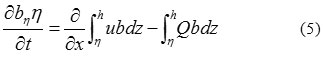
Where is the width, which varies in time and space, h the total water depth and Q the lateral boundary inflow or outflow in . CE-QUAL-W2 model, the relationship used between temperature and water density is:
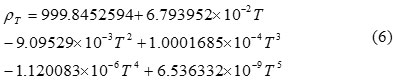
And the effect of salinity on density is given by:
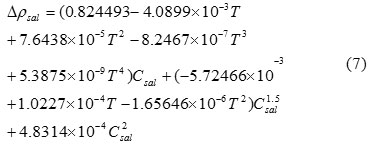
where is the salinity. The density may also be adjusted for the effect of suspended solids
Where is the suspended solids concentration (8 ) and SG the specific gravity of suspended solids, which if taken to be 2.65 yields.
![]()
These formulations are based on equations for effects of latent and evaporative heat exchange and short- and long-wave radiation.
Numerical solution
The CE-QUAL-W2 model uses a space-staggered, finite difference grid, but the CFL criterion has been avoided by the following numerical procedure to solve the unknowns in Eqs. (1), (2b), (3), (4) and (5). At each time step, the numerical procedure is to first compute water surface elevations. With the new surface elevations, horizontal and then vertical velocities are determined so that the new constituent concentrations can be computed. Using the updated horizontal and vertical velocities, the water surface elevation (Eq. (5)) can be solved for simultaneously. The solution for is thus spatially implicit and eliminates the surface gravity wave speed criterion, which can seriously limit time steps in deep water bodies (Cole et al. 1995). A major problem with upwind differencing is the introduction of numerical diffusion where there is longitudinal advection. In many cases, numerical diffusion can overwhelm physical diffusion and produce inaccurate results when strong gradients are present. In the CE-QUAL-W2 model, numerical diffusion has been reduced by implementing QUICKEST, an explicit, third-order accurate horizontal/vertical transport scheme (Fletcher et al. 1991).
Simulation and Modeling
Qualitative analyses of wastewater stabilization ponds with CE-QUAL-W2: Due to analyze and simulate the quality parameters of WSP with CE-QUAL-W2 some parameters include:PH, BOD, TDS, Alga,Nitrate, Organic Nitrogen,Ammonia, Temperature and phosphate measured in 5 sections of the pond in a 15 days period (88/2/1 to 88/2/15) with 4 hours step (4, 10, 14 and 18). The distance between the samples is 28m. The pond divided to 6 layers in vertical. Two layers with o.5m from the surface and four 1m layers. First and last sections and layers take as the boundary condition.
Calibration and validation the model: For calibration and validation the data divided to two groups. 65 percent of data used to calibration and 35 percent to validation.
Calibration of CE-QUAL-W2: In this part at first sensibility analyses have been done and then the simulation data for calibration obtained.The mean of absolute error and performance coefficient compute to determine the accuracy of the model and are shown in table (1).
Table 1: Cp and MAE values in calibration stage
| Coefficient | Cp | MAE |
| Alga | 0.008 | 0.02 |
| BOD | 0.0007 | 0.27 |
| Phosphate | 0.0026 | 0.06 |
| TSS | 0.0003 | 0.33 |
| Organic nitrogen | 0.0083 | 0.03 |
| Nitrate | 0.026 | 0.05 |
| Ammonia | 0.0002 | 0.013 |
The results show that Ammonia, TSS and BOD have the minimum mean-squared error and the best simulation by CE-QUAL-W2 model.
Validation of CE-QUAL-W2
After calibration, the validation of the model has been done with 5 days data (30 percent of data).
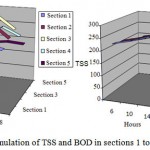 |
Figure 2: simulation of TSS and BOD in sections 1 to 5 at fifteenth day (mg/l).
|
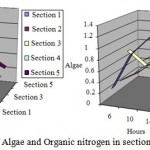 |
Figure 3: simulation of Algae and Organic nitrogen in sections 1 to 5 at fifteenth day (mg/l)
|
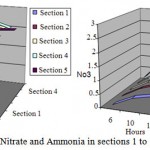 |
Figure 4: simulation of Nitrate and Ammonia in sections 1 to 5 at fifteenth day (mg/l).
|
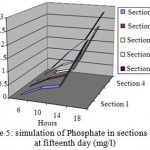 |
Figure 5: simulation of Phosphate in sections 1 to 5 at fifteenth day (mg/l).
|
As it can be seen in the figures BOD concentration increase at noon and decrease at night that shows it depends to solar radiation. Alga also is a function of solar radiation and the concentration increase in noon and decrease in afternoon. The trend of phosphate and nitrate is the same and since these two parameters are used for growth process of algae so in noon decrease and in night increased. Because at night the growth process of algae is limited and no need for phosphate and nitrate exist so the concentration increased.After validation the data, with analytical analysis the mean of absolute error and performance coefficient compute in this stage to determine the accuracy of the model and are shown in table (2).
Table 2: Cp and MAE values after validation stage
| Coefficient | Cp | MAE |
| Alga | 0.025 | 0.04 |
| BOD | 0.0009 | 0.53 |
| Phosphate | 0.0031 | 0.41 |
| TSS | 0.0006 | 0.33 |
| Organic nitrogen | 0.018 | 0.03 |
| Nitrate | 0.001 | 0.03 |
| Ammonia | 0.025 | 0.05 |
| BOD | 0.002 | 0.5 |
The data from validation compared with the field data and the results in the outlet (the fifth section) in 88/2/15 are shown in figures (6) to (9).
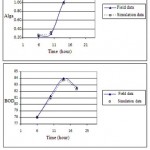 |
Figure 6: simulation and field data of BOD (mg/l)R2=%99 and Alga (mg/l) R2=%94.
|
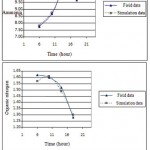 |
Figure 7: simulation and field data of organic nitrogen (mg/l) R2=%98 and Ammonia (mg/l) R2=%99.
|
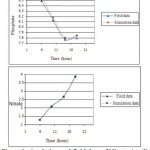 |
Figure 8: simulation and field data of Nitrate (mg/l) R2=%99 and phosphate (mg/l) R2=%96.
|
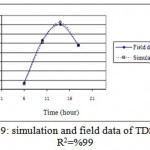 |
Figure 9: simulation and field data of TDS (mg/l) R2=%99.
|
The results show the good capability of the model to simulation the quality parameters of WSPs.
Conclusion: The results of modeling with CE-QUAL-W2 show good agreement between the experiments and the simulation data. The CE-QUAL-W2 is a suitable model for analyzing the quality parameters in WSP and to optimum the efficiency of the operation. It is recommended to simulate the quality parameters in WSP to optimum the efficiency.As it can be seen in the figures BOD concentration increase at noon and decrease at night that shows it depends to solar radiation. Alga also is a function of solar radiation and the concentration increase in noon and decrease in afternoon. The trend of phosphate and nitrate is the same and since these two parameters are used for growth process of algae so in noon decrease and in night increased. Because at night the growth process of algae is limited and no need for phosphate and nitrate exist so the concentration increased.The results of modeling with CE-QUAL-W2 show good agreement between the experiments and the simulation data and CE-QUAL-W2 is a suitable model for analyzing the quality parameters in WSP and can be used for design of new stabilization ponds or for improving the effluent quality of existing ponds.
Acknowledgements
Thanks toTehran Province Water and Wastewater (TPWW) for providing the data of this study.
References
- Abaspour, M.et al (1996), A numerical model to simulate the pollution concentration in a laminar flow with baffle, 4th Conference of Fluid Dynamics.
- Bloss S., Lehfeldt R., Patterson J.C., (1988) Modelling turbulent transport in stratified estuary, J. Hydr. Eng. ASCE 114 (9) ,1115–1133.
- Buchak E.M., Edinger J.E., (1984) Generalized, longitudinal–vertical hydrodynamics and transport: development, programming and applications, Prepared for U.S. army corps of engineers waterways experiment station, Contract No. DACW39-84-M-1636, Vicksburg, MS.
- Cole T.M., (1994) CE-QUAL-W2, Version 2.0, Water Operations Technical Support, Vol. E-94, U.S. army engineer waterways experimental station, Vicksburg, MS.
- Cole T.M., Buchak E.M., (1995) .CE-QUAL-W2: a two-dimensional, laterally averaged, hydrodynamic and water quality model, Version 2.0 User manual, Instruction report EL-95-1, Prepared for U.S. army corps of engineers, Washington, DC, 20314-1000
- Cole T.M., Buchak E.M., (1995) CE-QUAL-W2: a two-dimensional, laterally averaged, hydrodynamic and water quality model, Version 2.0 User manual, Instruction report EL-95-1, Prepared forU.S. army corps of engineers, Washington, DC, 20314-1000.
- Edinger J.E., Buchak E.M., (1978) Reservoir longitudinal and vertical implicit hydrodynamics. In: Proc. Int. Conf. on environmental effects of hydraulic engineering works, American society of civil engineers, Knoxville, TN.
- Farzad kia. M, khosravi. T, (2003) Survey of WSP efficiency in wastewater treatment of slaughterhouses, Yazd Shahid Sadoghi University of medical science, page 61.Iran.
- Fletcher C.A., (1991) Computational Techniques for Fluid Dynamics, Vol. 1, Springer, Berlin.
- Khodadadi. A, Nazari. H, Javadi. S, (2005) Environmental Impact Assessment of Dam using combination Icold and Leopold matrixes,Civil-Environment Department, Institute of Environment, Tarbiat Modaress University., page 112.
- Mirbagheri.S.A., Hashemi Monfared S.A., Moshirvaziri.S, Mirbagheri.S.M, (2004) “Numerical Simulation of Dissolved Oxygen, Alga and Nutrients in Wastewater Stabilization Pond” M.SC theses on Environment engeneering,TarbiatModarres University, Tehran, Iran.
- Pirooz. B, Bgherzade. A, Sabetraftar. O, (2010) Survey of pollution resources impacts on Goharud River in Guilan Province, 8th International River Engineering Conference, Shahid Chamran University, Ahwaz, Iran.
- TPWW , The report of Tehran WSP, tehran province water and wastewater, 1998.

This work is licensed under a Creative Commons Attribution 4.0 International License.


