

Manuscript accepted on : January 08, 2010
Published online on: --
M. S. Mohamed Jaabir1*, Jf. Rosario2, S. Senthil Kumar1, P. Geraldine3
1Dept. of Biotechnology, Jamal Mohamed College (Autonomous), Tiruchirappalli - 620 020, Tamil Nadu, India.
2Dept. of Obstetrics & Gynecology, University of Texas, Health Science Center, San Antonio, Texas-78229-3900, USA.
3Dept. of Animal Science, Bharathidasan University, Tiruchirappalli - 620024, Tamil Nadu, India.
Corresponding Author E-mail:mohamedjaabir@rediffmail.com
ABSTRACT: Intrauterine and early post-natal malnutrition has profound consequences on foetal and post-natal development in both humans and animals. A study was carried out in the experimental mouse model to determine whether maternal micronutrient restriction alters skeletal muscle mitochondrial DNA and predisposes the offspring to insulin resistance in later life. Female weanling mice received a control or a 50% micronutrient restricted diet and mated with control males. Pups born to the dams on the restricted diet were weaned on to the restricted diet till post natal day (PD) 360. At birth, pups from deficient dams had reduced birth weight and crown rump length. There was a decrease in insulin-stimulated uptake in restricted group. Mitochondrial DNA damage and apoptosis in the skeletal muscle cells were also observed in the restricted group, strongly suggesting the molecular mechanisms underpinning long-term programming and onset of adult life disorders.
KEYWORDS: Micronutrient restriction; insulin resistance; mitochondrial DNA Damage; apoptosis; skeletal muscle; adult life disorders
Download this article as:| Copy the following to cite this article: Jaabir M. S. M, Rosario J. Kumar S. S, Geraldine P. Maternal Micronutrient Restriction Alters Skeletal Muscle Mitochondrial DNA Damage Per Se Predisposes the Offspring to Insulin Resistance in Later Life.Biosci Biotechnol Res Asia 2010;7(1). |
| Copy the following to cite this URL: Jaabir M. S. M, Rosario J. Kumar S. S, Geraldine P. Maternal Micronutrient Restriction Alters Skeletal Muscle Mitochondrial DNA Damage Per Se Predisposes the Offspring to Insulin Resistance in Later Life.Biosci Biotechnol Res Asia 2010;7(1).Available from: https://www.biotech-asia.org/?p=9119 |
Introduction
The impact of an inappropriate nutrition in utero on the growth and development of the fetus and its well-being in both the neonatal and adult life is recently being understood than before. Micronutrients such as vitamins and minerals play essential roles in cellular metabolism, maintenance and growth throughout life. Several studies indicate that vitamins A, D, E, C and folate affect insulin sensitivity [1]. Moreover, deficiencies of these vitamins can have profound and often persistent effects on many fetal tissues and organs, even in the absence of any clinical signs of deficiency in the mother. Furthermore, the consequences of vitamin imbalance during fetal development may not be apparent at the time of the nutritional insult, but may manifest during later development [2]. Multiple vitamin deficiencies, particularly during pregnancy and/or PD, are common in the developing world and maternal vitamin deficiencies are associated with low birth weights and increased rates of perinatal mortality and morbidity [3, 4]. Further, in developing countries, the prevalence of low birth weight varies from 13% to 30% [5]. Despite this and the known effects of micronutrients (both vitamins and minerals) per se on insulin synthesis/release/action, the role of maternal micronutrient deficiencies in the etiology of insulin resistance and mitochondrial DNA damage in the offspring has not yet been explored. In the present study, we hypothesized that maternal dietary micronutrient restriction during conception and PD result in mtDNA damage in skeletal muscle per se predisposes the offspring to insulin resistance in later life.
Materials and Methods
All animal experimental procedures were carried out with the approval of the “Institute’s ethical committee on animal experiments” at the Department of Animal Science, Bharathidasan University, Tiruchirappalli, Tamil Nadu, India. Animals were handled as per the laboratory animal welfare guidelines [6].
Animal Maintenance
Female weanling Swiss albino mice weighing between 10-12 grams were used in this experiment. The animals were housed individually in polypropylene cages with wire mesh bottoms and maintained at 22 ± 2 °C, under standard lighting conditions (12-h light: dark cycle). The acclimatized weaning female mice were divided into two groups of ten animals each, with equal mean body weights.
Experimental treatments
For 12 weeks the group of micronutrient restricted (MR) mice were fed on basal diet (AIN-93G) [7], with 50% restriction of vitamin and mineral mixture. The other group of mice served as the pair-fed control (CON) for the MR group. Animals were fed on ad libitum and received deionized water. After 12 weeks of feeding, blood was collected from supra orbital sinus to determine the concentrations of vitamin (A, E and folic acids) and mineral (iron, zinc, copper, magnesium and calcium) status, in addition to the following biochemical parameters: haemoglobin, glucose, insulin, and oral GTT using commercially available kits from Sigma Chemical Co., USA. After assessment of their micronutrient status, the female mice were naturally mated with proven fertile control male over night and vaginal plugs were identified on the following morning and maintained on their respective diets throughout gestation. The above mentioned biochemical parameters were analyzed similarly in the blood drawn from the offspring of the control and MR groups as well on PD 30, 60, 90, 180 and 360.
Litter management
At term, pups born to the dams on the MR diet as well as control group were weaned on the same restricted or control diet respectively. At birth, the body weight, crown rump lengths of neonates were recorded. Within 12 hours of birth, sex of the offspring was determined by examination of external genital morphology. In all groups, a uniform litter size of 8 pups/dam (equal number of male and females) was maintained from PD 3, until weaning on PD 21. Offspring’s born to the dams of control and MR was weaned onto the respective control and MR diets. From weaning, 8 male pups from 4–5 dams of the corresponding group were maintained in each group and they consumed their respective diets and deionized water ad libitum until PD 360. To avoid the possible effects of estrous cycle on glucose / fat metabolism and insulin resistance, only male pups were included in this study.
Hyperinsulinemic-Euglycemic Clamp Analysis
On postnatal day 360 mice were anesthetized by intraperitoneal injection of pentobarbital sodium, after which the left jugular and femoral veins were cannulated for blood sampling and infusion, respectively. Euglycemic-hyperinsulinemic clamp analysis was performed as described elsewhere [8].
Glucose uptake and triacylglycerol content in soleus muscle
Glucose uptake into soleus muscle was measured. Soleus muscle intramuscular triacylglycerol content was determined on freeze-dried samples, which were dissected free of all visible connective tissue and blood [8].
Mitochondrial DNA damage, apoptosis, DNA fragmentation and ATP levels in skeletal muscle cells
Isolated skeletal muscle cell preparation was done from MR and control group on postnatal day 360 [9]. Isolated myotubes from MR and control group were exposed to 10 µM dihydroethidium (DHE, Molecular Probes, Eugene, Oregon) for 10 or 30 min. After treatment, cells were scraped in PBS, sonicated twice and fluorescence was evaluated using a fluorimeter (Photon Technology International, Lawrenceville, NJ, excitation 470 nm, emission 555 nm). Values were expressed per µg of protein.
No Production
Myotubes from the control and MR group were collected and its nitrite production was evaluated in using the Griess reaction [10]. Nitrite values were determined using varying concentrations of sodium nitrite as standards.
Preparation of cellular fractions and western blot analysis
Cytosolic protein fractions were isolated from control and MR group skeletal muscle cells on postnatal day 360. The lysis buffer for isolating total cellular fractions contains 50 mM Tris, pH 7.4, 150 mM NaCl, 1% NP-40, 10% glycerol, and 5 µl/ml of a mixture of protease inhibitors (Sigma). Protein concentrations were determined using the Bio-Rad protein dye micro assay (Bio-Rad, Hercules, CA). SDS-PAGE and transfer of separated proteins to PVDF-membranes were performed followed by the blocking and immunoblotting in 5% nonfat dry milk and Tris buffered saline with 0.1% Tween 20 (TBS-T). TBS-T and TBS were used for washing. Antibodies used were Cytochrome c (PharMingen; San Diego, CA), Actin (Sigma), caspase-3 (Cell Signaling; Beverly, MA) and iNOS (BD Biosciences). Complexes formed were detected with horseradish peroxidase conjugated anti-mouse IgG or anti-rabbit IgG antibodies (Promega, Madison, WI) using appropriate substrates [11].
Assay for mtDNA damage
DNA isolation and quantitative Southern blots were performed from muscle tissues of both MR and control group on postnatal day 360 by using the method described elsewhere. Cells were lysed in 10 mM TRIS-HCI (pH 8.0), 1 mM EDTA (pH 8.0), 0.5% SDS and 0.3 mg/ml proteinase K overnight at 370 C. High molecular weight DNA was extracted with phenol, treated with RNase (to a final concentration of 1 µg/ml), and digested to completion with BamHI (10 units/µg of DNA overnight). Digested samples were precipitated, resuspended in TE buffer, and quantified using a Hoefer TKO 100 mini fluorimeter and TKO standard kit. Samples containing 5 µg of DNA were heated at 70º C for 15 min and cooled at room temperature for 20 min. A sodium hydroxide solution was added to a final concentration of 0.1 N and samples were incubated for 15 min at 37º C. Gel electrophoresis and vacuum transfer were carried out as described previously (23, 27-33). Following prehybridization, membranes were hybridized with a denatured PCR-generated mitochondrial probe [11], washed and autoradiographed. The resultant band images were analyzed using Molecular Analyst (BioRad) software. Break frequency was determined using the Poisson expression (s= -lnPo, where s is the number of breaks per fragment and Po is the fraction of fragments free of breaks) [12]. Break frequency for nuclear DNA fragments was calculated by scanning similar size fragments (about 11 kb) from the ethidium bromide-stained gel photographs.
DNA fragmentation assay
The presence of fragmented nuclear DNA in the cytoplasmic fraction of skeletal muscle cell lysate was assessed by measuring DNA associated with nucleosomal histones using a specific two-site ELISA with an antihistone primary antibody and a secondary anti-DNA antibody (Roche Diagnostics Corporation, Indianapolis, IN, USA). Briefly isolated skeletal muscle cells from MR and control group on PD 360 were washed twice with PBS, and incubated with 0.5 ml of lysis buffer for 20 min at room temperature. After centrifugation to remove nuclei and cellular debris, the supernatants were diluted 1:4 with lysis buffer and 20 µl from each sample were analyzed by ELISA. The intensity of the color which developed was determined by measuring the absorbance at 405 nm, while that at 490 nm was used as a blank. Each condition was assessed in duplicate, and experiments were repeated three times.
ATP level
Skeletal muscle cells were obtained from MR and control group on PD 360 as described earlier. To determine the total cellular ATP level, an ATP bioluminescence assay kit (Roche, Mannheim, Germany) was used. This kit employs a well-established technique, which uses the ATP dependency of the light omitting luciferase catalyzed oxidation of luciferin for the measurement of extremely low concentrations of ATP [13]. The emitted light is linearly related to the ATP concentration and is measured using a luminometer. Values were normalized per µg of protein and shown as a percentage of control.
Results
There was also significant decrease in the plasma concentration of hemoglobin, Copper, Zinc, Iron, Magnesium, Calcium, Selenium, vitamin A, Vitamin E and folic acid in the mother and offspring of restricted group than the control (Table 1). Differences in the concentrations of fasting glucose, fasting insulin, cholesterol, Triglycerides (Table 2), and oral GTT levels in the micronutrient restricted (MR) groups were not significant in the mother (Table 3). The offspring of restricted group had a low birth weight and continued to weigh less until the PD 360 (Fig. 1) when compared to the Control. In addition, there was no significant difference in the fasting glucose, fasting insulin levels till PD 180 among the restricted offspring when compared to the control. However, on PD 360, the offspring of the MR group showed significantly higher fasting glucose and insulin levels than that of the control (Table 4).
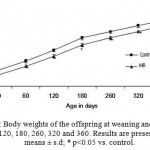 |
Figure 1: Body weights of the offspring at weaning and on PD 20, 60, 120, 180, 260, 320 and 360. Results are presented as means ± s.d; * p<0.05 vs. control.
|
Table 1: Levels of Hemoglobin and Micronutrients in Mother at the end of 12th week.
| Parameter | Control | MR |
| Hemoglobin (g/dl) | 13.9 ± 0.21 | 10.1 ± 0.02*** |
| Vitamin E (µmol/l) | 55 ± 2.9 | 35 ±2.3*** |
| Folic acid (mmol/l) | 453 ± 12 | 403 ± 16*** |
| Vitamin A (µmol/l) | 1.6 ± 0.08 | 1.0 ± 0.11* |
| Copper (µg/ml) | 1.53 ± 0.07 | 0.9 ± 0.04*** |
| Zinc (µg/ml) | 1.64 ± 0.05 | 0.78 ± 0.05*** |
| Iron (mg/ml) | 4.59 ± 0.12 | 3.1 ± 0.09*** |
| Selenium (mmol/l) | 4.0 ± 0.17 | 3.0 ± 0.29*** |
| Magnesium (mg/ml) | 26 ± 0.98 | 17 ± 0.85*** |
| Calcium (mg/ml) | 190 ± 11 | 160 ± 14** |
Values represent mean ± s.d, of 6 mice/group. ***p<0.001, ** p<0.01, * p<0.05 vs. control; by students’s t test.
Table 2: Glucose Homeostasis and lipid profile in mother at the end of 12th week.
| Parameter | Control | MR |
| Fasting glucose (mmol/l) | 4.06 ± 0.28 | 4.37 ± 0.33 |
| Fasting insulin (pmol/l) | 184 ± 22.2 | 175 ± 42.9 |
| Total cholesterol (mmol/l) | 2.43 ± 0.06 | 2.63 ± 0.07 |
| Triglycerides (mmol/l) | 0.50 ± 0.05 | 0.60 ± 0.07 |
Values represent mean ± s.d, of 6 mice/group. ***p<0.001, ** p<0.01, * p<0.05 vs. control; by students’s t test.
Table 3: Oral GTT levels in the restricted group and Control in the mother at the end of 12th Week.
| Control Diet (CD) | Micronutrient Restricted Diet (MR) | |||||
| 0 Min | 60 Min | 120 Min | 0 Min | 60 Min | 120 Min | |
| Plasma Glucose (mg/dl) | 74 ± 6 | 112 ± 4 | 80 ± 4 | 79 ± 6 | 120 ±6 | 86 ± 6 |
| Plasma Insulin (ng/ml) | 1.0 ± 0.06 | 1.3 ± 0.05 | 1.4 ± 0.02 | 1.3 ± 0.05 | 1.4 ± 0.08 | 1.5 ± 0.08 |
Values represent mean ± s.d, of 6 mice/group. ***p<0.001, ** p<0.01, * p<0.05 vs. control; by students’s t test.
Table 4: Glucose homeostasis in restricted and control offpring on PD 180 and 360.
| PD 180 | PD 360 | |||
| Parameters | Group I (CD) | Group II (MR) | Group I (CD) | Group II (MR) |
| Fasting Glucose (mmol/l) | 4.2 ± 0.12 | 4.4 ± 0.08 | 4.6 ± 0.27 | 5.9 ± 0.17** |
| Fasting Insulin (pmol/l) | 590 ± 60 | 623 ± 70* | 620 ± 60 | 753 ± 10*** |
Values represent mean ± s.d, of 6 mice/group. ***p<0.001, ** p<0.01, * p<0.05 vs. control; by students’s t test.
Hyperinsulinemic-Euglycemic Clamp Analysis
The glucose infusion rate and glucose utilization rate were respectively lower by 68% (P<0.001) and 73 % (P<0.001) in MR group than control (Figures 2A and 2B). Hepatic glucose production moderately changed (P<0.05) with micronutrient restriction. However, glucose uptake into skeletal muscle during the clamp (glucose metabolic index) was reduced by 53.5% (P<0.001) in MR group (Figures 2C and 2D). These results suggest the presence of whole-body and muscle insulin resistance in the offspring of MR group.
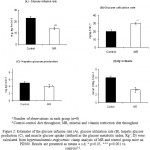 |
Figure 2: Estimates of the glucose infusion rate (A), glucose utilization rate (B), hepatic glucose production (C), and muscle glucose uptake (defined as the glucose metabolic index, Rg’; D) were calculated from hyperinsulinemic-euglycemic clamp analysis of MR and control group mice on PD360. Results are presented as means ± s.d; * p<0.05, *** p<0.001 vs. controls1-2. |
Insulin-Induced 2-Deoxy Glucose Uptake in Isolated Skeletal Muscle
Insulin stimulation increased 2-deoxy glucose uptake into isolated muscle by 1.6 -fold in control (Fig-3) as compared to MR group (P<0.001).
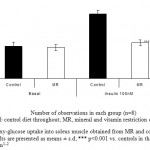 |
Figure 3: 2-deoxy-glucose uptake into soleus muscle obtained from MR and control group mice on PD 360. Results are presented as means ± s.d; *** p<0.001 vs. controls in the presence of 100 nM human insulin1-2.
|
Intramuscular Triacylglycerols
Intramuscular triacylglycerols (Fig.4) in soleus muscle was significantly higher by 1.8 fold (P<0.01) in MR group as compared to control.
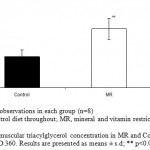 |
Figure 4: Intramuscular triacylglycerol concentration in MR and Control offspring mice on PD 360. Results are presented as means ± s.d; ** p<0.01 vs. control.
|
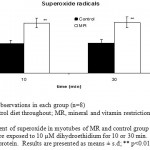 |
Figure 5: Measurement of superoxide in myotubes of MR and control group mice skeletal muscle on PD 360. Cells were exposed to 10 µM dihydroethidium for 10 or 30 min. Values were expressed per µg of protein. Results are presented as means ± s.d; ** p<0.01 vs. control1-2.
|
Levels of ROS, NO and iNOS expression in skeletal muscles
Superoxide and nitric oxide levels in myotubes were significantly higher by 1.7 fold (P <0.01) and 4.2 fold (P <0.001) respectively in MR group as compared to control (Fig 6 and 7). To establish that the increased level of NO was the result of the expression of iNOS, western blot analysis for iNOS was performed in myotubes; iNOS expression was found to be markedly enhanced by 75 percentage (P<0.0010) in MR diet fed group (Fig-8).
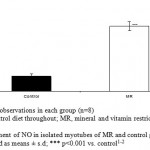 |
Figure 6: Measurement of NO in isolated myotubes of MR and control group on PD 360. Results are presented as means ± s.d; *** p<0.001 vs. control1-2.
|
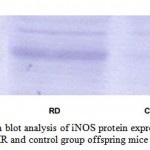 |
Figure 7 :Western blot analysis of iNOS protein expression in skeletal muscle of MR and control group offspring mice on PD 360.
|
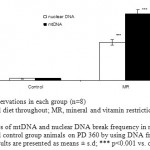 |
Figure 8: Estimates of mtDNA and nuclear DNA break frequency in myotubes derived from MR and control group animals on PD 360 by using DNA fragmentation assay. Results are presented as means ± s.d; *** p<0.001 vs. control1-2.
|
mtDNA, nuclear DNA damage and cellular ATP levels in myotubes
The amount of mtDNA damage was significantly higher by 33 fold (P<0.001) in MR group when compared to control. However, damage to nuclear DNA in similarly sized fragments was approximately 1.6 fold less than that detected in mtDNA (Fig.9). Similarly, MR restriction was found to reduce ATP levels by 1.6 fold (P<0.05) as compared with control (Fig. 10).
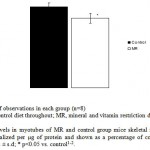 |
Figure 9: ATP levels in myotubes of MR and control group mice skeletal muscle on PD 360 Values were normalized per µg of protein and shown as a percentage of control. Results are presented as means ± s.d; * p<0.05 vs. control1-2.
|
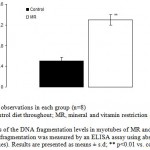 |
Figure 10: Estimates of the DNA fragmentation levels in myotubes of MR and control group mice on PD 360. DNA fragmentation was measured by an ELISA assay using absorbance (OD 405-490 values). Results are presented as means ± s.d; ** p<0.01 vs. control1-2.
|
Apoptosis, caspase-3 cleavage and cytochrome c release from mitochondria
To determine whether micronutrient restriction was associated with an increase of apoptosis in myotubes; apoptosis was evaluated using a DNA fragmentation assay and confirmed by assessing caspase-3 activation. Similarly, to establish that MR restriction mediated apoptosis is induced by a pathway initiated through mitochondria, cytochrome c release into the cytosol was determined by western blot analysis using cytosolic fraction of myotube. Micronutrient restriction increased the DNA fragmentation in myotubes by 2.6 fold (P<0.01) as compared to control (Fig-11). MR restriction was found to activate the caspase-3 and also cause the cytochrome c to release from mitochondria into the cytoplasm. These results indicate that maternal dietary MR restriction mediated the apoptosis that was induced by a pathway initiated through mitochondria (Fig-12).
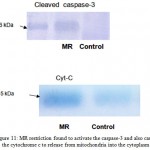 |
Figure 11: MR restriction found to activate the caspase-3 and also cause the cytochrome c to release from mitochondria into the cytoplasm.
|
Discussion
We describe a murine model of intrauterine growth restriction and low birth weight, generated by maternal micronutrient restriction during the preconception and conception period. With this manipulation, birth weight was reduced by 20% in MR offspring. This result demonstrates that fetal growth is highly dependent on the maternal micronutrient supply. We also observed the decrease in insulin stimulated uptake in MR restricted groups. Skeletal muscle is responsible for 85% of whole-body insulin-stimulated glucose disposal and a major component of non esterified fatty acid (NEFA) uptake [14]. Also clinical studies show that skeletal muscle is the principal site for peripheral insulin resistance, with evidence of decreased insulin- stimulated glucose uptake and decreased storage as glycogen [15]. We observed the mitochondrial DNA damage, dysfunction and apoptosis as well as increased NO production in skeletal muscle cells of MR offspring. Endogenously generated peroxynitrite might be the major cause for the mtDNA damage in MR groups [16]. Based on this fact that increased circulating FFA in MR group stimulated iNOS expression and the production of both superoxide and NO in myotubes, we believe that peroxynitrite, the end product of the reaction of NO with superoxide [17], is the oxidant which damaged mtDNA in these cells. We have found that MR restriction induced mtDNA damage and apoptosis via a mitochondrial pathway in myotubes, could be as result of increased circulating FFA levels. These results were consistent with others who have demonstrated that palmitate induced insulin resistance in skeletal muscle using in vivo models [18, 19]. The findings reported here suggest that chronic damage to skeletal muscle mtDNA produced as a result of MR restriction, is probably due to the increase in FFA levels. It acts as a critical contributor to skeletal muscle atrophy likely through the induction of apoptosis. The molecular mechanisms underpinning long-term programming of adult disease are likely to be complex and multifactorial leading to the onset of insulin resistance in the later life.
References
- Anderson R. A., Role of dietary factors: micronutrients, Nutr , 58, S10–S11, (2000).
- Ashworth C. J. and Antipatis C., Micronutrient programming of development throughout Gestation, Reproduction, 122, 527–535, (2001).
- Black R E., Micronutrients in pregnancy, Br J Nutr., 85, S193–S197, (2001).
- Singla P N., Tyagi M., Kumar A., Dash D. and Shankar R., Fetal growth in maternalAnaemia, Journal of Tropical Pediatrics, 43, 89–92, (1997).
- The State of the World’s Children 1998. Oxford and New York: Oxford University Press, 1998.
- Hume C.W., The UFAW Handbook on the Care and Management of Laboratory
- Animals, Churchill Livigstone, Edinburgh, London, (1972).
- Reeves P G., Components of the AIN–93 Diets as improvements in the AIN–76A Diet., J Nutr., 127, 838S–841S, (1997).
- Ogihara T., Asano T., Ando K., Chiba Y., Sekine N. and Sakoda H., Insulin Resistance with enhanced insulin-signaling in high-salt diet-fed rats, Diabetes, 50, 573–583, (2001).
- Mcintyre E. A., Halse R., Yeaman S J. and Walker M., Cultured Muscle Cells from
- Insulin-Resistant Type 2 Diabetes Patients Have Impaired Insulin, but Normal 5-Amino-4-Imidazolecarboxamide Riboside-Stimulated, Glucose Uptake., The Journal of Clinical Endocrinology & Metabolism, 89(7),3440–3448, (2001).
- Green L C., Wagner D A., Goglowski J., Skipper P L., Wishnok J S. and Tannenbaum S R., Analysis of nitrate, nitrite, and [ 15 N] nitrate in biological fluids., Anal Biochem., 126, 131-138, (1988).
- Grishko V., Rachek L., Musiyenko S., LeDoux S P. and Wilson G L., Involvement of mtDNA damage in free fatty acid-induced apoptosis., Free Radic Biol Med., 38, 755-762, (2005).
- Arnaud J., Bellanger J., Bienvenu P., Chappuis P., Favier A. and Galliot M., Recommendations for the assay of serum copper by flame absorption spectrometry., Ann. Biol. Clin., 43, 297–318, (1993).
- Crouch S P., Kozlowski R., Slater K J. and Fletcher J. The use of ATP bioluminescence as a measure of cell proliferation and cytotoxicity., J Immunol Methods, 160, 81-88, (1993).
- Furler S M., Cooney G J., Hegarty B D., Lim-Fraser M Y., Kraegen E W. and Oakes N D., Local factors modulate tissue-specific NEFA utilization: assessment in rats using 3H-(R)-2-bromopalmitate., Diabetes, 49:1427–1433 (2000).
- Shulman G I., Rothman D L., Jue T., Stein P., De Fronzo R A. and Shulman R G.,Quantification of muscle glycogen synthesis in normal subjects and subjects with non-insulin-dependent diabetes by 13C nuclear magnetic resonance spectroscopy., N Engl J Med., 322, 223–228, (1990).
- Druzhyna N M., Musiyenko S I., Wilson G L. and LeDoux S P., Cytokines induce
- Nitric oxide-mediated mtDNA damage and apoptosis in oligodendrocytes. Protective role of targeting 8-oxoguanine glycosylase to mitochondria., J Biol Chem., 280, 21673-21679, (2005).
- Brown G C. and Borutaite V., Nitric oxide inhibition of mitochondrial respiration and its role in cell death., Free Radic Biol Med., 33, 1440-1450, (2002).
- Powell D J., Turban S., Gray A., Hajduch E. and Hundal H S., Intracellular ceramide synthesis and protein kinase Czeta activation play an essential role in palmitate-induced insulin resistance in rat L6 skeletal muscle cells., Biochem J., 382:619-29, (2004).
- Sihna S., Perdomo G., Brown N F. and O’Doherty R M., Fatty acid-induced insulin resistance in L6 myotubes is prevented by inhibition of activation and nuclearlocalization of nuclear factor kappa B., J Biol Chem., 279:41294-41301, (2004).

This work is licensed under a Creative Commons Attribution 4.0 International License.


