

Manuscript accepted on : July 15, 2009
Published online on: 28-12-2009
K. Uma Tejaswi1, P. Janaki Ramayya1, S. A. Mastan1* and G. Padmavathi2
1Post Graduate Department of Biotechnology, P.G. Courses & Research Centre, D.N.R. College, Bhimavarm, W.G.Dt, - 534 202 India.
2Rice Research, Rajendranagar, Hyderabad - 500 030 India.
ABSTRACT: In the present investigation an attempts has been made to identify the putative genomic regions/Quantitative trait loci governing alkaline tolerance in CSR 27. A Substantial variation was observed for salt injury scores and Na uptake. Salt injury scores of the F3 population ranged from 4.00 to 9.00 with a mean value of 5.99. Na uptake values ranged from 1.25 to 2.50 mmol/g dry weights with a mean of 1.29 mmol/g dry weight. The frequency distribution of mean phenotypic values of the two traits clearly indicated that it is not major genes but poly genes that are controlling the trait expression showing continuous segregation of genes. A total of 208 SSR primers were used for polymorphism survey of parental cultivars. Of the 208 microsatellites tested, 120 SSRs amplified well scorable fragments between parents. However on repetition of polymorphic markers between parents and selective genotyping of polymorphic SSRs in tolerant and sensitive F2 genotypes resulted in further narrowing down of SSRs to 45 which yielded clear cut SSR loci. Percentage polymorphism was found to be 21.6 between parents. A set of 190 DNA samples of F2 genotypes were screened with 45 polymorphic SSRs. The QTLS and their effects for salt injury scores and Na uptake were obtained using QTL cartographer version 2.5 employing composite interval mapping (CIM) methods.
KEYWORDS: Oryza sativa L; putative quantitative trait loci; alkalinity tolerance
Download this article as:| Copy the following to cite this article: Tejaswi. K. U, Ramayya. P. J, Mastan. S. A, Padmavathi. G. Studies on Identification of Putative Quantitative Trait Loci for Alkaline Tolerance in Rice (Oryza Sativa L.). Biosci Biotechnol Res Asia 2009;6(2) |
| Copy the following to cite this URL: Tejaswi. K. U, Ramayya. P. J, Mastan. S. A, Padmavathi. G. Studies on Identification of Putative Quantitative Trait Loci for Alkaline Tolerance in Rice (Oryza Sativa L.). Biosci Biotechnol Res Asia 2009;6(2). Available from: https://www.biotech-asia.org/?p=8748. |
Introduction
Rice is a major staple food crop of world’s population. In the past few decades although rice production has been doubled due to the introduction of high yielding rice varieties and is still insufficient to cater to the needs of ever increasing global human population which is expected to increase at the rate of 1% per annum. (Khush, 1997). On the other hand biotic and abiotic stresses affect rice production (Khush, 1997). Salt stress is immense and growing day by day. Actually 800 million hectares of land throughout the world are salt-affected, either by salinity (397 million ha) or the associated conditions of sodicity (434 million ha) (FAO, 2005). In India alkaline and saline soils occupies more than 9 million hectares and is rapidly increasing.
Among abiotic stresses, salt stress is the second most stress limiting rice yields. Salt stresses include coastal saline, inland saline and alkaline stresses. Salt stress is complex and greatly affects plant growth and development and is one of the major constraints for rice crop production. In Asia, saline soils are a major problem in China, India, Thailand, Indonesia and Australia. To limit the effect of salt in plant productivity, amelioration and utilization of salt-affected soils are needed. Two approaches are used to solve the problem: by using technical approaches (water and soil management) and biological approaches. Financial difficulties as well as the environmental injuries caused by desalinization programs resulted in the much dependency on biological approach, i.e., use of tolerant cultivars with inherent ability to grow in salt stress areas.
Salinity is generally defined as the presence of excessive amounts of soluble salt that hinders or affects the normal functions needed for plant growth. It is measured in terms of electric conductivity (ECe), or of the exchangeable Na+ percentage (ESP) or with the Na+ absorption ratio (SAR) and pH of saturated soil paste extract. Therefore saline soils are those with ECe more than 4 dSm-1 equivalent to 40 mM NaCl, ESP less than 15 % and a pH below 8.5 (Waisel, 1972; Abrol, 1986; SzabolcsI, 1994). The present paper reports the identification of putative quantitative trait loci for alkalinity tolerance in Rice (Oryza sativa L.).
Materials and Methods
In the present study, two high yielding indica cultivars have been used as experimental material viz., BPT 5204 (Alkaline sensitive) and CSR 27 (Alkaline tolerant). BPT 5204 was obtained from Acharya N.G. Ranga Agricultural University (ANGRAU), Hyderabad whereas CSR 27 from Central Soil Salinity Research Institute (CSSRI), Karnal, Haryana.
A cross was made between plants of BPT 5204, a semi dwarf, high yielding widely grown mega variety with long duration (150 days) and medium slender grain but sensitive to alkaline stress and CSR 27, a fine grain, high yielding long duration (135-140 days) salt tolerant variety released by CVRC for alkaline (pH 9.6 to 9.9) and coastal saline soils (ECe upto 10 dSm-1); derived from Nona Bokra/IR 5657-33-2. It has a morphological marker of purple stigma. This variety possess a higher tissue tolerance capacity, K+ mining ability and Na+ exclusion mechanisms of tolerance.
Sodic Microplot Screening
The performance of two rice varieties, BPT 5204 (BPT 5204) and CSR 27 was studied in sodic microplots (pH 9.7) at CSSRI, Karnal, Haryana. Tolerant variety CSR 27 showed much better survival, plant growth as compared to sensitive parent (BPT 5204). Sensitive variety was characterized by higher reduction in growth, and survival.
The parents, CSR 27, BPT 5204; and F3 families (9 plants/family) were grown in sodic micro plots under high pH (9.7) at CSSRI, Karnal, Haryana. The individual seedlings in each F3 progenies were scored on 1-9 scale on the basis of visual symptoms of leaf injury following Standard Evaluation System for Rice (SES, 1996). The average scores were calculated. Similarly a quantitative measure of Na uptake were determined by atomic absorption spectrophotometer, seedling wise in each of the F3 family, averaged and used for testing normal distribution.
Protocol for DNA Isolation
This procedure involves the steps like leaf sample collection, preparation of CTAB buffer, grinding of leaf sample and extraction of genomic DNA. The seeds were placed over a moistened blotting paper in a Petri plates and kept in an incubator maintained at 25-35oC temperature. Water in the Petri plates was changed regularly. The seedlings were harvested after 7-10 days and used for isolation of DNA. The protocol is as follows:
About 2cm leaf sample was taken and cut it into small pieces and placed in the well of a spot plate.
The leaf pieces were crushed after adding 400ml of extraction buffer using a sterilized blunt ended glass rod. After ensuring complete grinding of leaf pieces, 400ml more of extraction buffer was added.
The entire content was transferred in to a 1.5 ml eppendorf tube using the micropipette tip of 1 ml capacity.
Equal volume of (800ml) chloroform was added; the contents were mixed well by inversion for about 5 min and centrifuged at 13000 rpm for 15min at room temperature.
The supernatant was transferred in to a fresh centrifuge tube without disturbing the intermediate layer of insoluble proteins.
Equal volume of chilled isoproponol was added to the supernatant and kept at 40Cfor 10 min.
The contents were mixed gently and centrifuged at13000 rpm for 10 min at room temperature.
The supernatant was discarded and the DNA pellet was washed with 100ml of 70% ethanol. The contents were centrifuged at 13000 rpm for 5 minutes at room temperature.
The supernatant was discarded and the DNA pellet was air-dried at room temperature for 2-3 hours.
Then, the DNA pellet was dissolved in 50-100 ml of TE buffer.
Quantification of DNA
The quality and quantity of extracted genomic DNA was checked by agarose gel electrophoresis (0.8% agarose) with standard sample or by using Nanodrop Spectrophotometer. Clear and intact bands in the agarose gel indicate the high quality of the isolated DNA. A minimum concentration of 10-20ng/ml of genomic DNA is required for PCR amplification. The genomic DNA was diluted with TE buffer to get approximately 20ng/ml concentration, which can be directly used for PCR.
Polymerase Chain Reaction (PCR)
In the present study the PCR amplification of isolated DNA was carried out by preparing 8.0 ml of the master mix (sterile distilled water5.3ml, 10X buffer 1.0ml, dNTP’s (2.5mM) 0.5ml, forward primer (1.25 picomoles) 0.5ml, reverse primer (1.25 picomoles) 0.5ml and Taq DNA polymerase (3U/ml) 0.2ml) in a sterile 1.5ml eppendorf tube and dispensed into each well of the PCR plate. Then, 2.0ml of the each DNA sample was added to the respective wells to make a final reaction volume of 10ml. The PCR plate was then set up in a programmable thermal cycler (Eppendorf PCR machine) for DNA amplification. Temperature specifications for the proper amplification of isolated DNA are Initial denaturation at 940C for 5min, denaturation at 940C for 30sec, annealing at 550C for 30sec, extension at 720C for 1min and final extension at 720C for 7min and cooling at 40C.
Agarose Gel Electrophoresis
The amplified DNA was separated by using 3% agarose gel electrophoresis. For this the electrophoresis tank was filled with sufficient amount of 0.5x TBE Buffer. About 12gm of agarose was melted using 400ml of 0.5xTBE to make 3% gel. Ethidium Bromide (12µl) was added to the melted gel and mixed thoroughly. Appropriate combs were placed in the slots given in the casting plate so that wells were formed. The solidified gel was shifted to the gel tank containing 0.5X TBE buffer so that it should be completely immersed in the buffer, and carefully removes the combs. Then, the PCR product was loaded in to the well after adding 1ml tracking dye (Bromophenol Blue). The lid of the gel tank was closed and the electrodes were connected to the power pack. The DNA samples were electrophoresed at 160 V for 1 hour. After the tracking dye reached two third (2/3) distance, the gel was exposed at 300nm wavelength of UV light and documented using SYNGENE Gel Documentation Unit (Genesnap).
Results and Discussion
Parental Screening
The parents as well as F3 population were grown in sodic microplots under controlled conditions (pH 9.7) and subjected to alkalinity stress at CSSRI, Karnal, Haryana. VSR 156 served as alkaline sensitive and CSR 36 as alkaline tolerant checks. The two parental varieties, BPT 5204 and CSR 27 used differ significantly for their response to alkalinity stress and Na uptake. BPT 5204 had a score of 9.0 whereas CSR 27 had a score of 4.0 in the scale of 1-9 for alkalinity tolerance. BPT 5204 showed Na uptake of 1.25 mmol/g dry weight and CSR 27 had 2.50 mmol/g dry weight. In this way parents showed differences with respect to phenotypic expression of traits under study.
Phenotyping in F3 population
Substantial variation was observed for salt injury scores and Na uptake. Salt injury scores of the F3 population ranged from 4.00 to 9.00 with a mean value of 5.99. Na uptake values ranged from 1.25 to 2.50 mmol/g dry weights with a mean of 1.29 mmol/g dry weight (Table 1).
The frequency distribution of mean phenotypic values of the two traits clearly indicated that it is not major genes but poly genes that are controlling the trait expression showing continuous segregation of genes. (Fig.1and2).
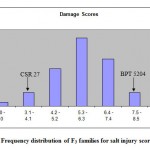 |
Figure 1: Frequency distribution of F3 families for salt injury scores.
|
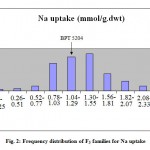 |
Figure 2: Frequency distribution of F3 families for Na uptake.
|
Also transgressive segregants were observed for salt injury scores and sodium uptake traits for which most of the lines had phenotypic values exceeding parental limits in some of the F3 progenies. Such a distribution indicated the involvement of minor gene with phenotypic values greater than that of parents. Transgressive segregants tended towards salt tolerant CSR 27 parent whereas for sodium uptake it was towards BPT 5204, salt sensitive parent. These transgressive segregants might have resulted due to accumulation of different favorable genes conferring salt tolerance or development of new combinations of stress related genes from the parents.
Table 1: Mean phenotypic performance of parents and F3 population of the Cross CSR 27 X BPT 5204 under sodic microplots (pH 9.7)
| Traits | Parents | F3 Population | |||
| CSR 27 | BPT 5204 | Mean | Standard deviation | Range | |
| Salt injury scores | 4.0 | 9.0 | 5.99 | 0.99 | 2.0 – 9.0 |
| Na uptake | 2.50
|
1.25
|
1.29
|
0.02
|
0.18-2.57
|
Screening for polymorphism
A total of 208 SSR primers were used for polymorphism survey of parental cultivars. Of the 208 microsatellites tested, 120 SSRs amplified well scorable fragments between parents. However on repetetion of polymorphic markers between parents and selective genotyping of polymorphic SSRs in tolerant and sensitive F2 genotypes, resulted in further narrowing down of SSRs to 45 which yielded clearcut SSR loci. Percentage polymorphism was found to be 21.6 between parents (Table 2) A few of the primer pairs amplified monomorphic fragments which could not distinguish the parents.
Table 2: Pattern of polymorphism between parents.
| CSR 27 Vs BPT 5204 | |
| Polymorphic SSRs | 4520 |
| Total SSRs | 208 |
| % polymorphism | 21.6 |
Genotyping of F2 population using SSRS
A set of 190 DNA samples of F2 genotypes were screened with 45 polymorphic SSRs. A representative gel image of a DNA banding profile obtained using RM 21770 in a F2 population was presented in Fig 3.
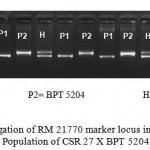 |
Figure 3: Segregation of RM 21770 marker locus in F2.3 mapping Population of CSR 27 X BPT 5204.
|
Segregation of SSR loci
SSR markers are considered to behave as codominant markers and are expected to segregate in a ratio of 1:2:1 (1 homozygote with fragment of CSR 27: 2 heterozygotes with fragments of both CSR 27 and BPT 5204: 1 homozygote with fragment of BPT 5204).The distribution of majority of these polymorphic loci were more or less in the expected frequency.
Identification of putative QTLs
The QTLS and their effects for salt injury scores and Na uptake were obtained using QTL cartographer version 2.5 employing composite interval mapping (CIM) methods. A logarithm of odds (LOD) score of 2.0 was used as the threshold for the identification of putative QTLs in a given genomic region. The total phenotypic variation and the additive effect of each QTL explained by salt tolerance were also calculated.
A total of two significant QTLs each associated with salt injury scores and Na uptake were detected. A QTL was detected with a LOD threshold of 6.06 between the markers RM 21770-RM 21772 on chromosome 7 for salt injury scores showing a negative additive effect (-0.50) of CSR 27 allele. This QTL explained 22% of phenotypic variance (R2) of the trait. Another QTL with a LOD threshold of 4.8, R2 (%) of 14 was detected within a marker interval of RM 208-RM 5076 on chromosome 2 with -0.35 additive effect (Fig. 4).
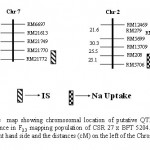 |
Figure 4
|
Earlier studies reported salt tolerance trait to be controlled by poly genes with high environmental influence. The complex nature of the trait contributed by several physiological mechanisms made the breeding programs cumbersome. With the advent of molecular marker technology, the DNA markers became handy to plant breeders in tackling the trait with much ease. Particularly microsatellite markers or simple sequence repeats (SSRs) which are being widely-used as molecular markers for finger printing germplasm to assess genetic diversity, pedigree analysis, evolutionary studies and genome mapping (Yang et al, 1994; McCouch et al, 1997, Garland et al, 1999). Rice microsatellites have been demonstrated to be polymorphic between (Akagi et al., 1997; Chen et al., 1997) and within rice populations. Microsatellite markers have been used effectively to map QTLs associated with salt tolerance (Lang et al., 2000 and 2001; Singh et al., 2007).
A few attempts have already been made to identify QTLS associated with salinity tolerance in rice. A major gene for salt tolerance was mapped on chromosome 7, using F2 population derived from a salt-tolerant japonica rice mutant, M-20 and the sensitive original variety 77-170 (Zhang et al. 1995). Seven QTLs for seedling triats associated with salt tolerance were identified and were mapped to five different chromosomes (Prasad et al., 2000). The QTLs associated with different mechanisms of salinity tolerance in rice independently govern the uptake of Na and K and Na:K selectivity and are mapped on different chromosomes (Koyama et al. 2001).
Conclusion
In the present investigation an attempt has been made to identify putative genomic regions/Quantitative trait loci governing alkaline tolerance in CSR 27. Although considerable progress has been made in saline tolerance through both conventional breeding and molecular marker approaches, studies on alkaline tolerance seems to be limited in literature in rice. Hence we made an effort to study genetic polymorphism, genetic base and identification of putative genomic regions or quantitative trait loci controlling alkaline tolerance using molecular markers, specifically simple sequence repeats.
The quantitative tolerance to alkalinity has been studied in F2.3 mapping population derived from samba mahsuri (alkaline sensitive) and CSR 27 (alkaline tolerant). The F3 progenies have been evaluated under controlled conditions in sodic microplots. Observations have been recorded on physiological parameters viz., Na uptake and salt injury scores. Frequency distribution of salt injury scores and Na uptake displayed a normal distribution indicating minor genes each explaining a relatively small amount of phenotypic variance associated with them. The recovery of transgressive segregants further confirmed the polygenic control of the trait. Therefore quantitative inheritance involving poly genes has been established.
The parental survey of polymorphism has been made between parents using DNA based codominant Simple sequence repeats. Parents were found to be genetically polymorphic with respect to physiological traits under study. Simple sequence repeats were employed to detect genomic locations /quantitative trait loci (QTL). QTL analysis of 45 SSRs spanning 12 chromosomes using composite interval mapping method has detected two significant putative QTLs for salt injury scores and Na uptake traits, one each on chromosome 7 and 2 respectively. The positive alleles came from CSR 27, the donor parent. However there lies scope to use a few more SSRS to identify meaningful QTLS with more phenotypic variance in order to use them in marker assisted selection of alkaline tolerance trait.
References
- Abrol IP., Salt-affected soils: an overview. In aproches for incorporating drought and salinity resistance in crop plants. V.L. Chopra and S.L. Paroda (Eds) New Delhi, India. Oxford and IBH Publishing Company. 1-23 (1986).
- Akagi HY, Yokozeki A, Inagaki T, Fujimura., Highly polymorphic microsatellites of rice consist of AT repeats, and a classification of closely related cultivars with these microsatellite loci. Appl. Genet. 94: 61-67 (1997).
- Bonilla PS, Dvorak J, Mackill D, Deal K, Gregorio G., RFLP and SSLP mapping of salinity tolerance genes in chromosome 1 of rice (Oryza sativa ) using recombinant inbred lines. Philipp. Agric. Sci. 85: 64-74 (2002).
- Chen XS, Temnykh YXu Cho YG, McCouch SR., Development microsatellite framework map providing genome wide coverage in rice (Oryza sativa ). Theor. Appl. Genet. 95: 553-567 (1997).
- , Global network on integrated soil management for sustainable use of salt-affected soils.Rome, Italy: FAO Land and plant nutrition management service. http://www.fao.org/ag/agl/agll/spush (2005).
- Garland SH, Lewin L, Abedinia M, Henry R, Blakeney A., The use of microsatellite polymorphisms for the identification of Australian breeding lines of rice (Oryza sativa L). Euphytica 108: 53-63 (1999).
- Gregorio GB., Tagging salinity tolerance genes in rice using amplified fragment Length polymorphism (AFLP). Ph.D. Thesis, University of the Philippines Los Banos. Laguna, Philippines (1997).
- Khush GS Origin, diepersal, cultivation and variation of rice. Plant Mol Biol. 35:25-34 (1997).
- Koyama M, Levesley A, Koebner R, Flowers T and Yeo A., Quantitative trait loci for component physiological traits determining salt tolerance in rice. Plant Physiology 125, 406-422 (2001).
- Lang NT, Yanagihara S, Buu BC Quantitative trait loci for salt tolerance in rice via molecular markers. Omonrice 8:37-48 (2000).
- Lang NT, Zhikang L, Bui CB Microsatellite markers linked to salt tolerance in rice. Omonrice 9:9-21(2001).
- Singh RK, Gregorio GB, Jain RK QTL Mapping for Salinity Tolerance in Rice. Mol. Biol. Plants 13: 87-99(2007).
- McCouch SR, Chen X, Panaud O, Temnykh S, Xu Y, Cho Y. Huang N, Ishii T, Blair M (1997) Microsatellite marker development, mapping and applications in rice genetics and breeding. Plant Mol. Biol. 35: 89–99.
- Niones JM Fine mapping of the salinity tolerance gene on chromosome 1 of rice (Oryza sativa L) using near isogenic lines. MS dissertation. College, Laguna, Philippines: University of the Philippines Los Baños, Laguna (2004).
- Prasad S, Bagali P, Hittalmani S and Shashidhar H Molecular mapping of quantitative trait loci associated with seedling tolerance to salt stress in rice (Oryza sativa L.). Current Science 78, 162-164 (2000).
- Ren ZH, Gao JP, Li GL, Cai XL, Huang W, Chao DY, Zhu MZ, Wang ZY, Luan S, Lin HX A rice quantitative trait locus for salt tolerance encodes a sodium transporter. Nature Genetics 37: 1141- 1146 (2005).
- Singh RK, Gregorio GB, Jain RK QTL Mapping for Salinity Tolerance in Rice. Mol. Biol. Plants 13: 87-99 (2007).
- Szabolcs I Prospect for soil salinity for the 21st century. Paper presented at 15th world congress of soil science, Acapulco, Mexco, Huly 10-16 I: 123-141(1994).
- Waisel Y Biology of halophytes. New York: Accademic Press (1972).
- Walia H, Wilson C, Condamine P, Liu X, Ismail AM, Zeng L, Wanamaker SI, Mandal J, Xu J, Cui X, Close TJ Comparative transcriptional profiling of two contrasting rice genotypes under salinity stress during the vegetative growth stage. Plant Physiol. 139: 822-835 (2005).
- Yang GP, Maroof MAS, Xu CG, Zhang Q, Biyashcv RM Comparative analysis of microsatellite DNA polymorphism in land races and cultivars of rice. Gen. Genet. 245: 187 (1994).
- Zhang G. Y, Y. Guo, S. L. Chen, S.Y. chen. RFLP tagging of a salt tolerance gene in rice Plant Sci. 110: 227-234 (1995).

This work is licensed under a Creative Commons Attribution 4.0 International License.


