

Manuscript accepted on : September 08, 2008
Published online on: 28-12-2008
Study of bio-clinical parameters in anemic and non-anemic individuals of selected age groups
C. S. Felice1*, Amena Nasim1, M. A. Bhargavi1, Harish Gandhi K.1, R. Deepthi1 and N. Mahesh1
Department Of Biotechnology, Koneru Lakshmaiah College of Engineering, Vaddeswaram, 522502, Guntur Dt., A.P, India.
ABSTRACT: The word Anemia is a combination of two words, A standing for NO and Nemia standing for BLOOD. The decrease in the percentage of Hb, the decrease in the percentage of total count of RBC, and also the decrease in oxygen carrying capacity of blood is called Anemia. It is one of the most common of disorders seen more in the female population, than in the male. Anemias could be of both general and hereditary type. The present work aims at identifying different age group individuals (male and female), to carry a survey concerning their present and past case history with reference to their habits and style of living. A series of blood samples from selected diseased and undiseased population of either sex would be screened with reference to parameters like determination of Hemoglobin percentages, TC and DC counts, ESR, PCV, BT, CT, Blood Glucose, Cholesterol, Bilurubin, Urea and Creatinine levels will be assessed, correlated and finally a conclusion would be drawn so as to identify the major cause of the disease and what happens to the various biological parameters in the body
KEYWORDS: Anemia; Analysis; Correlation; RBC; WBC; Hemoglobin
Download this article as:| Copy the following to cite this article: Felice C.S , Nasim A, Bhargavi M. A, Gandhi K. H, Deepthi R and Mahesh N. Study of bio-clinical parameters in anemic and non-anemic individuals of selected age groups.Biosci Biotechnol Res Asia 2008;5(2). |
Introduction
Anemia AmE or Anemia (BrE) from the Greek (Ἀναιμία) meaning “without blood”, refers to a deficiency of red blood cells (RBCs) and/or hemoglobin. This results in a reduced ability of blood to transfer oxygen to the tissues, causing hypoxia; since all human cells depend on oxygen for survival, varying degrees of anemia can have a wide range of clinical consequences. Hemoglobin (the oxygen-carrying protein
in the red blood cells) has to be present to ensure adequate oxygenation of all body tissues and organs. Different clinicians approach anemia in different ways; two major approaches of classifying anemia’s include the “kinetic” approach which involves evaluating production, destruction and loss, and the “morphologic” approach which groups anemia by red blood cell size. The morphologic approach uses a quickly available and cheap lab test as its starting point (the MCV). Regardless of one’s philosophy about the classification of anemia, however, any methodical clinical evaluation should yield equally good results.
Materials
Blood samples, Glucose, urea, Cholesterol, Bilurubin standards, RBC Diluting fluid, WBC diluting fluid. Working GOD/POD reagent for glucose estimation, N/10 HCl, 10% Sodium tungstate, Sulphuric acid, 2/3 N.Diacetyl monoxime (2 %) for Urea estimation, Diazo reagent and methanol for bilurubin estimation,
Haemometer, Haemocytometer, Micropipettes, Elico SL-159 Spectrophotometer, Compound Microscopes, Table top centrifuge.
Methods
Estimation of Hemoglobin
N/10 HCl was taken in the Hb tube up to lowest mark 20. The finger was pricked with sterile needle and measured amount of blood was placed into Hb tube. The Hb tube was placed in the compater or haemometer and drop by drop distilled water was added into it until the colour of solution in the tube coincides with the glass plate of the compater or haemometer.Based on color comparision in the tube and meter, the percentage of Hb was calculated.
Estimation of RBC
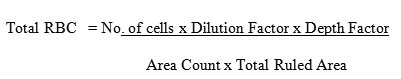
Blood was drawn in RBC pipette and filled up to the mark with diluting fluid. A cover slip was placed on the counting chamber and a small drop of diluted blood was allowed, to slip into the counting chamber by capillary action. The counting chamber was kept aside for three mins for the cells to settle. The cells were observed by placing them in neubaur chamber and the cells were counted from upper left corner. The total RBC was calculated using the formula;
Estimation of WBC
Blood was drawn in WBC pipette and filled up to the mark with diluting fluid. A cover slip was placed on the counting chamber and a small drop of diluted blood was allowed, to slip into the counting chamber by capillary action. The counting chamber was kept aside for few mins for the cells to settle. The cells were observed by placing them in neubaur chamber and the cells were counted in four corners of the neubaur chamber. The total WBC was calculated using the formula;

Estimation of Blood Glucose
This method was based on the principle of glucose oxidase and peroxidase method.Three clean and dry Test tubes are taken and 1 ml of working GOD & POD reagent was pipetted in all the three tubes. 0.01 ml of plasma was added in tube labeled test and 0.01 ml of working glucose STD in tube labeled standard the tubes are kept aside for 10 minutes at 37oc or 15 minutes at room temperature. The absorbance of the solution was measured against reagent blank at 505nm.
Estimation of Urea
This method was based on the principle of reaction of urea with diacetyl monoxime to produce a colored chromogen that is measured colorimerically or spectrophotometrically. 0.1ml of blood is washed into 3.3 ml of water and 0.3 ml of 10 per cent sodium tungstate was added along with 0.3 ml of 2/3 N sulphuric acid. The tubes are mixed well and centrifuged. 1 ml of supernatant fluid is taken and 1 ml. of water, 0.4ml.diacetyl monoxime and 1.6 ml. of the sulphuric acid-phosphoric acid mixture are added. Tubes are placed in a boiling water bath for thirty minutes, cooled, and read against reagent blank at 480 nm. At the same time the colour is developed from 1 ml. of the two standards.
Estimation of Bilurubin
0.2 ml. of serum is washed into 5.4 ml. of water and mixed well. 2.8ml. of this was pipetted into a second tube to be used as blank. To the test 0.7ml of diazo-reagent and to blank 0.7ml of sulphanilic acid solution was added. Tubes are thoroughly mixed and kept aside for five minutes. The absorbance of the resulting solution is read at 540 nm or using a green filter. This gives the conjugated bilirubin. To obtain the total bilirubin 3.5ml of methanol was added to each tube and read again after standing for five minutes. 0.2ml. of bilirubin standard to 3.5 ml of methanol was added, to this 0.7ml. of diazo-reagent was added and after mixing was read against a water blank after keeping the tubes aside for five minutes.
Estimation of Cholesterol
0.1ml of serum was added to 10ml of ferric chloride-acetic acid reagent in a glass-stoppered centrifuge tube. Tube was mixed well and allowed to stand for 10-15 minutes (or over night) for the proteins to flocculate. 5 ml of Centrifuge was transferred from the clear supernatant fluid to a glass-stoppered centrifuge tube. For standard 0.1ml of physiological saline and 10 ml of the cholesterol standard were mixed for use and transferred 5 ml to a second-stoppered centrifuge tube. For blank 5ml of the ferric chloride-acetic acid reagent was taken in a third tube. Add 3 ml of sulphuric acid from a burette to all three tubes. The tubes are stoppered tightly and mixed by repeated inversion. The stopper is carefully loosened and allowed to stand for 20-30 minutes. Unknown and standard are read against reagent blank using a yellow filter or at 560 millimicrons.
Results
After a systematic survey of population in different age groups is carried out and after pooling up data of the experiments and examination, the results with reference to various biological and clinical parameters were tabulated and are presented in table 1
Table 1: Clinical Parameters in different age group individuals (Anemic and Non Anemic).
|
Age group |
Haemoglobin Content (gm%) | Total
RBC 3.5 – 5.0 (millioncells/mm3) |
Total
WBC 4000-11000 Cells/mm3 |
Blood Glucose
80-140 mg/dl |
Serum
Urea 20-45 mg/dl |
Serum
Cholesterol 150-250 mg/dl
|
Serum
Bilurubin 0.2-1.0 mg/dl |
|
20-40 40-60 20-40 60 and above 20-40 40-60 20-40 20-40 1-20 1-20 1-20 1-20 1-20 1-20 |
11 10.5 8 8 10 9.8 12 13.2 7.5 10 7 8 6 9.5 |
3.8 3.6 2.8 2.8 3.5 3.4 4.2 4.6 2.6 3.5 2.4 2.8 2.1 3.2
|
4200 8000 3400 6200 8000 10400 7600 2800 7400 3200 9600 6600 7200 4600 |
107.812 92.187 93.75 90.625 123.437 140.625 96.875 145.312 90.625 123.437 154.6875 87.5 121.875 103.125 |
36.61 26.50 27.61 25.81 37.91 45.1 33.84 49.01 25.81 37.17 47.5 25.51 36.0 35.91 |
184.615 107.692 115.2 84.615 123.19 369.23 76.923 223.07 92.06 76.92 215.384 123.19 107.69 107.69 |
0.97 1.15 0.8 0.77 0.66 1.16 1.1 1.3 0.9 0.65 1.17 0.55 0.84 0.95 |
Discussion
After the results are tabulated and patterns of various parameters are studied and keeping in view the other health particulars of the subjects obtained from the survey forms it is found that subject who are anemic are usually found to posses very low hemoglobin values as is an evident feature of many anemic individuals. The variation in the count of RBC was evident but there was no subsequent change in the WBC content of the blood. The normal RBC count is usually between 3.5 to 5.0 million-cells/ mm3, however in the present study the values only in normal cases were in the mentioned range and in anemic individuals they were sub-normal. In anemic individuals the levels of glucose were found to be slightly abnormal, whereas there was no significant change in the urea and bilurubin levels. The levels of cholesterol in few subjects who were suffering from anemia and cardiac diseases were found to be very high especially above 300 mg/dl.
Conclusion
It can be concluded that in female individuals and individuals suffering from respiratory disorders the concurrence of anemia is very high and the survey depicts the relationship between low Hemoglobin and RBC levels that are ultimately the root cause of the disease. However it was not very clear that, anemia could be associated with other diseases, however the survey revealed a few interesting facts, indicating a variation in glucose and cholesterol levels but normal urea and bilurubin levels, indicating that kidneys and liver do not undergo much damage and the carbohydrate and lipid metabolism undergoes considerable changes.
Acknowledgements
The Authors are highly indebted to the Management and Principal of Koneru Lakshmaiah college of Engineering for providing the necessary infra-structural facilities in completion of the project and also to our faculty, staff and students in the Department of Biotechnology for their support and encouragement
References
- Practical Biochemistry by Jayaraman
- Practical Biochemistry by David Plummer.
- Textbook of Medical Lab Technology by Ramnik and Sood.
- Practical Clinical Biochemistry Vol I & Vol II by Harold Worley.
- http://en.wikipedia.org/wiki/Anemia.
- http://www.freepatentsonline.com/4818703.html.
- http://www.clinchem.org/cgi/content/abstract/19/2/253.
- http://www.emedicinehealth.com/anemia/article_em.htm.
- http://www.healthscout.com/ency/407/112/main.html.
- http://yourtotalhealth.ivillage.com/anemia-cancer.html.
- Textbook of Human Physiology by Guyton.
- Lab Manual in Biochemistry by P.J.Samuel.
- Textbook of Medical Biochemistry by Chaterjee and Shinde.

This work is licensed under a Creative Commons Attribution 4.0 International License.


