

Manuscript accepted on : April 30, 2008
Published online on: 04-03-2016
Shelesh Jain and Swarnlata Saraf*
Institute of Pharmacy, Pt. Ravishankar Shukla University, Raipur - 492 010 India
ABSTRACT: A new simple, accurate and precise HPTLC method has been developed for the estimation of glipizide in tablet formulation. In this method, standard and sample solutions of glipizide were applied on precoated silica gel G 60 F254 TLC plate, and developed using ethyl acetate: formic acid: dichloromethane (1:1:2 v/v/v), as mobile phase. The drugs on plate were scanned at 275.5 nm. The dynamic linearity range was 200-800 ng/spot for glipizide. The method was validated for linearity, accuracy, limit of detection, limit of quantification, inter-day and intra-day assay precision, repeatability of measurement, and repeatability of sample application.
KEYWORDS: HPTLC; Glipizide; tablet dosage forms
Download this article as:| Copy the following to cite this article: Jain S, Saraf S. Development and validation of high performance thin layer chromatographic (hptlc) technique for quantification of glipizide in tablet dosage forms. Biosci Biotechnol Res Asia 2008;5(1) |
| Copy the following to cite this URL: Jain S, Saraf S. Development and validation of high performance thin layer chromatographic (hptlc) technique for quantification of glipizide in tablet dosage forms. Biosci Biotechnol Res Asia 2008;5(1). Available from: https://www.biotech-asia.org/?p=6940 |
Introduction
Glipizide, 1- cyclohexyl -3- [[4 -[2-[[ (5-methylpyrazin-2-yl) carbonyl] amino] ethyl] -phenyl] sulphonyl] urea is a potential second generation oral hypoglycemic agent widely used for the treatment of noninsulin-dependent diabetes mellitus (Verma and Garg, 2004). Prior research work revealed that it has a good general tolerability, low incidence of hypoglycemia and low rate of secondary failure. A few analytical methods like spectrophotometeric (Phalka et al. 1997 ) and HPLC (venkatesh et al. 2006) have been reported for the estimation of glipizide in formulations. No any HPTLC method was found reported for its estimation. In the present work, we report a simple and accurate high performance thin layer chromatographic method for estimation of glipizide from tablet dosage forms.
The method was validated for linearity, accuracy, limit of detection, limit of quantification, inter-day and intra-day assay precision, repeatability of measurement, and repeatability of sample application. From the sample aliquot prepared, appropriate dilution was applied, and the plate was developed with the mobile phase. The mobile phase consisted of ethyl acetate: formic acid: dichloromethane (1:1:2 v/v/v), gave Rf values of 0.63±0.03 for glipizide (Figure 2). A good linear relationship was obtained over a concentration range of 200-800 ng/spot for glipizide. A triplicate of those was carried out, and the peak areas were noted. The amount of glipizide present in the three marketed formulations MI, MII and MIII was calculated using the respective calibration graph and the amount of glipizide was found 101.2±0.972, 99.7±0.623 and 99.63±0.754 respectively.
The limit of detection for glipizide was found to be 200 ng and the limit of quantification was found to be 0.339μg/ml. The linear regression data showed a good linear relationship at a concentration range of 200-800 ng/spot for glipizide.
Intra-day assay precision was found by analysis of standard drug at three times on the same day. Inter-day assay precision was carried out using the standard drug at three different days, and % relative standard deviation (RSD) was calculated. The RSD was found to be less than 2 for both inter-day and intra-day assay precision. Repeatability of sample application was assessed by spotting 10 ml of drug solution, 6 times and % RSD was determined. Repeatability of measurement was determined by spotting 10 ml of standard drug solution on TLC plate, after development spot was scanned six times without changing position. The % RSD calculated for glipizide is 0.3672 (Table 1).
Recovery studies were carried out at three levels for the accuracy parameter. To the powdered formulation, the standard drugs of glipizide were added at 50%, 100% and 150% levels, dilutions were made, and analyzed by the method. The % recovery and % RSD were calculated, and found to be within the limit.
Stability studies were also carried out by keeping the sample solution prepared at room temperature for several hours, and was spotted every time on a fresh plate. After development and scanning, the plates were observed for change in peak areas and appearance of additional peaks. It was observed that the plates were stable up to 3 h, after which, there was a significant change found in peak areas and Rf values. The stability of drugs on developed plates were also checked up to 24 h, and were found to be stable up to 9 h. Hence, the plates should be scanned within 9 h after development.
The efficiency of the method is determined by means of number of theoretical plates. It was calculated using the formula, n=16x 2/y 2, where x=Rf value of drugs and y=width of peaks. The number of theoretical plates was 3760 for glipizide. The complete validation parameters are shown in Table -1.
Table 1: Validation Parameters.
| S. No. | Parameter | Value |
| 1 | Rf | 0.63±0.03 |
| 2 | Linearity (ng/spot) | 200-800 ng |
| 3 | Correlation coeificients r2 | 0.9995 |
| 4 | LOD (ng /spot) | 200ng |
| 5 | LOQ (μg /spot) | 0.339 |
| 6 | Accuracy % | 99.38% |
| 8 | Precision (%RSD)
a) Inter Day b) Intra-day |
0.60 0.49 |
| 9 | Repeatability of sample application | 0.8420 |
| 10 | Repeatability of measurements | 0.3672 |
| 11 | No. of theoretical plates | 3760 |
Rf : Retention factor,
RSD : Relative standard deviation
LOD: Limit of detection,
LOQ: Limit of quantification.
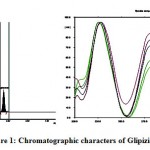 |
Figure 1: Chromatographic characters of Glipizide.
|
The HPTLC method developed is simple, accurate, and cost effective, and the statistical analysis proved that the method is reproducible and efficient for the analysis of glipizide, in combined dosage form.
Experimental
The instrument used for the estimation, was Camag Linomat V semi automatic sample applicator, Camag TLC scanner 3, CATS V.4.06 software for interpretation of the data, Hamilton syringe and Camag twin trough chamber. Standard glipizide (98%) was obtained from SPARK Laboratory, Baroda, INDIA as gift sample. The pre coated silica gel G 60 F 254 was used as stationary phase, obtained from E. Merck. The mobile phase used was ethyl acetate: formic acid: dichloromethane (1:1:2 v/v/v), chamber saturation time 20 min, migration distance 70 mm, wavelength scanning at 275.5 nm, band width 8 mm, slit dimension 5±0.45 mm, scanning speed 20 nm/sec, and the source of radiation was a deuterium lamp. and methanol was used as solvent. All the solvents used were of AR grade, obtained form S. D. Fine Chemicals Ltd., Mumbai. Glipizide tablet formulations were purchased from local market of Raipur, C.G., INDIA.
A standard glipizide solution was prepared with accurately weighed 10 mg of glipizide dissolved in methanol, into a 10 ml volumetric flask.
The sample drug solution was prepared by taking 20 tablets, each containing 5 mg of glipizide. The tablets were weighed and powdered. The quantity of powder equivalent to 100 mg of glipizide was weighed, transferred to a 100 ml of volumetric flask, and extracted with 25 ml of methanol thrice. The extracts were filtered through Whatman filter paper, and the residue washed with small amount of methanol. The filtered extract and washings were transferred into 100 ml volumetric flask, and volume was made up to 100 ml with methanol.
On to a pre-washed and activated TLC plate, 2-10 ml of standard stock solution of glipizide was spotted with Linomat V Semi applicator. The plates were developed and scanned. The peak areas of each standard were obtained from the system, and a calibration graph was plotted with concentration vs. peak area.
Acknowledgements
Authors are highly thankful to AICTE for providing research grant under MORDROB scheme.
References
- Verma RK., Garg S., (2004) Development and evaluation of osmotically controlled oral drug delivery system of glipizide, European Journal of Pharmaceutics and Biopharmaceutics 57:513–525
- Phalka PN, Sherikar AV, Dhadke PM, (1997) Direct spectrophotometric analysis of glipizide and phenformin hydrochloride in pharmaceutical dosage forms, Indian Journal of Pharmaceutical Sciences, 59:18-21.
- Venkatesh P, Harisudhan T, Choudhury H, Mullangi R, Srinivas NR., (2006) Simultaneous estimation of six anti-diabetic drugs-glibenclamide, gliclazide, glipizide, pioglitazone, repaglinide and rosiglitazone: development of a novel HPLC method for use in the analysis of pharmaceutical formulations and its application to human plasma assay. Biomed Chromatogr. 20:1043-48

This work is licensed under a Creative Commons Attribution 4.0 International License.


