

Manuscript accepted on :
Published online on: --
Plagiarism Check: Yes
A Study of Specific Polymers for Detection of Gas by Optical Fiber Sensor
S. Abderrahmane, A. Himour, R. Kherrat and Nicole Jaffrezic-Renault
University Badji Mokhtar of Annaba (Algeria) B.P :139 Oued Kouba –23000 Annaba (Algeria) Ecole Centrale de Lyon, BP 163, 69131 Ecully Cedex (France).
ABSTRACT: The sensor’s most significant part is a polymer whose nature defines the sensor’s response. The search for a polymer must be subject to some chemical criteria such as sensitivity to gas,and viscosity,... and to optical criteria such as homogeneity, refraction index and so forth; which may be antagonistic. Therefore, this study requires dealing. Also, selectivity of the polymeric basis is highlighted by using the standardised distribution coefficient.
KEYWORDS: Polymers; optical fiber sensor; Refractive index
Download this article as:| Copy the following to cite this article: Abderrahmane S, Himour A, Kherrat R, Jaffrezic-Renault N. A Study of Specific Polymers for Detection of Gas by Optical Fiber Sensor. Biosci Biotechnol Res Asia 2003;1(1) |
| Copy the following to cite this URL: Abderrahmane S, Himour A, Kherrat R, Jaffrezic-Renault N. A Study of Specific Polymers for Detection of Gas by Optical Fiber Sensor. Biosci Biotechnol Res Asia 2003;1(1). Available from: https://www.biotech-asia.org/?p=3359 |
Introduction
Chemical sensors using optical transducers offer interesting insights for chemical vapor and gas detection. The great sensitivity of these devices allows with as good precision as possible. the measure and detection of low gas concentration in air. The sensitive element of the sensor is a thin polymer film which has been deposited on the arm of measurement of the interferometer. Such a polymer has to be properly chosen as it determines sensor selectivity and sensitivity . In our case, the main physicochemical parameter is the refraction index variation for either sheath material ( optical fiber based sensor ) or superstratum ( wave guide sensor).
Measurement system
Sensor principle : A sensitive material (polymer) is deposited as a thin film on the surface of a glass plate and covers a confined optical guide (Fig. 1). The speed of the light beam propagating through the guide slightly changes with the film index on the glass surface. This occurs when chemical molecules are absorbed by the thin film. The speed variation of the optical wave is detected by comparing the phase of the wave propagating through this guide to the one which is not in contact with any sensitive film. This phenomenon is cumulative: the longer the interaction guides the sensitive layer , the more significant the dephasing will be.
Description of the polymers
General information on heteropolysiloxanes (HPS)
The method of silanisation described by Kovats guarantees a maximum rate of grafting of about 60% of the silanols sites onto silica. The substrate thus grafted consists of an organic part (aliphatic chains of grafted silanes) and of an inorganic part (silanols residual of silica). The material we propose to synthetize in this paper, must have a double affinity with the substrate (silica, glass) or the full-course one grafted, and with the chemical vapor which has to be detected. Composite materials of heteropolysiloxane type (HPS) have been chosen so that they can be classified as polymer silicones, bearing the chemical groups able to be grafted on silica or glass. More over, they fit to all the required criteria¹.
Synthesis Conditions
The reaction mechanisms for hydrolysis and condensation are activated by an acid catalysis at room temperature. The selected solvent is an alcohol with alkoxy groups matching their precursor’s in order to avoid cross esterificating reactions.
The process differs according to the precursor’s nature (bi or tri-functional). In the first case, it is necessary to add a cross linking agent in order to generate a three-dimensional network.
bi-functional Precursor
Precursor :
(CH3O)2SiRR’ or (C2H5O)2SiRR’ : 1 ml
Solvent :
CH3OH or C2H5OH: 1ml
Catalyst :
HCl : 0,025 ml
Cross-linking Agent:
(C2H5O)4Si : 0,20 ml
Precursors and catalysts are added to the solvent. The mixture is maintained under magnetic stiring during fifteen minutes. After addition of the cross-linking agent, this mixture is kept under magnetic stiring for three hours. The polymeric unit synthesized according to this process can be written as follows:
Vinyl Méthyl Phényl Méthyl Siloxane (VMPMS): Refraction index of about 1,450.
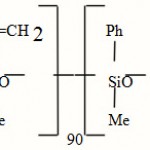 |
Scheme 1 |
Tri-functional precursor: The reagents and the solvent are added in the following molar proportions:
Precursor : (CH3O)3SiR’ or (C2H5O)3SiR’: 1,0
solvent : CH3OH or C2H5OH: 9,6
catalyst : H2O: 1,5
HCl: 0,1
The reactional mixture is kept under magnetic stiring for three hours
The polymer synthesized according to this process is:
Iso Butyl Siloxane (IBS) :
Indice de réfraction environ 1,445
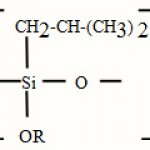 |
Scheme 2 |
3.3-polymers heteropolysiloxanes marketed
We also used the following commercial polymers (distributed by Roth-Sochiel):
Glycidoxy Propyl Méthyl Di Méthyl Siloxane (GPMDMS) Refraction index n=1,446 n=1,446 n=n=1,446.
 |
Scheme 3 |
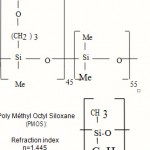
Poly Méthyl Octyl Siloxane (PMOS):Refraction indexn=1,445
Moreover, the squalane which is not part of HPS family, was also used:
The rough formula of squalane is: [ ( C H 3 ) 2 C H ( C H 2 ) 3 C H ( C H 3 ) ( C H 2 ) 3 C H ( C H 3 ) CH2CH2-]2Index of molar refraction n=1,451 Mass M=422, 83g. mol-1
Gas absorption principle in a solid phase or liquid
For non ionic compounds, absorption is often quantified by the thermodynamic parameter K called distrilention coefficient. A mixture of gaseous molecules in polymeric film, being considered as ideal, led to ∆ H0m = 0.
The Trouton Law² makes it possible to express, in the absence of all other data, an approximation of ∆ S0e for organic molecules:
![]()
The distribution coefficient can thus beexpressed according to the boiling point of the aqueous solution: TE.
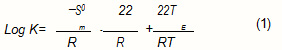
![]()
Thus, the distribution coefficient depends both on the temperature with a fixed thermodynamic balance (T) is fixed and on the boiling point of the aqueous solution (TE)³. It will be more significant with a higher the boiling point of the aqueous solution. The compounds characterized by a high boiling point will be easier to detect than those which are a low boiling point.
Chemical vapor and gas detection using a guide sensor of wave integrated (interferometer with widened fields) Influence of the aqueous solution boiling point on the sensor response During absorption of gas or a chemical vapor (analyte) in the superstratum polymer, the refraction index of each of them varies. The refraction index of the superstratum Polymer and analyte mixed together can be deduced from the refraction indices for all of the analyte, polymeric superstratum, and chemical vapor concentration
within the polymer.
nm = %cs na + (1 – %cs) ns (3)
nm = ns ± Δnx (4)
Where Δnx denotes the measure of the index variation when a gas concentration x is absorbed in the polymer. Thus,
nm = ns ± Δnx = %cs na + (1 – %cs)ns (5)
Which allows to define the value of K as,
![]()
Where Cv is the concentration of the analyte in the vapor phase . We could check the equation
thanks to the detection of aqueous solutions belonging to the series of homologous alkanes. Indeed, the compounds belonging to a same homologous series present similar interactions of solubilization and can be differentiated only by their boiling point values. The limits of detection for the alkanes whose refraction index and boiling point increase with the number of methyl groups contained in the molecule were compared.
From figure 2 one can notice that the variation of the distribution coefficient K versus the ratio TE /T is linear in agreement with the equation (2) for compounds belonging to the f alkane family:
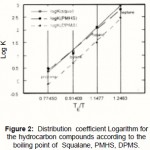 |
Figure 2: Distribution coefficient Logarithm for the hydrocarbon compounds according to the boiling point of Squalane, PMHS, DPMS. |
Chemical vapor detections
In order to test sensor the performance with regards to selectivity, separate tests of the ten different aqueous solutions on each of the selected polymeric superstratum were run.These ten aqueous solutes are: propane, butane hexane, heptane, toluene, ethanol, dichloromethane, carbon tetrachloride, and trichloroethylene. The three polymeric superstrata are: PMHS, DPMS and squalane. Figure 3 is a representation of the signal recording during successive hexane vapor injections in the circuit of dilution. Relative hexane concentrations in the cell are quoted in percent above each peak.
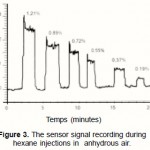 |
Figure 3: The sensor signal recording during hexane injections in anhydrous air. |
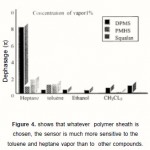 |
Figure 4: shows that whatever polymer sheath is chosen, the sensor is much more sensitive to the toluene and heptane vapor than to other compounds. |
Table 1: Detection limits and distribution coefficient of a series of homologous alkanes according to their boiling point.
| T° | n | a | K | PMHS | K | squalane | K | DPMS | L.D.( *) | L.D. | L.D. | |
| b | ||||||||||||
| S | ne | S | PMHS | Squalane | DPMS | |||||||
| Propane | -42.6 | 1.2898 | 3.035 | 2.33 | 0.74 | 0.52 | 0.9 | 1.18 | ||||
| Butane | -0.6 | 1.3543 | 11.95 | 13.74 | 4.46 | 0.125 | 0.2 | 0.43 | ||||
| Hexane | 69 | 1.375 | 123.51 | 126.98 | 31.08 | 0.02 | 0.08 | 0.07 | ||||
| Heptane | 98.4 | 1.3878 | 629.9 | 923.78 | 295.22 | 0.003 | 0.019 | 0.02 | ||||
Equation (2) shows that the enthalpy of absorption of an aqueous solution in a polymer increases with the boiling point of the aqueous solution. In addition, it is known that the sensitivity of a sensor to variation of index is all the strongest when the variation of the effective index measured after the absorption of the aqueous solution in the
optical sheath is large.
We observe that the hydrocarbon responses are similar, but with relatively different proportions. Moreover,the signal is always positive but decreases from DPMS to PMHS. This phenomenon can be correlated to the Dn variation between the index of the superstratum and that of the detected aqueous solution; the larger the value of Δn vapor
tested on three polymers used the higher the response. Toluene, and chlorinated products are easily separable from hydrocarbons because of their different signatures , except for CH2CL2. As for ethanol, its signature differs from hydrocarbons, but some ambiguities can still exist if measurements are not highly reliable. This fact suggests the
necessity to be directed towards other techniques than those concerning the exploitation of coefficient distribution (see next section) .
Highlighting of polymeric superstrata selectivity by means of the normalized distribution coefficient :
In order to avoid ambiguity in characterizing the effect of various fonctional groups upon the solubility of various organic molecules in the used matrix , all the distribution coefficients are normalized by pairs , the resulting data (Squalane, DPMS) (Squalane, PMHS) (PMHS, DPMS) are represented in 2D graphs.
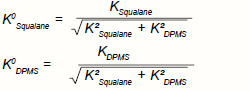
This makes it also possible to quantitative by describe the sensors selectivity4. For example in the case of the pair (Squalane, DPMS), the values of the component K°, corresponding to the standardized vectors are calculated on the basis of the distribution coefficient K using the following formulae:
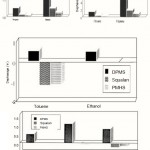 |
Figure 5: Histograms representing the optical signature standardized within 1% for the various vapor tested on three polymers used |
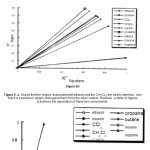 |
Figure 6 |
Table 2 : Distribution coefficient K of various gas and vapor tested in the superstrata used with T = 303 K
| DPMS | Squalane | PMHS | |
| Ethanol | 15.09 | 153.67 | 23.05 |
| Toluène | 319.66 | 832.64 | 776.25 |
| CCl4 | 102.09 | 130.16 | 152.78 |
| CH2Cl2 | 282.46 | 392.31 | 59.54 |
| C2HCl3 | 79.85 | 191.62 | 188.73 |
| Propane | 0.74 | 2.33 | 3.03 |
| Butane | 4.84 | 13.75 | 11.95 |
| Hexane | 31.08 | 126.98 | 123.51 |
| Heptane | 295.22 | 923.78 | 629.9 |
The results obtained are represented in the figures (6a, 6b, 6c)
Conclusion
The use of a multisensor can be a promising method for selective system implementation using various gases and vapor. The practical implementation is carried out by combining both the imprint of each of the studied solutions using tested polymers and the use of standardized distribution coefficients. Furthermore practical exploitation of physicochemical data will be possible by using suitable techniques for signal processing.
References
- Kherrat, R., Jaffrezic N. Sensors and Actuators, B37, 7-11 (1996)
- Schmidt, H., J. Not cryst. Ground, 73, 681- 691 (1985)
- Mr. Haug. & Al. Sensors and Actuators. B11, 383-391 (1993)
- Schierbaum, K. D. & Al. Sensors and Actuators. B,18-19, 448-452 (1994)
- Grate, J.W., Tablosky, A.V., Polym. Eng. Sci., 10, 225-227 (1970)
- 6. Scherbaum, K.D., Gerlach, A., Haugh, M., Endres, E., Gopel, W. , Sensors and Actuators A, 31, 130-137 (1992)
- Sakai, Y., Sadaoka, Y., Matsugushi, M., Moriga, N., Shimada, M., Sensors and Actuators B, 16, 359-367 (1989)
- Brecht, A., Ingenhoff, J., Gauglitz, G., Sensors and Actuators B, 6, 96-100 (1992)
- Blyler, L.L., Lieberman, JR.R., Cohen, L.G., Ferrara, J.A., Macchesney, J.B., Polymer Eng.Sc., 29 (17), 1215-1218 (1989)
- Kaiser, A., Schmidt, M., J. Memb. Sci., 22, 257-268 (1986)
- Hang, M., Schierbaum, K.D., Gauglitz, G., Gopel, W., Sensors and Actuators B, 11 383-391 (1993)
- Grate, J.W., Abraham, M.H., Sensors and Actuators B, 3, 85-111 (1991) 13. Abraham, M. H. , Grellier, P.L., Mcgill, R.A., Doherty, R.M. , Kamlet, M.J., Hall, T.N., Taft, R.W., Polymer, 28, 1363-1369 (1987)

This work is licensed under a Creative Commons Attribution 4.0 International License.


