

Manuscript accepted on : 03-July-2019
Published online on: 29-06-2019
Plagiarism Check: Yes
Reviewed by: Rajamanikkam K.
Shahabuddin Ahmed1, Touhidur Rahman Anik1, Ashraful Islam2, Imtiaz Uddin*2 and Mohammad S. Haque1
1Department of Biotechnology, Bangladesh Agricultural University, Mymensingh, Bangladesh.
2Biotechnology Division, Bangladesh Division Institute of Nuclear Agriculture, Mymensingh, Bangladesh.
Corresponding Author E-mail: imtiazukm@gmail.com
DOI : http://dx.doi.org/10.13005/bbra/2753

ABSTRACT: Salinity is one of the major abiotic stresses, which adversely affects the crop productivity. Thirty rice genotypes of diverse origin including three salt tolerant check varieties, Binadhan-8, Binadhan-10 and Pokkali, were used to evaluate salt tolerance at seedling stage and to determine the genetic diversity using microsatellite markers. Salinity screening was done at the seedling stage using hydroponic system following IRRI standard protocol. Three salinity levels as 6dSm-1, 8dSm-1, and 10dSm-1 were used along with control. Data were recorded on root length, shoot length and dry weight and the genotypes were scored based on modified standard evaluation score (SES) for visual injury. Sixteen SSR markers were used to study the genetic variation within 30 rice genotypes. A total of 65 alleles with an average of 4.06 allele per locus were detected among 30 rice genotypes. The polymorphism information content (PIC) value ranged from 0.24 to 0.86 with an average of 0.51. The unweighted pair group method with arithmetic mean (UPGMA) dendrogram revealed four clusters. Among them cluster I identified 5 salt tolerant genotypes and cluster IV separated one tolerant and one moderately tolerant genotype. Based on SES evaluation and molecular analysis genotypes Balam, THDB, Q-31, Ab.Hai, BR-5, FR13A ware salt tolerant; Moulota, Super hybrid, Y-1281, Binadhan-16 were moderate salt tolerant. This information could be useful for selection of suitable genotypes for developing salt tolerant rice variety through molecular breeding.
KEYWORDS: Genetic Diversity; PAGE; PCR; PIC; UPGMA; Salinity; SSR
Download this article as:| Copy the following to cite this article: Ahmed S, Anik T. R, Islam A, Uddin I, Haque M. S. Screening of Some Rice (Oryza sativa L.) Genotypes for Salinity Tolerance using Morphological and Molecular Markers. Biosci Biotech Res Asia 2019;16(2). |
| Copy the following to cite this URL: Ahmed S, Anik T. R, Islam A, Uddin I, Haque M. S. Screening of Some Rice (Oryza sativa L.) Genotypes for Salinity Tolerance using Morphological and Molecular Markers. Biosci Biotech Res Asia 2019;16(2). Available from: https://bit.ly/2NKYNyN |
Introduction
A large part of the world’s population is having rice as a staple food, especially in the East, South, Southeast Asia, tropical Latin America and West Indies. Rice (Oryza sativa) belonging to the family Graminae and subfamily Oryzoidea comprises of two main types: indica and japonica in Asia. The indica type is from tropical and japonica is from temperate and subtropical Asia. Oryza glaberrima originates from inland delta of the Niger River. Nowadays, the Asian species (O. sativa) is cultivated more than the African species (O. glaberrima), mainly for its higher yield potential (Wopereis et al. 2013). In Bangladesh the dominant food crop is rice, accounting for about 75% of agricultural land use. Agriculture sector contributes about 17% to the country`s Gross Domestic Product (GDP) (BBS, 2016). Rice is grown in three seasons (Aus, Aman and Boro) of the year in Bangladesh. Salt stress is one of the major abiotic stresses, which adversely affect the crop productivity (Yasseen et al. 2010; Joseph and Jini 2010). It causes reduction of crop yield and alteration in plant metabolism, including a reduced water potential, ion imbalances and toxicity and sometimes severe salt stress may even threaten survival (Joseph and Jini 2011). So the need of the time is to develop plants with resistance to salinity. Rice is a highly polymorphic crop species with wide geographic distribution (Nemati et al., 2011). Bangladesh is endowed with a great diversity of rice landraces in its vast traditional land area. After green revolution the traditional rice landraces were eliminated majorly by high yielding varieties. In recent scenario abiotic stress tolerance study has much significance due to global warming. Systemic study and characterization of such landraces is important for utilization of appropriate attribute based donors. Landraces of rice played a very important role in the local food security and sustainable development of agriculture, in addition to their significance as genetic resource for rice genetic improvement (Tang et al., 2002).
Simple Sequence Repeats (SSR) can presently be short motif nucleotides (Dhar et al., 2012). DNA fingerprinting using SSR markers is playing an important role to identify gene for salt tolerance. They have become a popular type of codominant molecular marker in genetic analysis and plant breeding application (Choi et al., 2011) and also been useful in integrating genetics, physical and sequence based maps of rice that provides breeders and geneticists with efficient tool to link phenotypic and genotypic variations. SSR or microsatellite markers are proved to be ideal for making genetic maps (McCouch et al., 2002), marker assisting selection (Afiukwa et al, 2016), DNA fingerprinting analysis (Chakravarti et al., 2016) and studying genetic diversity (Roy et al. 2015; Islam et al. 2018) in geno type. These experiments explore and evaluate the pattern and extent of genetic variability and relatedness among 30 rice genotypes at the molecular levels using SSR markers and to help in the identification and differentiation of landraces with different genetic make-up. The generated information will enable maximized selection of diverse parents and selecting appropriate parental genotypes in breeding programme for improving salt tolerance of elite cultivars based on genetic similarity and clustering data together with variations of tolerance to salt.
Materials and Methods
Plant Culture
The experiment was conducted at the Glass House and Biotechnology Laboratory, Bangladesh Institute of Nuclear Agriculture (BINA). Rice genotypes were collected from BINA. A list at Table 1 is given below to mention the name origin and source of 30 genotypes.
Table 1: List of genotypes with their origin and Source of collection.
| Sl. No. | Name of genotypes | Origin | Source of collection |
| 1 | Binadhan-8 | Bangladesh | BINA |
| 2 | BRRI dhan33 | Bangladesh | BRRI |
| 3 | Binadhan-7 | Bangladesh | BINA |
| 4 | Boira-3 | Bangladesh | BINA |
| 5 | Binadhan-17 | Bangladesh | BINA |
| 6 | Depu | Bangladesh | BINA |
| 7 | BRRI dhan28 | Bangladesh | BRRI |
| 8 | THDB | Vietnam | BINA |
| 9 | BRRI dhan29 | Bangladesh | BRRI |
| 10 | Pokkali | India | BINA |
| 11 | Binadhan-10 | Bangladesh | BINA |
| 12 | Exotic-1 | Malaysia | BINA |
| 13 | BINA-MV-20 | Malaysia | BINA |
| 14 | BINA-MV-40 | Malaysia | BINA |
| 15 | PNR-519 | India | BINA |
| 16 | PNR-166 | India | BINA |
| 17 | BRRI dhan46 | Bangladesh | BRRI |
| 18 | BINA-E-02 | Malaysia | BINA |
| 19 | R3027 | China | BINA |
| 20 | FR13A | India | BINA |
| 21 | BRRI dhan39 | Bangladesh | BRRI |
| 22 | BINA-MV-10 | Malaysia | BINA |
| 23 | Y-1281 | Malaysia | BINA |
| 24 | Super hybrid | Bangladesh | BINA |
| 25 | Binadhan-16 | Bangladesh | BINA |
| 26 | BR5 | Bangladesh | BRRI |
| 27 | Moulota | Bangladesh | BINA |
| 28 | Ab. Hai | Bangladesh | BINA |
| 29 | Balam | Bangladesh | BINA |
| 30 | Q-31 | Malaysia | BINA |
Screening of Varieties for Tolerance to Salinity at Seedling Stage
All genotypes were screened for salt tolerance at seedling stage in hydroponic system using in hydroponic, system using International Rice Research Institute (IRRI) standard protocol (Gregorio et al., 1997). Youshida et al. (1976) solution was used as nutrient solution that was renewed every 8 days and was maintained at pH 5.1. The nutrient solution was salinized by adding crude salt to obtain desired EC (6dSm-1, 8dSm-1 & 10dSm-1). The standard evaluation system (SES) of IRRI was followed to assess the visual symptoms of salt toxicity (Gregorio et al., 1997). Initial and final scoring was done at 14th d and 21st d respectively after salinization. Besides root length, shoot length and root / shoot ratio were recorded at three different levels of treatment along with the control. The experiment was laid in completely randomized design with three replications.
Genotyping of Salinity Tolerant Rice Genotypes
Modified CTAB mini prep was used for DNA extraction for 21-day- old seedling (Stein et al., 2001). A total of 46 SSR primer were used covering all 12 chromosomes. Among these, sixteen primers were showed polymorphic. Each PCR carried with 10.0µl reactions containing 2.0 µl 5X Green buffer, 1.2 MgCl2 (10mM), 0.5µl dNTPs (10mM), 0.5µl primer forward, 0.5µl primer reverse, 0.2 µl taq polymerase, 4.1 µl RNase free water and 1.0 µl of each template DNA samples. PCR was maintained as initial denaturation at 940C for 5 min, followed by 35 cycles of denaturation at 940C for 30 sec, annealing at550C for 30 sec extension at 720C for 1.0 min; and final extension by 5.0 min at 720C. Then amplified fragments were separated on 8.0% (w/v) native polyacrylamide gels, those were performed at 70-80V for 1.5-2.5h in 1× TBE [Tris-borate-ethylenediaminetetraacetic acid (EDTA)] buffer, and the gels were stained with ethidium bromide for 25-30 min, kept in dark, and then visualized using an UVPRO (Uvipro platinum, EU) gel documentation unit linked to a PC.
SSR Data Analysis
The size of amplified fragments was measured by comparing the migration of amplified fragments with that of a known size fragments of molecular weight marker, 100 base pair DNA ladder, using Alpha-Ease FC 5.0 software (Alpha Innotech,USA). Genetic diversity of cultivers by SSRs was evaluated with the number of alleles and the polymorphism information content (PIC) value, which is an estimate of the discriminatory power of a SSR marker locus. Statistics shows including the number of alleles per locus, major allele frequency, gene diversity and PIC values were calculated using Power Marker version 3.25. The band profiles for each SSR primer were scored for distinct and reproducible bands as present (1) or absent (0). Jaccard’s similarity coefficient values were selected and dendrogram based on similarity coefficient values were generate using unweighted pair-group method with arithmetic mean (UPGMA) by using the online dendrogram construction utility DendroUPGMA (http:// genomes.urv.es/UPGMA/) (Garcia-Vallvé et al., 1999).
Result and Discussion
Screening of Rice Genotypes for Salinity Tolerance at Seedling Stage
Thirty genotypes of rice seedlings were used for screening salinity tolerance. Salt stress are applied at 7thdays old seedling. After two or three days of salinization, salt stress symptoms were observed. Several symptoms of salt injury like yellowing of leaves, drying of leaves, and reduction in root growth, reduction of shoot growth and stem thickness and in many cases dying of seedlings were detected within 2-weeks continuous salt stress of 6,8,10 dSm-1. Some other symptoms like rolling, tip whitening were also noticed. Above all of these, reduction in leaf area was the first symptom. Salinity suppresses the growth of leaves in the plants and eventually completes cessation of growth and premature senescence of leaves. Overall, the seedlings growth was suppressed under salinity stress. On the other hand, the seedlings in the non-salinized (control) condition showed normal growth over the salinized condition. Salt tolerant seedlings were distinguished from the sensitive seedlings when grown in salinized condition. The salinity tolerant lines showed minor symptoms of salt injury.
Among these 30 genotypes, according to the SES of IRRI, at 6 dSm-1, some genotypes showed highly tolerant (HT) e.g. Binadhan-8, THDB, Pokkali, Binadhan-10, FR13A, Super hybrid, Binadhan-16, BR-5, Moulota, Ab. Hai, Balam and Q-31. The genotypes BRRI dhan29, BRRI dhan46, BINA-E-02, R3027, BRRI dhan39, BINA-MV-10, Y-1281 was tolerant (T) and rest of the genotypes were moderately tolerant (MT). Whereas, at 8 dSm-1, 12 of them found as tolerant (T), 7 were moderately tolerant (MT) and rest of the genotypes were susceptible (S). At 10 dSm-1, 9 of them found as tolerant (T), 4 were moderately tolerant (MT), 6 were susceptible (S) and rest of them were highly susceptible (HS). The performance of these genotype under at different salinize conditions is given at Figure 1.
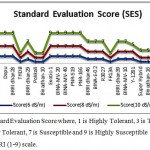 |
Figure 1: Standard Evaluation Score where, 1 is Highly Tolerant, 3 is Tolerant, 5 is Moderately Tolerant, 7 is Susceptible and 9 is Highly Susceptible followed by IRRI (1-9) scale.
|
Rice plant showed various degrees of growth responses to the salinity (Table 2). BRRI Dhan29 (25%) showed greater shoot length reduction under the salinity stress (at 6 dSm-1), while Pokkali (1%), Binadhan-10(3%), Binadhan-8 (4%), THDB (4%), Q-31 (4%), Balam (5%) showed lowest shoot length reduction. At 8 dSm-1 salinity stress, Binadhan-7 (35%) and BRRI Dhan29 (33%) showed greater shoot length reduction. On the other side, Binadhan-8 (5%), Binadhan-10 (5%), Q-31 (5%), BR-5 (6%), Pokkali (7%) and Balam (7%) showed the lowest shoot reduction. Besides, BRRI Dhan29 (38%), Depu (37%), Binadhan-7 (37%) and BRRI Dhan33 (36%) showed greater shoot length reduction under the salinity stress at 10 dSm-1 where Binahana-10 (7%), Binadhan-8 (8%), Pokkali (10%),Q-31 (10%), Moulota (12%) and Ab. Hai (13%) showed the lowest shoot reduction. These results indicated that shoot length reduced under the salinity stress. High salinity stress reduces leaf area by inducing osmotic stress and hampers shoot growth (Eti et al., 2018). Another cause of reduced shoot length under saline stress may be the inhibition of calcium loading in the symplastic xylem by salt in the root (Läuchli and Grattan, 2007). Reduced shoot length was also reported by Maiti et al. 2006; Bhowmik et al. 2009; Islam et al. 2009; Dhar et al. 2012; Radi et al. 2013.
Table 2: Shoot length and its reduction (%) in 30 rice genotypes upon salinity stress compared with control condition at seedling stage.
| Sample name | Shoot length (Control) cm | 6 dSm-1 saline stress | 8 dSm-1 saline stress | 10 dSm-1 saline stress | |||
| Shoot length (cm) | Reduction (%) | Shoot length (cm) | Reduction (%) | Shoot length (cm) | Reduction (%) | ||
| Binadhan-8 | 55.33 | 53.33 | 4% | 52.33 | 5 | 50.66 | 8 |
| BRRI dhan33 | 52.33 | 48.67 | 7% | 42.33 | 19 | 33.67 | 36 |
| Binadhan-7 | 48.86 | 43.33 | 11% | 31.67 | 35 | 30.67 | 37 |
| Boira-3 | 52.66 | 48.16 | 9% | 44.66 | 15 | 40.86 | 22 |
| Binadhan-17 | 58.33 | 54.66 | 6 | 49.66 | 15 | 33.33 | 43 |
| Depu | 71.5 | 66.66 | 7 | 61.33 | 14 | 45.33 | 37 |
| BRRI dhan28 | 46.67 | 40.66 | 13 | 33.66 | 28 | 31.67 | 32 |
| THDB | 68.67 | 65.66 | 4 | 61.66 | 10 | 59.33 | 14 |
| BRRI dhan29 | 50 | 37.33 | 25 | 33.33 | 33 | 31 | 38 |
| Pokkali | 61.67 | 61.33 | 1 | 57.33 | 7 | 55.66 | 10 |
| Binadhan-10 | 51.33 | 49.66 | 3 | 49 | 5 | 47.86 | 7 |
| Exotic-1 | 62.86 | 57.33 | 9 | 51.66 | 18 | 47.33 | 25 |
| BINA-MV-20 | 56.33 | 50.33 | 11 | 45.33 | 20 | 35.66 | 37 |
| BINA-MV-40 | 53.66 | 48.66 | 9 | 40.86 | 24 | 35.33 | 34 |
| PNR-519 | 61.33 | 57.86 | 6 | 53.33 | 13 | 42.66 | 30 |
| PNR-166 | 55.66 | 50.66 | 9 | 39.33 | 29 | 36.66 | 34 |
| BRRI dhan46 | 50.86 | 45.86 | 10 | 40.33 | 21 | 35.33 | 31 |
| BINA-E-02 | 49.66 | 41.66 | 16 | 41.33 | 17 | 38 | 23 |
| R3027 | 53.5 | 48.33 | 10 | 42.67 | 20 | 37.5 | 30 |
| FR13A | 65.66 | 59.86 | 9 | 59.33 | 10 | 56.66 | 14 |
| BRRI dhan39 | 44.33 | 39.33 | 11 | 34.33 | 23 | 30.66 | 31 |
| BINA-MV-10 | 50.16 | 44.86 | 11 | 40.66 | 19 | 36.86 | 27 |
| Y-1281 | 53.33 | 48.86 | 8 | 45.86 | 14 | 40.5 | 24 |
| Super hybrid | 39.67 | 35.66 | 10 | 34.33 | 13 | 31.66 | 20 |
| Binadhan-16 | 47.86 | 44.66 | 7 | 40.67 | 15 | 36.33 | 24 |
| BR-5 | 49.5 | 46.33 | 6 | 46.67 | 6 | 42.66 | 14 |
| Moulota | 67.86 | 62.66 | 8 | 59.66 | 12 | 55.67 | 18 |
| Ab. Hai | 70.33 | 65.66 | 7 | 64.67 | 8 | 61.33 | 13 |
| Balam | 59.67 | 56.66 | 5 | 55.33 | 7 | 51.33 | 14 |
| Q-31 | 57.33 | 55 | 4 | 54.66 | 5 | 50.33 | 12 |
| LAD(0.05) | 3.13 | 3.21 | ———- | 3.25 | ———- | 3.43 | ———- |
Among 30 rice genotypes, root length was also decreased due to salt stress (Table 3). Some genotypes showed higher root length reduction e.g. BINA-MV-20 (22%) and BINA-MV-10 (15%) at 6 dSm-1. On the other hand, lower root length reductions were observed in THDB (1%), Binadhan-8 (2%), Pokkali (2%), Ab. Hai (4%), BR-5 (5%), Superhybrid (5%), FR13A (5%), Balam (6%) at 6 dSm-1 salt treatment. Binadhan-10 (-1%) showed negative reduction at dSm-1 salinity stress. At 8 dSm-1, Boira-3(33%), BINA-MV-40 (31%) and BINA-MV-20 (30%) showed greater root length reduction where, Binadhan-10 (2%), Binadhan-8 (3%), Pokkali (4%), BINA-E-02 (8%), and Balam (10%) showed lowest reduction. At 10 dSm-1, Binadhan-17 (48%), Boira-3 (46%), BRRI Dhan28 (41%), and BINA-MV-10 (40%) showed greater root length reduction. On the other hand, Binadhan-8 (9%), Binadhan-10 (10%), Pokkali (10%), FR13A (11%), Balam (14%), BR-5 (14%), and Q-31 (16%) showed the lowest root reduction. Salinity decreased the cell size and cell production rate which may be the cause of root length reduction under saline stress (Azaizeh et al., 1992). Similar root length reduction under saline stress was also reported by (Ali et al. 2014; Acosta-Motos et al. 2015; Eti et al. 2018).
Table 3: Root length and its reduction (%) in 30 rice genotypes upon salinity stress compared with control at seedling stage.
| Sample name | Root length (Control) cm | 6 dSm-1 saline stress | 8 dSm-1 saline stress | 10 dSm-1 saline stress | |||
| Root length (cm) | Reduction (%) | Root length (cm) | Reduction (%) | Root length (cm) | Reduction (%) | ||
| Binadhan-8 | 14.66 | 14.33 | 2 | 14.16 | 3 | 13.33 | 9 |
| BRRI dhan33 | 13.33 | 11.86 | 11 | 10.50 | 21 | 9.16 | 31 |
| Binadhan-7 | 13.33 | 12.16 | 9 | 11.16 | 16 | 9.86 | 26 |
| Boira-3 | 12.66 | 11.33 | 11 | 8.50 | 33 | 6.86 | 46 |
| Binadhan-17 | 12.50 | 11.16 | 11 | 9.66 | 23 | 6.50 | 48 |
| Depu | 12.66 | 12.16 | 4 | 11.33 | 11 | 8.33 | 34 |
| BRRI dhan28 | 9.66 | 9.00 | 7 | 7.50 | 22 | 5.66 | 41 |
| THDB | 11.50 | 11.33 | 1 | 10.16 | 12 | 9.88 | 14 |
| BRRI dhan29 | 15.66 | 13.66 | 13 | 12.16 | 22 | 10.66 | 32 |
| Pokkali | 15.50 | 15.16 | 2 | 14.86 | 4 | 14.00 | 10 |
| Binadhan-10 | 14.33 | 14.50 | -1 | 14.00 | 2 | 12.86 | 10 |
| Exotic-1 | 13.66 | 12.33 | 10 | 11.67 | 15 | 9.50 | 30 |
| BINA-MV-20 | 14.66 | 11.50 | 22 | 10.33 | 30 | 9.66 | 34 |
| BINA-MV-40 | 16.66 | 14.33 | 14 | 11.50 | 31 | 10.86 | 35 |
| PNR-519 | 19.66 | 17.50 | 11 | 16.33 | 17 | 14.50 | 26 |
| PNR-166 | 18.86 | 16.66 | 12 | 15.16 | 20 | 12.33 | 35 |
| BRRI dhan46 | 16.66 | 15.33 | 8 | 14.66 | 12 | 12.16 | 27 |
| BINA-E-02 | 15.33 | 13.66 | 11 | 14.16 | 8 | 12.33 | 20 |
| R3027 | 14.33 | 13.50 | 6 | 11.33 | 21 | 10.16 | 29 |
| FR13A | 20.33 | 19.33 | 5 | 18.50 | 9 | 18.00 | 11 |
| BRRI dhan39 | 14.33 | 12.66 | 12 | 11.16 | 22 | 10.33 | 28 |
| BINA-MV-10 | 15.86 | 13.50 | 15 | 11.33 | 29 | 9.50 | 40 |
| Y-1281 | 17.33 | 15.86 | 8 | 14.16 | 18 | 11.50 | 34 |
| Super hybrid | 15.66 | 14.86 | 5 | 13.50 | 14 | 11.33 | 28 |
| Binadhan-16 | 13.66 | 12.33 | 10 | 11.66 | 15 | 9.50 | 30 |
| BR-5 | 14.66 | 13.86 | 5 | 12.66 | 14 | 12.50 | 15 |
| Moulota | 17.66 | 16.33 | 8 | 14.50 | 18 | 13.16 | 25 |
| Ab. Hai | 15.83 | 15.16 | 4 | 13.16 | 17 | 13.33 | 16 |
| Balam | 16.33 | 15.33 | 6 | 14.66 | 10 | 14.00 | 14 |
| Q-31 | 13.33 | 12.16 | 9 | 11.33 | 15 | 11.16 | 16 |
| LAD(0.05) | 1.17 | 0.87 | ———- | 0.78 | ———- | 1.05 | ———- |
Salinity stress reduce biomass accumulation in plants by solidifying the cell wall and altering its structure Sweet et al. (1990). Salinity also disrupt net photosynthesis rate of plant, as a result biomass production hampers significantly. This cause reduced dry weight with the increase of salt stress. So, total dry weight was also affected by salinity and mentioned at Table 4. At 6 dSm-1, Exotic-1 (27%), BINA-MV-40 (25%), BRRI Dhan29 (23%) showed higher dry weight reduction and Moulota (2%), Ab. Hai (4%), Q-31 (5%), Binadhan-8 (5%), Binadhan-10 (5%), BINA-MV-10 (5%), Pokkali (6%), BR-5 (6%), THDB (6%) showed lower weight reduction than rest of the genotypes. At 8 dSm-1, Exotic-1 (45%), BINA-MV-20 (42%), R-3027 (39%), BRRI Dhan29 (38%) showed higher dry weight reduction. At 10 dSm-1, PNR-519 (63%), Binadhan-17 (59%), Depu (55%), PNR-166 (55%), Exotic-1 (54%), BINA-E-02 (50%) showed higher dry weight reduction. On the other hand, Binadhan-8 (12%), pokkali (15%), Binadhan-10 (15%), Moulota (17%), FR13A (18%), Ab. Hai (20%) showed the lowest dry weight reduction. Similar results was also observed by Suplick-Ploense et al. 2002; Hakim et al. 2010; Chunthaburee et al. 2016.
Table 4: Dry Weight and its reduction (%) in 30 rice genotypes upon salinity stress compared with control condition at seedling stage.
| Sample name | Dry weight (Control) gm. | 6 dSm-1 saline stress | 8 dSm-1 saline stress | 10 dSm-1 saline stress | |||
| Dry weight (gm.) | Reduction (%) | Dry weight (gm.) | Reduction (%) | Dry weight (gm.) | Reduction (%) | ||
| Binadhan-8 | 0.42 | 0.4 | 5 | 0.38 | 10 | 0.37 | 12 |
| BRRI dhan33 | 0.39 | 0.35 | 10 | 0.27 | 31 | 0.2 | 49 |
| Binadhan-7 | 0.35 | 0.3 | 14 | 0.25 | 29 | 0.16 | 54 |
| Boira-3 | 0.33 | 0.28 | 15 | 0.22 | 33 | 0.17 | 48 |
| Binadhan-17 | 0.32 | 0.29 | 9 | 0.23 | 28 | 0.13 | 59 |
| Depu | 0.53 | 0.47 | 11 | 0.38 | 28 | 0.24 | 55 |
| BRRI dhan28 | 0.19 | 0.16 | 16 | 0.14 | 26 | 0.14 | 26 |
| THDB | 0.47 | 0.44 | 6 | 0.42 | 11 | 0.39 | 17 |
| BRRI dhan29 | 0.26 | 0.2 | 23 | 0.16 | 38 | 0.15 | 42 |
| Pokkali | 0.33 | 0.31 | 6 | 0.29 | 12 | 0.28 | 15 |
| Binadhan-10 | 0.41 | 0.39 | 5 | 0.38 | 7 | 0.35 | 15 |
| Exotic-1 | 0.56 | 0.41 | 27 | 0.31 | 45 | 0.26 | 54 |
| BINA-MV-20 | 0.33 | 0.27 | 18 | 0.19 | 42 | 0.16 | 52 |
| BINA-MV-40 | 0.24 | 0.18 | 25 | 0.2 | 17 | 0.14 | 42 |
| PNR-519 | 0.41 | 0.35 | 15 | 0.26 | 37 | 0.15 | 63 |
| PNR-166 | 0.31 | 0.26 | 16 | 0.26 | 16 | 0.14 | 55 |
| BRRI dhan46 | 0.28 | 0.22 | 21 | 0.2 | 29 | 0.16 | 43 |
| BINA-E-02 | 0.28 | 0.24 | 14 | 0.21 | 25 | 0.14 | 50 |
| R3027 | 0.38 | 0.33 | 13 | 0.23 | 39 | 0.2 | 47 |
| FR13A | 0.45 | 0.41 | 9 | 0.4 | 11 | 0.37 | 18 |
| BRRI dhan39 | 0.27 | 0.23 | 15 | 0.2 | 26 | 0.15 | 44 |
| BINA-MV-10 | 0.22 | 0.21 | 5 | 0.16 | 27 | 0.13 | 41 |
| Y-1281 | 0.21 | 0.19 | 10 | 0.16 | 24 | 0.15 | 29 |
| Super hybrid | 0.26 | 0.22 | 15 | 0.21 | 19 | 0.18 | 31 |
| Binadhan-16 | 0.23 | 0.2 | 13 | 0.17 | 26 | 0.15 | 35 |
| BR-5 | 0.17 | 0.16 | 6 | 0.14 | 18 | 0.13 | 24 |
| Moulota | 0.42 | 0.41 | 2 | 0.38 | 10 | 0.3 | 29 |
| Ab. Hai | 0.5 | 0.48 | 4 | 0.45 | 10 | 0.4 | 20 |
| Balam | 0.31 | 0.28 | 10 | 0.26 | 16 | 0.23 | 26 |
| Q-31 | 0.39 | 0.37 | 5 | 0.34 | 13 | 0.31 | 21 |
| LAD(0.05) | 0.032 | 0.043 | ———- | 0.023 | ———- | 0.021 | ———- |
From the phenotypic screening it is clearly visible that tolerant genotypes (Binadhan-8, Binadhan-10, Pokkali, Balam, THDB, Q-31, Ab.Hai, BR-5, FR13A) are less sensitive so saline injuries and show higher shoot growth, root growth and biomass compared to susceptible genotypes. The reason behind this behaviour may be that the tolerant genotypes adopted some physiological, morphological or biochemical mechanism to withstand saline injury. This theory was also supported by Peng et al. 1999; Bhowmik et al. 2009; Zhang et al. 2004; Eti et al. 2018.
Molecular Characterization of Rice using SSR Markers
Analysis of genetic diversity is important for rice improvement that can be obtained through DNA fingerprinting techniques, which is capable of exhibiting large number of loci for extensive variability. Genotypes collected from different location and origin ware analysed using a highly repeatable PCR based fingerprinting assay known as Simple Sequence Repeat (SSR) or microsatellites markers.
Allelic and loci Variation Within the Genotypes
SSR markers are widely used for fingerprinting and diversity studies on rice cultivars and wild relatives due to its high polymorphic rates, which can be identified even at individual rates. The microsatellite loci were also polymorphic. Total 65 polymorphic alleles were generated by 16 SSR primers in the studied 30 rice genotypes. The number of polymorphic allele varied from 2 (RM508) to 9 (RM336) with an average of 4.06 allele (Table 5). The bands obtained from other genotypes were compared to the band obtained from salt tolerant variety like Binadhan-8, Binadhan-10 and Pokkali which were used as salt tolerant check verities in this study because these are widely known as salt tolerant. The detailed result which was obtained after analysis of fingerprinting data are briefly presented (Figure 2-5) and discussed below.
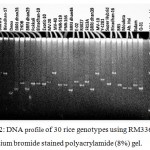 |
Figure 2: DNA profile of 30 rice genotypes using RM336 marker in ethidium bromide stained polyacrylamide (8%) gel.
|
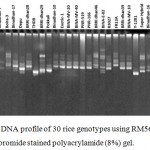 |
Figure 3: DNA profile of 30 rice genotypes using RM562 marker in ethidium bromide stained polyacrylamide (8%) gel.
|
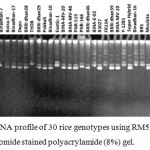 |
Figure 4: DNA profile of 30 rice genotypes using RM594 marker in ethidium bromide stained polyacrylamide (8%) gel.
|
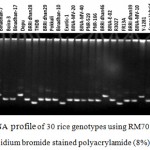 |
Figure 5: DNA profile of 30 rice genotypes using RM7075 marker in ethidium bromide stained polyacrylamide (8%) gel.
|
Genetic Diversity and Major Allele
The highest genetic diversity (0.91) was observed in loci RM336 and the lowest genetic diversity (0.28) was observed in loci RM508 with a mean diversity of 0.56 (Table 5). It was observed that marker detecting the lower number of alleles showed lower genetic diversity than those which detected higher number of alleles which revealed higher genetic diversity (Herrera et al. 2008; Rana et al. 2018). Major allele is defined as the allele with the highest frequency and also known as most common allele at each locus. The size of the different major alleles at different loci ranges from 100bp (RM277) to 312 bp (RM594) (Table 5). On an average, 60 % of the 30 rice lines shared a common major allele ranging from 30% (RM336) to 80% (RM508, RM517, RM7175) at each locus.
Table 5: Data of sample size, major alleles, PIC value, genetic diversity and heterozygosity found among 30 rice genotypes for 16 microsatellites (SSR) markers.
| Marker name | Sample size | Major allele | Number of allele | PIC value | Genetic diversity | |
| Size bp | Frequency (%) | |||||
| RM277 | 30 | 100 | 40 | 4 | 0.59 | 0.62 |
| RM300 | 30 | 114 | 40 | 5 | 0.56 | 0.60 |
| RM314 | 30 | 109 | 50 | 2 | 0.38 | 0.50 |
| RM336 | 30 | 169 | 30 | 9 | 0.86 | 0.91 |
| RM342 | 30 | 147 | 50 | 5 | 0.58 | 0.64 |
| RM484 | 30 | 167 | 70 | 4 | 0.46 | 0.50 |
| RM493 | 30 | 234 | 50 | 5 | 0.65 | 0.69 |
| RM508 | 30 | 218 | 80 | 2 | 0.24 | 0.28 |
| RM517 | 30 | 260 | 80 | 3 | 0.27 | 0.29 |
| RM536 | 30 | 121 | 60 | 3 | 0.40 | 0.49 |
| RM562 | 30 | 237 | 50 | 4 | 0.60 | 0.65 |
| RM594 | 30 | 312 | 50 | 3 | 0.57 | 0.60 |
| RM6659 | 30 | 245 | 40 | 5 | 0.68 | 0.73 |
| RM7075 | 30 | 125 | 70 | 5 | 0.46 | 0.48 |
| RM7175 | 30 | 189 | 80 | 3 | 0.34 | 0.38 |
| RM17954 | 30 | 263 | 40 | 3 | 0.59 | 0.66 |
| Total | ——- | ——- | ——- | 65 | ——- | ——- |
| Mean | ——- | ——- | 60 | 4.06 | 0.51 | 0.56 |
PIC value
Polymorphism information content (PIC) value is a reflection of allele diversity and frequency among the varieties. PIC value of each marker can be evaluated on the basis of its alleles. PIC varied significantly for all the studied SSR loci. In the present study, the level of polymorphism among the 30 rice genotypes were evaluated by calculating PIC values for each of the 16 SSR loci. The PIC values ranged from 0.28 (RM508) to 0.86(RM336) with an average of 0.51 per locus (Table 5). The lowest PIC value observed 0.28 for RM 508. PIC value observed in our study was consistent with the pervious works of Lu et al. 2005; Hossain et al. 2012; Sajib et al. 2012. Considering the PIC value and genetic diversity data RM 336 would be best for screening the studied 30 rice genotypes which is followed by RM6659, RM493, RM17954, RM562, RM342, RM277, RM300 and RM594, which also showed high PIC value and genetic diversity.
Genetic Distance Based Analysis
The values of pair-wise comparisons of Nei (1973) genetic distance between rice genotypes were computed from combined data sets for the three primers ranging from 0.88 to 0.36 (Table 6). Comparatively higher genetic distance genetic (0.88) was observed between Binadhan-8 vs. BINA-MV-40, Binadhan-17 vs. BINA-E-02, BRRI dhan28 vs. FR13A, BINA-MV-20 vs. FR13A, BRRI dhan28 vs. Binadhan-16, THDB vs. Binadahan-16, THDB vs. Pokkali. Pokkali, FR13A and Binadhan-8 are salt tolerant varieties. The lowest genetic distance (0.36) were revealed between Pokkali vs. Binadhan-10 and BINA-MV-10 vs. BRRI dhan39. The smaller number of pair-wise differences (high genetic similarity value) among some rice genotypes were likely due to their genetically relatedness. On the other hand, large number of pair-wise differences (low genetic similarity value) was observed among those rice lines developed from genetically distant parental. According to the relationship of lower genetic distance among the varieties most of them were tolerant.
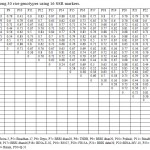 |
Table 6: Summary of genetic distance values among 30 rice genotypes using 16 SSR markers.
|
UPGMA cluster analysis
Dendrogram based on Nei (1973) genetic distance using Unweighted Pair Group Method of Arithmetic Means (UPGMA) indicated differentiation of the 30 rice genotypes (by 16 markers). All 30 rice genotypes could be easily distinguished. The UPGMA cluster analysis led to the grouping of the 30 genotypes in four major clusters I-IV (Figure 6). The UPGMA dendrogram of the 30 rice genotypes were constructed by using Correlation Coefficient (CP) = 0.62. It was observed that the three check variety Binadhan-8, Binadhan-10 and Pokkali along with Balam, Q-31, AB Hai, BR-5, FR13A (which showed salt tolerance in phenotypic screening) formed Cluster I. Cluster II contain 13 genotypes- BRRI Dhan33, Binadhan-16, Super hybrid, BINA-E-02, BRRI Dhan46, Exotic-1, R3027, BINA-MV-40, BINA-MV-20, BINA-MV-10, BRRI Dhan39, PNR-166, PNR-519. Among these 13 genotypes Super hybrid and Binadhan-16 formed an additional cluster within the cluster II. These two genotypes showed moderate salt tolerance. Cluster III contain 7 genotypes- Moulota, Bindhan-7, Depu, BRRI Dhan28, BRRI Dhan29, Boira-3. Except Moulota (which showed moderate salt tolerance in phenotypic screening) rest of the genotypes in this cluster showed moderate to high salt susceptibility in the morphological study. Cluster IV contain only two genotypes- THDB and Y-1281, which showed tolerant and moderate tolerant respectively.
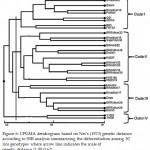 |
Figure 6: UPGMA dendrogram based on Nei’s (1973) genetic distance according to SSR analysis summarizing the differentiation among 30 rice genotypes where arrow line indicates the scale of genetic distance (1.00-0.62).
|
Conclusion
From the analysis, it was found that a total of 61 alleles were detected with an average number of 4 alleles per locus. The PIC values ranged from 0.28 to 0.74 with an average of 0.57. RM277 was the best marker for identification of lines as revealed by PIC values (0.74). The size of the different major alleles at different loci ranges from 100bp (RM277) to 312 bp (RM594). On average, 60% of the 30 rice lines shared a common major allele ranging from 30% (RM277) to 80% (RM5508, RM517, RM7175) common allele at each locus. According to Nei’s, (1973) the highest gene diversity (0.74) was observed in loci RM277 and the lowest gene diversity (0.28) was observed in loci RM508 with a mean diversity of 0.57. From the above the study, the following recommendations can be made: Balam, THDB, Q-31, Ab.Hai, BR-5, FR13A ware salt tolerant; Moulota, Super hybrid, Y-1281, Binadhan-16 were moderate salt tolerant and these genotypes could be utilized to develop salt tolerant rice varieties with all desirable characters. So this research can be used to identify traditional more land races from saline prone region of Bangladesh. This molecular characterized information could be helpful to the breeders for further planning of rice breeding program to improve breeding rice for salinity tolerance.
Acknowledgements
The authors acknowledge the cooperation of the Department of Biotechnology, BAU, Mymensingh, Bangladesh. We gratefully acknowledge the assistance of the Biotechnology Division, BINA, Mymensingh, Bangladesh in conducting this research work at the Biotechnology Laboratory and for technical support. We would like to express our appreciation to GRC, Bangladesh Rice Research Institute (BRRI) for their cooperation in providing the seed samples.
Conflict of Interest
There is no conflict of interest.
References
- Acosta-Motos J.R., Ortuño M.F., Bernal-Vicente A., Diaz-Vivancos P., Sanchez-Blanco M.J., Hernandez J.A. Plant Responses to Salt Stress: Adaptive Mechanisms. 2015; 7(1): 18.
- Afiukwa C.A., Faluyi J.O., Atkinson C.J., Ubi B.E., Igwe D.O., Akinwale R.O. Screening of some rice varieties and landraces cultivated in Nigeria for drought tolerance based on phenotypic traits and their association with SSR polymorphisms. J. Agric. Res. 2016; 11(29): 2599-2615.
- Ali M., Yeasmin L., Gantait S., Goswami R., Chakraborty S. Screening of rice landraces for salinity tolerance at seedling stage through morphological and molecular markers. Mol. Biol. Plants.; 2014 20(4): 411–423.
- Azaizeh H., Gunes B., Steudle E. Effects of NaCl and CaCl2 on water transport across root cells of maize (Zea mays ) seedlings. Plant Physiol. 1992; 99: 886-894.
- BBS (Bangladesh Bureau of Statistics). Yearbook of Agricultural Statistics-2016, 28th Series, Bangladesh Bureau of Statistics (BBS) Statistics and Informatics Division (SID) Ministry of Planning. 2016; Pp33-36.
- Bhowmik K., Titov S., Islam M.M., Siddika A., Sultana S., Haque M.D.S. Phenotypic and genotypic screening of rice genotypes at seedling stage for salt tolerance. J. Biotechnol. 2009; 8(23): 6490-6494.
- Chakravarthi B.K., Naravaneni R. SSR marker based DNA fingerprinting and diversity study in rice (Oryza sativa. L). J. of Biotechnol. 2016; 5(9): 684-688.
- Choi W.Y., Lee K.S., Ko J.C., Choi D.Y., Kim T.S. Critical concentration of saline water for rice cultivation on a reclaimed coastal soil in Korea. Rice Res. Notes. 2011; 28(1): 54-55.
- Chunthaburee S., Dongsansuk A., Sanitchon J., Pattanagul W., Theerakulpisut P. Physiological & biochemical parameters for evaluation and clustering of rice cultivars differing in salt tolerance at seedling stage. Saudi J. BioL. Sci. 2016 23(4): 467–477.
- Dhar P., Ashrafuzzaman M., Begum S.N., Islam M.M., Chowdhury M.M.H. Identification of salt tolerant rice genotype and their genetic diversity analysis using SSR marker. J. of Biosci. 2012; 2(9): 45-50.
- Eti I., Rasel M., Hassan L., Ferdausi A. Morphological based screening and genetic diversity analysis of the local rice (Oryza sativa ) landraces at the seedling stage for salinity tolerance. 2018; J. Biosci. Agric. Res. 18(01): 1496-1511.
- Garcia-Vallvé S, Palau J, Romeu A. Horizontal gene transfers in glycosyl hydrolases inferred from codon usage in Escherichia coli and Bacillus subtilis. Biol. Evol.1999; 16:1125–1134.
- Gregorio G.B., Senadhira D., Mendoza R.D. Screening rice for salinity tolerance. IRRI Discussion Paper Series no. 22. Manila (Philippines): International Rice Research Institute. 1997; Pp.1-30.
- Hakim M.A., Juraimi A.S., Begum M., Hanafi M.M., Ismail M.R., Selamat A. Effect of salt stress on germination and early seedling growth of rice (Oryza sativa ). Afr. J. Biotechnol. 2010; 9(13): 1911-1918.
- Herrera G., Dunia P.D., Iris P.A., Gelis T.N., Alejandro P., Cesar P.M., Joe M.T. Assessment of genetic diversity invenezuelan rice cultivars using simple sequence repeats markers. J. Biotechnol. 2008; 11:5.
- Hossain M.M., Islam M.M., Hossain H., Ali M.S., Teixeira da Silva J.A., Komamine A., Prodhan S.H. Genetic diversity analysis of aromatic landraces of rice (Oryza sativa ) by microsatellite markers. Genes, Genomes and Genomics, 2012; 6(SI1): 42-47.
- Islam M.A., Anik T.R., Hossain M.M., Uddin M.I., Ahmed M.S. Genetic diversity analysis of some Bangladeshi aromatic rice (Oryza sativa ) using simple sequence repeat markers (SSRM). Arch. Agric. Env. Sci. 2018; 3(3): 297-303.
- Islam M.M., Hoque M.A., Okuma E., Banu M.N.A., Shimoishi Y., Nakamura Y., Murata Y. Exogenous proline and glycinebetaine increase antioxidant enzyme activities and confer tolerance to cadmium stress in cultured tobacco cells. Plant Physiol. 2009; 166: 1587–1597.
- Joseph B., Jini D., Sujatha S. Biological and physiological perspectives of specificity in abiotic salt stress response from various rice plants. Asian J. Agric. Sci. 2010; 2(3): 99-105.
- Läuchli A. and Grattan S. Plant growth and development under salinity stress. In Jenks M.A., Hasegawa P.M. and Jain S.M. (Eds.), Advances in molecular breeding toward drought and salt tolerant crops. Springer. 2007; 132.
- Lu H., Redus M.A., Coburn J.R., Rutger J.N., McCouch S.R., Tai T.H. Population structure and breeding patterns of 145 US rice cultivars based on SSR marker analysis. Crop Sci. 2005; 45: 66-76.
- Maiti R.K., Vidyasagar P., Banerjee P.P. Salinity tolerance in rice (Oryza sativa) hybrids and their parents at emergence and seedling stage. Crop Res. 2006; 31(3): 427-433.
- McCouch S.R., Teytelman L., Xu Y., Lobos K.B., Clare K., Walton M., Fu B., Maghirang R., Li Z., Xing Y., Zhang Q., Kano I., Yano M., Fjellstrom R., De Clerk G., Schneider D., Cartinhour S., Ware D., Stein L. Development and mapping of 2240 new SSR markers for rice (Oryza sativa ). DNA Res. 2002; 9(6): 199-207.
- Nei M. Analysis of gene diversity in subdivided populations. Natl. Acad. Sci. USA. 1973; 70: 395-401.
- Nemati F. Moradi S., Esmaeili M.R. The effect of salinity stress on ions and solublke sugars distribution in leaves, leaf sheath and roots of rice seeding. Plant Soil Environ. 2011; 57(1): 26-33.
- Peng S., Cassman K.G., Virmani S.S., Sheehy J., Khush G.S. Yield potential trends of tropical rice since the release of IR8 and the challenge of increasing rice yield potential. Crop Sci. 1999; 39: 1552-1559.
- Radi A.A., Farghaly F.A., Hamada A.M. Physiological and biochemical responses of salt-tolerant and salt-sensitive wheat and bean cultivars to salinity. Biol. Earth Sci., 2013; 3(1): B72-B88.
- Rana M.M., Islam M.A., Imran S., Ruban S.,Hassan L Genetic diversity analysis of NERICA lines and parents using SSR markers. J. Plant Soil Sci. 2018; 23(6): 1-10.
- Roy S., Banerjee A., Mawkhlieng B., Misra A.K., Pattanayak A., Harish G.D. Genetic diversity and population structure in aromatic and quality rice (Oryza sativa ) landraces from North Eastern India. PLoS ONE. 2015; 10(6): e0129607.
- Sajib A.M, Hossain M.M., Mosnaz A.T.M.J., Hossain H., Islam M.M., Ali M.S., Prodhan S.H. SSR marker-based molecular characterization and genetic diversity analysis of aromatic landraces of rice (Oryza sativa ). J. Bios. Biotechnol. 2012; 1(2): 107-116.
- Stein N., Herren G., Keller B. A new DNA extraction method for high-throughput marker analysis in a large- genome species such as Triticumae stivum. Plant Breed. 2001; 120(4): 354-356.
- Suplick P.M.R., Qian Y.L., Read J.C. Salinity tolerance of Texas bluegrass, Kentucky bluegrass, and their hybrids. Crop Sci. 2002; 42: 2025-2030.
- Sweet W.J., Morrison J.C., Labaritch J.M., Matthews M.A. Altered synthesis and composition of cell wall of grapevines Vitis vinifera during expression and growth inhibiting water deficits. Plant Cell Physiol. 1990; 31: 407-414.
- Tang S.X., Jiang Y.Z., Wei X.H., Li Z.C., Yu H.Y. Genetic diversity of isozymes of cultivated rice in china. Agron. Sin. 2002; 28: 203-207.
- Wopereis M.C.S., Defoer T., Idinoba P., Diack S., Dugué M.J. Participatory Learning and Action Research (PLAR) for Integrated Rice Management (IRM) in Inland Valleys of Sub-Saharan Africa: Technical Manual. WARDA Training Series. Cotonou, Benin: Africa Rice Center. 2013; Pp. 26.
- Yasseen B.T., Basal M.A., Alhadi F.A. An analysis of leaf growth under osmotic stress. Plant Sci. 2010; 5:391-401.
- Yoshida S., Forno D.A., Cook J.H., Gomez K.A. Laboratory manual for physiological studies of rice. International Rice Research Institute (IRRI), Los Baños, Laguna, Philippines. 1976; Pp. 61-66.
- Zhang Z.H. Li P., WangL .X., Hu Z.L., Zhu L.H., Zhu Y.G. Genetic dissection of the relationships of biomass production and partitioning with yield and yield related traits in rice. Plant Sci. 2004; 167: 1-8.

This work is licensed under a Creative Commons Attribution 4.0 International License.


