

Manuscript accepted on : 27 June 2018
Published online on: 30-06-2018
oil Yieldof Peppermint under Salt Stress
Samandari Gikloo T1, Mehrabi A. A1, Jahanbakhsh S2, Fazeli A1 and Tahmasebi Z1
1Department of Agronomy and Plant Breeding, University of Ilam, Ilam, Iran.
2Department of Agronomy and Plant Breeding, University of Mohaghegh Ardabili, Ardabil, Iran.
Corresponding Author E-mail: Tayebe_samandrai@yahoo.com
DOI : http://dx.doi.org/10.13005/bbra/2644

ABSTRACT: Peppermint (Menthapiperita L.) is aneconomically important medicinal and aromatic plant grown in different areas worldwide. Secondary metabolites were fundamentally produced by genetic processing;however, environmental factors affect their biosynthesis. Salinity is the most important abiotic stress which induces morphological, physiological, and biochemical changes in plants.To investigate the influence of salinity stress (0, 25, 50, 75, 100 and 125 mMNaCl)on chlorophyll content, stomatal conductance, relative water content (RWC), proline, Na+ and K+ content, antioxidant enzymes of catalase (CAT), peroxidase (POX) and polyphenol oxidase (PPO), protein, essential oil yield and dry weight of peppermint, a greenhouse study was conducted. The results indicated that salinity had a significant effect on foregoing parameters. Changes in chlorophyll content werepeak and stomata conductivity was a single function. Based on estimations, the highest chlorophyll contentwas recorded for low salinity (60 mMNaCl).The plant proline content was higher in stress condition compared tocontrol plants. The highest proline content observed in 125mM NaClconcentration was two times higher than that of control plants.There was an increase and then decrease in CAT and POX activities, respectively, in lower and sever levels of salinity.A single equation was the best-fit equation for changing PPO enzyme activity under stress conditions.The dry matter has been affected dramatically by salinity and decreased from 11.34g under the non-stress condition to 4.24 g under high stress condition. Essential oil percentage (in dry matter) increased in moderate salinity stress. We found that the amount of essential oil per plant was linearly decreased. So, the highest (9.78 g plant-1) amount of essential oil per plant belonged to control group and the lowest (4.6 g plant-1) wasobserved for full stress condition.
KEYWORDS: Chlorophyll; Essential Oil; Enzyme; Peppermint; Proline; Salt Stress
Download this article as:| Copy the following to cite this article: Gikloo S. T, Mehrabi A. A, Jahanbakhsh S, Fazeli A, Tahmasebi Z. Investigation of Physiological and Biochemical Responses and Essential oil Yieldof Peppermint under Salt Stress. Biosci Biotech Res Asia 2018;15(2). |
| Copy the following to cite this URL: Gikloo S. T, Mehrabi A. A, Jahanbakhsh S, Fazeli A, Tahmasebi Z. Investigation of Physiological and Biochemical Responses and Essential oil Yieldof Peppermint under Salt Stress. Biosci Biotech Res Asia 2018;15(2). Available from: https://www.biotech-asia.org/?p=30034 |
Introduction
One of the economically important medicinal and aromatic plants grown in different areas in the world is Peppermint (Menthapiperita L.) (Yazdani et al., 2002). The plant’s leaves have traditionally been used as a spice, and its essential oil is widely used in food,cleaning, pharmaceutical, and cosmetic industries as it is both flavoring and fragrant (Herroand Jacob, 2010).Menthol, menthone, methylacetat, menthofuran and pulegone are among fundamental components of peppermint essential oil (Tabatabaie and Nazari, 2007; Mahmoud and Croteau, 2003).
Genetic processing is the basic mechanism through which secondary metabolites are produced in the medicinal and aromatic plants; however, environmental factors strongly affect their biosynthesis(Aydan et al., 2002(. Biotic and abiotic environmental factors affect growth parameters, essential oil yield, and in gredients (Aziz et al., 2008; Clarkand Menary, 2008). Particularly, salt stress can significantly affect plants’morphology, physiology, and biochemistry(Khorasaninejad et al., 2010;Queslati et al., 2010). Salinity may result in >60%decrease in crops’ potential yield (Munns, 2002;Tutejaet al., 2013).
High amounts of salt in the environment will disrupt the homeostatic balance of water potential and ion distribution within a plant. Sodium toxicity may elicit a wide array of disorders that affect development, germination,protein synthesis,photosynthesis, lipid metabolism, leaf chlorosis, and senescence (Santhi et al., 2013). Salinity induces oxidative stress in plant through increased production of reactive oxygen species (ROS). Plants have developed complicated defense mechanisms against oxidative stress, which includes regulation of antioxidant enzymes activity, scavenging ROS, and adjusting ionic and osmotic levels (Ashraf and Harris, 2004). Antioxidant enzymes such as peroxidase (POX), superoxide dismutase (SOD), and catalase (CAT) play an important role in defense against oxidative stress (Alscher et al., 2002).
To minimize ionic toxicity, plants establishionic compartments within cells or excrete ions. They alsoincrease cellular levels of somatically compatible solutes, such as proline, to maintain ionic homeostasis and stabilize proteins in saline conditions(Oo et al., 2015; Limet al., 2015; Ibrahim et al., 2015). Although the effects of salinity on traditional crops have been the subject of extensive research,that is not the case for medicinal plants (Aghaei and Komatsu, 2013). Santhi et al. (2013) showed that biosynthesis of secondary metabolites is affected strongly by salt stress, resulting in considerable fluctuations in essential oil quality and quantity. Aziz et al. (2013) reported that essential oil under salt stress was reduced in Peppermint, Pennyroyal and apple mint, as compared with untreated control group which was not under salt stress. In a research carried out by Roodbari et al. (2013), it was found that an increasing in the salinity lead to reduction in length of shoot and root, fresh weight of stem and root, dry weight of stem and root, internodes length, total biomass and essential oil percentin Peppermint. The highest values of growth parameters and essential oil percentage were observed under non-salinity condition (Roodbari et al., 2013).Ozkan and Baydar (2016) concluded that salinity deceases the content of essential oil, but increases lipid peroxidation, proline, and antioxidant enzyme activities. Xu et al. (2016) reported that salinity resulted in increases in malondialdehyde and proline contents in the aerial parts and roots of peppermint and thistle, although chlorophyll content was not affected. They also found a decrease in potassium (K+)/sodium (Na+) and total soluble protein content in the aerial parts and roots in both species. This present research was designed to understand the effects of salinity stress on biochemical and physiological characteristics of peppermint and also on the synthesis of essential oil in this plant. Investigating of peppermint tolerance and physiological responses to different salinity levels was another object of this paper.
Method and Material
Plant Material and Growth Condition
This was a green house experiment with a randomized complete block design. Experimental treatments involved six levels of salinity stress made by pureNaClat 0, 25, 50, 75, 100 and 125 mM concentrations.
Each pot was filled with 0.5 kg perlite and nutrient with Hoagland’s solution.Chemical characteristics of the Hoagland’s solution are shown in Table 1 (Noroozi, 2001). Two-week seedlings with 3-4 true leaves were transferred to pot.The nutrient solution wasaerated continuously and replaced every two days. After 20 days, for the salt treatments, soluble NaCl was added to the culture medium until the salt concentrations reached the final level.
Table 1: Select chemical characteristics of the Hoagland’s solution used in the experiment
| Stock Solution (mg/L) | Component |
| Macro Nutrient | |
| 738 | Ca(NO3)2.4H2o |
| 464.6 | KNO3 |
| 180.75 | MgSO4 |
| 369.75 | MgSO4.7H2o |
| 198.4 | KH2Po4 |
| 34.28 | NH4.NO3 |
| Micro Nutrient | |
| 1.8 | MnCl2.4H2o |
| 2.2 | ZnSO4.7H2o |
| 2 | H3BO2 |
| 0.01 | Na2MoO4.2H2o |
| 4 | Iron |
| 1.2 | CuSO4.5H2o |
Assay of Chlorophyll and Stomatal Conductance
The total chlorophyll content was determined by using a chlorophyll-meter device (SPAD model 502, Minolta, Japan) after applying the treatments and before harvesting. In such a way, the measurement was carried out from the bottom, middle, and upper parts of each plant.
Stomatal conductance was recorded by Leaf porometer device (eijkelkamps model, Nether lands). Clamps of device attached to the leaves and the continuous air flow through the stomata was measured.
Assay of Osmotic Adjustment Parameters
We used 2 leaves (detached from same position) per plant to determine relative water content (RWC).The leaves were cut and the petioles were immediately immersed in distilled water in pre-weighed glass tubes.The tubes were sealed and taken to the laboratory and weighed; the new weight of each tube was used to determine leaf fresh weight (FW). The leaves were left for 48 h in dim light and were weighed again to measure their turgid weight (TW). Then, dry weight (DW) was determined after oven-drying at 80◦C for 48 h, and RWC was calculated as follows:
RWC = 100 × (FW – DW)/(TW – DW)
Proline content was determined spectrophotometrically using ninhydrin with the adopted mixture method from Iqbal et al. (2015). Fresh leaf tissues (0.1 mg) were homogenized in 2 mL of 3% sulphosalicylic acid. Then centrifuged with 4000 rpm for 10 min at room temperature. 1mL of acid ninhydrin and 1mL of glacial acetic acid was added to 1mL of supernatant and the reaction was carried for 1 h in a test tube placed in a water bath at 100°C. Finally, 2mL of toluene was added to each mixture for extraction. Upper part of the mixture was extracted with toluene and the absorbance was measured in the spectrophotometer (model: 2100UV, UNICO, USA) at 520 nm.
Na+ and K+ content were determined using Borgan’s (2006) method. Initially, 1 g of dried leaf tissue was dry-ashed in an electric furnace at 500°C for 4 h. Then, 10 mLof 1 N hydrochloric acid was added to each sample and heated to boiling point until it was completely evaporated.Then 10 mLof distilled water was added to each one of the samples, and they were placed on the heater, then removed as soon as they start boiling. Finally, their volume was made up to 50 mL by using distilled water, and flame spectrometer was used to measure concentration of elements.
Antioxidant Enzyme Assays
Antioxidant enzymes were extracted from frozen leaf tissues as described in Sabra et al. (2012). Frozen leaf tissue (0.2 g)was crushed into a fine powder using pestle and mortar and then homogenized with 5 mL of 100 mM K-phosphate extraction buffer (pH= 7.0) containing 1 mM EDTA.Na2 and 1% poly-vinyl-pyrrolidone (PVP). The homogenates were centrifuged at 14000 rpm for 20 min at 4°C.The supernatant was collected and stored at −20 °C until analysis.
The CAT activity was determinated as described by Sabra et al. (2012) with monitoring the disappearance of H2O2. The reaction was initiated by adding 50 µl of enzyme extract to 1.5 mL of reaction mixture containing 50 mM K-phosphate buffer (pH= 7.0), and 15 mM freshly prepared H2O2. The decrease in absorbance was measured at 240 nm for 1 min, and the degradation of 1 µmol H2O2 per min was defined as one unit of CAT.The POX activity was measured based on the method of the Aganchich et al. (2007). For this measuremet, 100 µL sample was added to 1 mL of 20 mM sodium phosphate buffer(pH=7) which contained 276 µL of guaiacol per 50 mL buffer. The reaction was initiated by adding 200 µL of 0.03% H2O2 to distilled water (w/w). The reaction was mixed and the absorbency of the solutions at 470 nm was measured after 2 min using a spectrophotometer. The PPO activity was measured according to Aganchich et al. (2007). The reaction mixture was contained 200 µL of enzyme extract, 2 mL of catechol 1% and 1.8 mL of 0.05 M sodium phosphate buffer (pH=7). The reaction mixture was absorbed and was measured after 2 min at410 nm.
Total protein measurement
Protein was estimated according to Bradford et al. (1976) method. This method used 0.2 g of frozen leaf tissues and mixed with 1.2 ml Tris-HCl buffer (pH=7.5), homogenized and centrifuged at 14,000 rpm for 20 min at 4°C. Bradford reagent was added to the supernatant and the absorbance was measured at 595 nm. For the last two measurements, standard solution were constructed by using BSA (bovine serum album in, concentration of 0.1 – 1%) and the absorbance was measured on the spectrophotometer.
Essential oil
Essential oil content was determined through hydrodistillation by submitting 100g of aerial part of dried plants toa modified Clevenger apparatus (Ozturk et al. 2004). After 3 hours of distillation,essential oil ratio was measured by using dry yield (biomass yield) of peppermint.
Statistical Analysis
The mean values for all parameters were obtained from three replications, and the standard error of the means was calculated. Two-way ANOVA and Duncan’s test were used to compare the significance of the mean values of treatments. Data were analyzed with SPSS 16 (SPSS Inc., Chicago, IL, USA) and Sigma Plot v. 11 was used for calculating the type of regression equation. R2, R2adj and RMSE were applied to determine the best estimates of the parameters. R2 was determined by following formula:
R2= SSR/SST
Where SSR denotes the sum of squares (SS) for regression
![]()
and SST denotes the total SS
![]()
Li is the observed value and Ḹ is the corresponding estimated value:
![]()
Where N is number of observation, k number of parameter.

Where Yobs denotes observed value, Ypredis predicted value, andn is the number of samples.Following equations were used for:
1- f =y0+a*exp (-b*x)
a = max parameter, b = slope and yo= constants.
2- f=a*exp(-.5*((x-x0)/b)^2)
a = max parameter, b = slope and x0= salinity dose that provides max parameter.
3- f=y0+a*exp(-.5*((x-x0)/b)^2)
a = max parameter, b = slope and x0= salinity dose that provides max parameter and yo= constants (Archontoulis and Miguez, 2013).
Result
Chlorophyll content and Stomata conductivity
Experiment results showed that salinity had a significant effect on chlorophyll content and stomata conductivity of peppermint leaves (Fig. 1). Changes in chlorophyll content under salinity stress were peak function. Moderate stress increased chlorophyll content, thus highest chlorophyll content (31.77) was recorded by NaCl 60mM (Table 2). Salinity reduced stomata conductivity of peppermint leaves. Single equation regression was the best fit for stomata conductivity changes under salinity condition. The stomata conductivity was 41.29 µmol.m-2.s-1 under non-stress condition (NaCl=0), and decreased by a slope of 0.021 and reached 8.11 µmol.m-2.s-1 under full stress (Table 2).
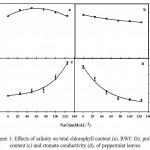 |
Figure 1: Effects of salinity on total chlorophyll content (a), RWC (b), proline content (c) and stomata conductivity (d), of peppermint leaves.
|
Data are means of three replications and vertical bars indicate Standard Error. Mean values with different letters are significantly different by the Duncan test (P≤0.01).
Table 2: Estimates parameter function for total chlorophyll, stomata conductivity, RWC and proline content of peppermint under salinity stress condition
| Estimates parameter | Function equation | Characteristics | |||||
| RMSE | Radj | R2 | X0 or y0 | b | a | ||
| 0.64 | 0.91 | 0.94 | 60.5± 2.6 | 107.43± 7.3 | 31.77± 0.41 | f=a*exp(-.5*((x-x0)/b)^2) | Chlorophyll |
| 2.61 | 0.96 | 0.98 | 8.06 ± 3.9 | -0.02± 0.005 | 41.37± 4.14 | f=y0+a*exp(-b*x) | Stomatal |
| 0.60 | 0.99 | 0.99 | 70.62± 4.3 | -0.008± 0.002 | 95.19± 4.15 | f=y0+a*exp(-b*x) | RWC |
| 0.10 | 0.97 | 0.98 | 0.80± 0.11 | 0.02± 0.005 | 2.65± 2.04 | f=y0+a*exp(b*x) | Proline |
Osmotic Adjustment
RWC and proline content of peppermint leaves were affected significantly by salinity stress (Fig. 1).Plants grown under salinity condition had higher proline and lower RWC than plants grown under non-stressful condition. RWC change was single under stress condition, thus salinity reduced RWC by a slope of 0.008 and loss RWC to79.08% under salinity 125 mM (Table 2).
Salinity stress caused increasingin proline content witha single equation (Fig.1). Highest proline content (2.62 µg per g FW-1) was observed in salinity level of 125 mM which demonstrated approximately three fold over control (Table 2).
As expected, salinity significantly affected Na+ and K+ contents of peppermint leaves. Changes of these element contents were consistent with the single equation (Fig. 2). Salinity increased Na+ content from 6.54 mg per g DW-1 under non-stress condition by a slope of 0.028 to 24.68 mg per g DW-1 under stressful condition (125 mM) (Table 3). Also, salinity reduced K+ content by a slope of 0.014 and from 21.56 mg per g DW-1 to 10.06 mg per g DW-1 (Table 3).
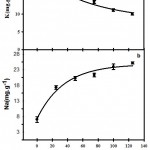 |
Figure 2: Effects of Salinity on K+ (a) and Na+ (b) content of peppermint.Data are means of three replications.
|
Mean values with different letters are significantly different at P = 0.01 (the Duncan test).
Table 3: Estimates parameter function for Na+ and K+ elements content of peppermint under salinity stress condition
| Estimates parameter | Function equation | Characteristics | |||||
| RMSE | Radj | R2 | X0 or y0 | b | a | ||
| 1.18 | 0.96 | 0.98 | 6.84± 1.16 | 0.028± 0.006 | 17.46± 1.52 | f=y0+a*(1-exp(-b*x)) | Na+ |
| 0.8 | 0.96 | 0.97 | 8.22± 2.32 | 0.014± 0.005 | 12.96± 2.17 | f=y0+a*exp(-b*x) | K+ |
Antioxidant Enzyme Activity
Moderate stress increased the activities of CAT and POX in peppermint; while the trend was decreasing for higher levels of salinity stress. Based on the estimations, the highest activity of CAT and POX enzymes were observed at 54.28 mM and 53.19 mM of salinity, respectively, and the least activity was observed in control treatment (Fig. 3). For both enzymes, low concentration of salinity resulted in increased enzyme activity and by increasing the salinity concentration, a reduction in the activity of enzymes was observed.The activity of PPO revealed an increasing trend with increasing of NaCl concentration.The single equation was the best-fit equation for this enzyme activity changes under stress conditions. The lowest activity detected in control condition. Salinity increased the activity of PPO by a slope of 0.017 and reached the highest content (65.39 µmol per mg protein -1 min-1) in the salinity level of 125 mM (Table 4).
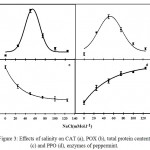 |
Figure 3: Effects of salinity on CAT (a), POX (b), total protein content (c) and PPO (d), enzymes of peppermint.
|
Data are means of three replications and vertical bars indicate Standard Error. Mean values with different letters are significantly different at P = 0.01 (the Duncan test).
Table 4: Estimates parameter function for total protein content, PPO, CAT and POX enzymes activity of peppermint under salinity stress condition
| Estimates parameter | Function equation | Characteristics | |||||
| RMSE | Radj | R2 | X0 or y0 | b | a | ||
| 0.05 | 0.99 | 0.99 | 1.23± 0.04 | 0.031± 0.002 | 2.86± 0.06 | f=y0+a*exp(-b*x) | Protein |
| 1.57 | 0.99 | 0.99 | 16.15± 1.52 | 0.017± 0.002 | 54.24± 3.00 | f=y0+a*(1-exp(-b*x)) | PPO |
| 0.012 | 0.95 | 0.98 | 54.28± 2.01 | 14.89± 1.86 | 0.15± 0.014 | f=y0+a*exp(-.5*((x-x0)/b)^2) | CAT |
| 0.021 | 0.88 | 0.95 | 53.19± 3.54 | 23.71± 5.36 | 0.15± 0.021 | f=y0+a*exp(-.5*((x-x0)/b)^2) | POX |
Protein content
Total protein content was significantly affected by salinity stress (Fig.3). The single equation was a suitable equation for the process of changes in total protein content. The highest protein content was observed in non-stress condition (4.2 mg per g FW-1). That decreased and dropped to 1.23 mg per g FW-1 under stressful condition (125 mM) (Table 4).
Dry weight and Essential oil
The results showed that growing peppermint plants under salinity condition had a significant effect on dry weight; essential oil percentage and oil yield (Fig. 4). Salinity resulted in decreased dry weight of peppermint and decreasing had a single equation. Dry weight was 11.34 g under non-stress condition; salinity caused a decreasing by a slopeof 0,014 and the dry weight reached to 4.24 g under stressful condition (125mM) (Table 5).
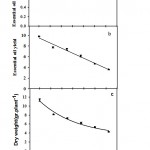 |
Figure 4: Effects of salinity on dry weight (a), essential oil percentage (b) and essential oil yield (c) of peppermint.
|
Data are means of three replications. Mean values with different letters are significantly different at P = 0.01 (the Duncan test).
Table 5: Estimates parameter function for dry weight, essential oil percentage and essential oil yield of peppermint under salinity stress condition.
| Estimates parameter | Function equation | Characteristics | |||||
| RMSE | Radj | R2 | y0 | b | a | ||
| 0.48 | 0.96 | 0.97 | 3.28± 1.37 | 0.014± 0.005 | 7.83± 1.28 | f=y0+a*exp(-b*x) | Dry weight |
| 0.009 | 0.98 | 0.99 | 53.36± 1.4 | 27.58± 2.64 | 0.18± 0.01 | f=y0+a*exp(-.5*((x-x0)/b)^2) | Essential oil |
| 0.36 | 0.97 | 0.97 | 9.50 0.26± | -0.04± 0.003 | – | f = y0+a*x | Oil yield |
During the experimental period, moderate salinity stress increased essential oil percentage; however, changes in the essential oil percentage in peppermint leaves followed peak trend (Fig. 4). Maximum essential oil was 1%, which was related to 53.36 mM salinity. The minimum essential oil 0.85% was related to stressful condition (Table 5). We found a significant decrease in essential oil yield in peppermint due to salinity stress. Change in oil yield was linear, thus resulted in highest (9.78 g plant-1) and lowest (4.6 g plant-1) oil yield observation in non-stress and full stress condition, respectively (Fig.4).
Discussion
Previous research has showed that salinity affects differentaspects of plant metabolism, inhibiting nitrogen uptake (Hawkins andLewis, 1993),water uptake (Koyro, 2006),ion distribution (Rogers andNoble, 1997), mineral assimilation(Keutgen and Pawelzik, 2009),secondary metabolite production (Chen et al., 2014), stomatal conductance and photosynthesis (Turan et al., 2009 and 2010), and plant growth and yield (Muhling and Lauchli, 2002).We showed in this study that the physiology of peppermint plant was affected slightly by moderate levels of salinity; however, server salinity stress influenced dramatically the different physiological processes of treated plants.
We found that peppermint plants grown under stressful condition produced poor dry weight compared to non-stress and moderate stress condition (Fig. 4). According to the reports, the reduction indry weight under saline stressmay be attributable to the inability of the plant to absorb water and nutrients and to suppression of growth during the early developmental stages (Roodbari et al., 2013; Eziz et al., 2013). Also, salinity inducesosmotic stress, specific ion toxicity, and ionic imbalances, reducing the plant growthor causing plants to die(Ҫoban and Baydar, 2016).
Salt stress is believed to decreasechlorophyll content (Turan et al., 2009); however, in our experiments, chlorophyll content was initially increased in 50mM NaCl concentration and then reduced. The higher chlorophyll content is associated with the higher tolerance for salt stress (Shirazi et al.,2009). Chlorophyll biosynthesis is the crucial factor to achieve oxygenic photosynthesis (Tsukatani and Masuda, 2015). Fariduddin et al. (2013) argued that reduction of chlorophyll content under salinity stress might be due to the increased activity of chlorophyll-degrading enzyme (chlorophyllase), the decreased uptake of Mg element, or the stomatal closure. Also, salinity resulted in leaf yellowing, browning, and falling, which was correlated with NaCl concentrations.Most plants treated with 125 mMNaCldied. High-NaCl–induced plant death has been reported for peppermint (Ҫoban and baydar, 2016).
Contents of different elements, as another physiological response,were changed in salinity stress. In addition, K+ and Na+ contents provide useful measures for assessing salinity-associated damage. High concentrations ofsalt in the external solution disturb ionic balance and ion homeostasis (Parida and Das, 2005). There is a competition between Na+ and K+, which leads to a reduction in the level of internal K+ at high concentrations ofexternal NaCl and results in increased Na+ increase in plant tissue (Rus et al., 2004; Kaya et al., 2007). Potassium uptake is influenced by NaCl and leadsto increased Na+/K+ ratio, which in turn inhibits plant growth and causes ionic toxicity (Cuin et al., 2003). In our study,increased NaCl concentration significantly decreasedpotassium uptake and increasedNa+/K+ ratio. Sodium-associated impairment of potassium uptake of K+ is believed to be the result of chemical similarities between these ions (Borsani et al., 2003). Prolineserves as an energy supply, has antioxidant properties, and exertsosmotic effects as well (Chookhampaeng, 2011). It is postulated that prolinemay contribute to stabilization of DNA, protein, and membrane structure and function (Kavi Kishor et al., 2005). This might be the reason for the observed increases in proline contentin plants in response to stress factors. We found that proline content in plants grown under stress condition were dramatically higher compared with plants grown under control condition (Fig. 1). There fore, it can be concluded that higher proline accumulation may be associated with increased stress tolerance. Our finding is consistent with the previous observations that high salinity results in increased proline content (Gorai et al., 2010; El-Danasoury et al.,2010).
Plants have multiple mechanisms for stress tolerance. Change in soluble protein content is one important response to salt stress (Ghorbanli et al., 2012). The soluble protein content of peppermint decreased with increasing the level of salinity stress, suggesting a dose-dependent inhibition of protein synthesis (Fig. 3). This actually may be quite reasonable because plantsmay have to limit energy expenditure under salinity stress (Huang et al., 2013).
Plants use enzymatic and non-enzymatic antioxidant to response to salinity stress (Ҫoban and Baydar, 2016). Based on our results, moderate stress increased the activities of CAT and POX in peppermint; however,severe stress decreased those activities. Also, the activity of PPO revealed an increasing trend with increasing of the NaCl cocentration. Ibrahim et al. (2015) reported that antioxidant enzymes such as CAT, POX, and PPO can scavenge ROS under salt tolerance. Anincrease in antioxidant enzymes of wheat under stress condition was reported by Gong et al. (2005). El-Danasoury et al. (2010) reported similar results intheir experiments on M. piperita. Super oxide radicals, the toxic products of oxidative metabolism, may interact with H2O2 to form highly reactive hydroxyl radicals that are thought to be primarily responsible for oxygen toxicity in the cell (Uchida et al., 2002). Other studies reported that the process of transformation of H2O2 into molecular oxygen and water is catalyzed by the CAT enzyme found in peroxisome and cytosol (Gill and Tuteja, 2010); and this CAT enzyme protects cells from oxidative effects of H2O2 and OH radicals.
Essential oils comprise a wide range of secondary metabolites. In our study,salt stress caused an initial increase in essential oil content at low salinity,but then significantly decreased essential oil content (Table 5). This seems to be due to peppermint tolerance in low salinity and essential oil role as a defensive compound.Then,with increasing NaCl concentration, the peppermint lose tolerance and essential oil biosynthesis process is plagued. Tabatabaie et al. (2007), Aziz et al. (2008), and Khorasaninejad et al. (2010) also reported significant decreases in total essential oil content in peppermint plants stressed with NaCl compared with the controls. These results support the notion that higher NaCl concentrations suppress essential oil biosynthesis in peppermint. As suggested by Aziz et al. (2008), reduced essential oil content could be a consequence of a reduction in photosynthesis rate or additional changes in metabolic systems. Any disruption inmetabolic functions could impairoil biosynthesis,resulting in reducedessential oil content (Srivastava et al., 1998).We hypothesized that peppermint was semi-tolerant to salinity stress. The results obtained in this study indicated that plants grown under lower NaCl concentration had the similar dry weight and essential oil yield to the plant grown under non-stress condition.
Conclusion
In summary, results obtained in this study indicated that peppermint is not a salinity tolerant medicinal plant. However, in moderate salinity, it is possible to grow it for harvesting dry weight and essential oil yield.
References
- Aganchich B, H. Tahi, S.Wahbi, C. Elmodaffar and R.Serraj. . Growth, water relations and antioxidant defence mechanisms of olive subjected to partial root drying (PRD) and regulated deficit irrigation (RDI). Plant Biosystems. 2007;141: 252-264.
CrossRef - Aghaei K. and S. Komatsu. Crop and medicinal plants proteomics in response to salt stress. Front Plant Sci. 2013;4. in press.
CrossRef - Alscher RG, Erturk N, Heath LS. Role of superoxide dismutases (SODs) incontrolling oxidative stress in plants. J. Exp. Bot. 2002;53:1331–1341.
CrossRef - Archontoulis S.V. and F.E.Miguez. Nonlinear Regression Models and Applications in Agricultural Research. Agronomy Journal. 2013;105:1-13.
- Ashraf, M. and P.J.C. Harris. Potential biochemical indicators of salinity tolerancein plants. Plant Sci. 2004;166:3–16.
CrossRef - Aziz E.A, S.T. Hendawi, E.E.D. Azza and E.A. Omer. Effect of Soil Type and Irrigation Intervals on Plant Growth, Essential Oil and Constituents of Thymus vulgaris. Plant. Amrican-Eurasian J. Agric.Environ. Sci. 2008;4(4):443-450.
- Aziz E.E, H. Al-Amier and L.E. Craker. Influence of salt stress on growth and essential oil production in peppermint, pennyroyal, and apple mint. J. Herbs Spices Med. Plants. 2008;14:3–9.
CrossRef - Borgan J. C. Flame photometric determination of calcium in plants. Journal of Sciences Food and Agriculture. 2006;11:446-449.
CrossRef - Borsani O, V. Valpuesta and M.A.Botella. Developing salt tolerant plants in a new century: a molecular biology approach. Plant Cell Tissue and Organ Culture. 2003;73: 101-115.
CrossRef - Bradford M.M. A rapid and sensitive method for the quantitation of microgram quantities of protein utilizing the principle of protein-dye binding. Analytical Biochemistry. 1976;72: 248-254.
CrossRef - Chen Y, F.Z. Lin, H. Yang, L. Yue, F. Hu, J.L. Wang, Y.Y. Luo and F.L. Cao. Effectof varying NaCl doses on flavonoid production in suspension cells of Ginkgobiloba: relationship to chlorophyll fluorescence, ion homeostasis, antioxidantsystem and ultrastructure. Acta Physiol. Plant. 2014;36:3173–3187.
CrossRef - Chookhampaeng, S. . The effect of salt stress on growth chlorophyll contentproline content and antioxidant enzymes of pepper (Capsicum annum L.) seedling. Eur. J. Sci. Res. 2011;49;(1):103–109.
- Clark R.J and R.C. Menary. Environmental Effects on Peppermint (Menthapiperita L.). II.Effects of Temperature on Photosynthesis, Photorespiration and Dark Respiration in Peppermint with Reference to Oil Composition. Australian J. Plant Physiol. 2008;7(6): 693-697.
CrossRef - Cuin T.A, A.J. Miller, S.A. Laurie and R.A. Leigh. Potassium activities in cell compartments of salt-grown barley leaves. Journal of Experimental Botany. 2003;54:657-661.
CrossRef - E-Aziz E, H. Al-Amier and L. E-Craker. Influence of Salt Stress onGrowth and Essential Oil +Production in Peppermint, Pennyroyal, and Apple Mint. Journal of Herbs, Spices and Medicinal Plants. 2013;14:1-2.
- El-Danasoury, M., H. Al-Amier, A. El-Din Helaly, E.E. Aziz and L. Craker. Essential oil and enzyme activity in spearmint under salt stress. J. Herbs SpicesMed. Plants. 2010;16:136–145.
CrossRef - Fariduddin Q, R.R. Khalil B.A. Mir,M. Yusuf and A. Ahmad. 24-epibrassinolide regulates hotosynthesis, antioxidant enzyme activities and proline content of cucumissativus under salt and/or copper stress. Environ.Monit. Assess. 2013;185(9):7845-7856.
CrossRef - Ghorbanli M, M. Gafarabad, T. Amirkian and B.A. Mamaghani. ‘Investigation of proline, total protein, chlorophyll, ascorbate and dehydroascorbate changes under drought stress in Akria and Mobil tomato cultivars’. Iranian Journal of Plant Physiology. 2013;3;(2):651-658.
- Gill, S.S. and N.Tuteja. Reactive oxygen species and antioxidant machinery inabioticstres tolerance in crops. Plant Physiol. Biochem. 2010;48:909–930.
CrossRef - Gong H, X. Zhu, K. Chen, S. Wang and C. Zhang. Silicon alleviates oxidative damage of wheat plants in pots under drought. Plant Sci. 2005;169: 313–321.
CrossRef - Gorai M, M. Ennajeh, H.Khemira and M.Neffati. Combined effect of NaCl-salinity and hypoxia on growth photosynthesis, water relations andsolute accumulation in Phragmitesaustralis plants. Flora. 2010;205:462–470.
CrossRef - Hawkins, H.J. and O.A.M. Lewis. combination effect of NaCl salinity, nitrogen form and calcium concentration on the growth and ionic content and gaseous properties of triticumaestivum L. cv. Gamtoos. New phytologist. 1993;124:161-170.
CrossRef - Herro E. and S.E. Jacob. Menthapiperita (peppermint). Dermatitis. 2010;21(6):327–329.
- Huang Z.R, L. Zhao, D.D. Chen, M.X. Liang, Z.P. Liu, H.B. Shao and X.H. Long. . Salt stress encourages proline accumulation by regulating prolinebiosynthesisand degradation in Jerusalem artichoke plantlets. PLoS One. 2013;8(4):62085.
CrossRef - Ibrahim M.M, E.K. Mahmoud and D.A. Ibrahim. Effects of vermicompostand water treatment residuals on soil physical properties and wheat yield. Int. Agrophys. 2015;29:157-164.
CrossRef - Iqbal N, S.A. Umar and N. Khan. Nitrogen availability regulates proline and ethylene production and alleviates salinity stress in mustard (Brassica juncea). Journal of Plant Physiology. 2015;178: 84–91.
CrossRef - Kavir-Kishor P.B, S. Sangam, R.N.Amrutha, P. Sri-Laxmi, K.A. Naidu, S. Rao-KRSS-Rao, K.J. Reddy and N. Sreenivasulu. Regulation of proline biosynthesis degradation, uptake and transport in higher plants: Its implication in plant growth and abiotic stress tolerance. Curr. Sci. 2005;88(3):424-438.
- Kaya C, A.L. Tuna, M. Ashraf and H.Altunlu. Improved salt tolerance of melon (Cucumismelo L.) by the addition of proline and potassium nitrate. Environmental and Experimental Botany. 2007;60:397-403.
CrossRef - Kayro, H.W. Effect of Salinity on Growth, Photosynthesis, Water Relations and Solute Composition of the Potential Cash Crop Halophyte Plantagocoronopus (L). Environ Exp Bot. 2006;56:136–146.
CrossRef - Keutgen A.J. and E. Pawelzik. Impact of NaCl stress on plant growth and mineral nutrient assimilation in two cultivars of strawberry. Environ. Exp. Bot.2009;65:170–176.
CrossRef - Khorasaninejad S, A. Mousavi, H.Soltanloo, K. Hemmati and A.Khalighi. Theeffect of salinity stress on growth parameters, essential oil yield andconstituent of peppermint (Menthapiperita L.). World Appl. Sci. J. 2010;11;(11):1403–1407.
- Lim S.L, T.Y. Wu, P.N. Lim and K.P.Y. Shak. The use of vermicompost in organicfarming: overview, effects on soil and economics. J. Sci. Food Agric. 2015;95:1143–1156.
CrossRef - Mahmoud S.S. and R.B.Croteau. Menthofuran Regulates Essential oil Biosynthesis inPeppermint by Controlling a Downstream Monoterpene Reductase. Institute of Biological Chemistry,Washingston State University, Pullman. 2003;100:14481-14486.
- Muhling K.H. and A.Lauchli. Effect of salt stress on growth and cationcompartmentation in leaves of two plant species differing in salt tolerance. J.Plant Physiol. 2002;159:137–146.
CrossRef - Munns, R. Comparative physiology of salt and water stress. Plant Cell Environ. 2002;25(2): 239-250.
CrossRef - Noroozi, M. Hydroponic. Publication of Mohaddes. 2001.
- Oo A.N, C.B. Iwai and P.Saenjan. Soil properties and maize growth in salineandnonsaline soils using cassava-industrial waste compost and vermicompostwith or without earthworms. Land Degrad. Dev. 2015;26:300–310.
CrossRef - Ozturk A. A. Unlukara, A.Ipek and B.Gurbuz. Effects of Salt Stress and Water Deficit on Plant Growth and Essential oil Content of Lemon Balm (Melissa officialis L.). Pak. J. Bot. 2004;36(4):787-792.
- Parida A.K. andA.B. DasSalt.tolerance and salinity effects on plants. A review Ecotoxicology and Environmental Safety. 2005;60:324-349.
CrossRef - Queslati, S., N.Karray-Bouraoui, H.Attia, M.Rabhi, R.Ksouri and M.Lachaal. Physiological and antioxidant responses of Menthapulegium (Pennyroyal) tosalt stress. Acta Physiol. Plant. 2010;32;(2):289–296.
CrossRef - Raschke K. Stomatal Responses to Pressure Changes and Interruptions in the Water Supply of Detached Leaves of Zea mays L.’Plant Physiol. 1970;45:415-423.
CrossRef - Rogres M.E, C.L. Noble, G.M. Halloran and M.E. Nicolas. Selecting for salt tolerance in white clover (Trifoliumrepens): chloride ion exclusion and its heritability. New phytoligy. 1997;135:645-654.
CrossRef - Roodbari N, S.Roodbari, A.Ganjali, F Sabeghinejad and M.Ansarifar. The Effect of Salinity Stress on Growth Parameters and Essential oil percentage of Peppermint (MenthapiperitaL.). International journal of Advanced Biological and Biomedical Research. 2013;1(9):1009-1015.
- Rus A, B. Lee, A. Muñoz-Mayer, A.Sharkhuu, K. Miura, J.K. Zhu, R.A.Bressan and P.M.Masegawa. AtHKT1 facilitates Na+ homeostasis and K+ nutrition in plants. Plant Physiology. 2004;136:2500-2511.
CrossRef - Sabra A, F. Daayf and S. Renault. Differential physiological and biochemical responses of three Echinacea species to salinity stress. ScientiaHorticulturae. 2012;135:23–31.
CrossRef - Santhi, M., S. Muthulakshmi1, G.Gurulakshmi and S.Rajathi. Effect of Salt Stress on Physiological and Biochemical Characteristics in Solanumnigrum L. International Journal of Science and Research. ISSN (Online): 2013;2319-7064.
- Shirazi M.U, M.Y. Ashraf, M.A. Khan and M.H. Naqvi. Potassium induced salinity tolerancein wheat. Int J Environ Sci Technol. 2005;2:233–66.
CrossRef - Srivastava P.K, M. Gupta, R.K.Upadhyay, S. Sharma, N.Shikha-Singh, K.Tewari and B. Singh. Effects of combined application of vermicompost and mineralfertilizer on the growth of Allium cepa L. and soil fertility. J. Plant Nutr. Soil Sci. 2012;175:101–107.
CrossRef - Tabatabaie J. and J.Nazari. Influence of Nutrient Concentrations and NaCl Salinity on the Growth, Photosynthesis and Essential oil Content of Peppermint and Lemon Verbena. Turk J. Agric. For. 2007;31:245-253.
- Tabatabaie S.J, J. Nazari, H.Nazemiyeh, S.Zehtab and F.Azarmi. Influence of various electrical conductivity levels on the growth and essential oil content of peppermint (MenthapiperitaL.) grown in hydroponic. ActaHorticult. 2007;747:197–201.
- Tsukatani Y. and S. Masuda. Elucidation of genetic backgrounds necessary for chlorophyll a biosynthesis toward artificial creation of oxygenic photosynthesis. Orig.Life Evol. Biosph. 2015;1-3.
CrossRef - Turan M.A, A.H.A. Elkarim, N.Taban and S.Taban.. Effect of salt stress ongrowth, stomatal resistance, proline and chlorophyll concentrations on maizeplant. Afr. J. Agric. Res. 2009;4:893–897.
- Turan M.A, A.H.A. Elkarim, N.Taban and S. Taban. Effect of salt stress ongrowth and ion distribution and accumulation in shoot and root of maizeplant. Afr. J. Agric. Res. 2010;5:584–588.
- Tuteja N, R.K. Sahoo, B.Garg and R. Tuteja. Ossuv3dual helicase functions in salinity stress tolerance by maintaining photosynthesis and antioxidant machinery inrice (Oryza sativa L. Cv. Ir64). Plant J. 2013;76(1): 115-127.
- Uchida A, A.T. Jagendorf, T. Hibino, T.Takabe and T.Takabe. Effects ofhydrogen peroxide and nitric oxide on both salt and heat stress tolerance inrice. Plant Sci. 2002;163;(3):515–523.
CrossRef - Xu L, D. Yan, X. Ren, Y. Wei, J. Zhou, H. Zhao and M. Liang. Vermicompost improves the physiological and biochemical responsesof blessed thistle (SilybummarianumGaertn.) and peppermint (MenthahaplocalyxBriq) to salinity stress. Industrial Crops and Products. 2016.94: 574–585.
- Yazdani D, H. Jamshidi and F.Mojab. Compare of Essential oil Yield and Menthol Existent in Peppermint (Menthapiperita L.) Planted in Different Origin of Iran. Journal of Medicinal Plants of Medicinal Plant Institute of Jahaddaneshgahi. 2002;3:73-78.
- Ҫoban, O. andN. Göktürk-Baydar. .Brassinosteroid effects on some physical and biochemical properties and secondary metabolite accumulation in peppermint (Menthapiperita L.) under salt stress. Industrial Crops and Products. 2016;86: 251–258.
CrossRef

This work is licensed under a Creative Commons Attribution 4.0 International License.


