

Manuscript accepted on : 06 February 2018
Published online on: --
Rao C. N. Rachaputi1 , Guta Motuma Bedane2, Ian James Broad3 and Kurt Sepp Deifel1
1Queensland Alliance for Agriculture and Food Innovation (QAAFI), The University of Queensland, Australia.
2School of Agriculture and Food Sciences, The University of Queensland, Gatton campus, Queensland, Australia.
3Department of Agriculture and Fisheries (DAF), Toowoomba, Queensland, Australia.
Corresponding Author E-mail: rao.rachaputi@uq.edu.au
DOI : http://dx.doi.org/10.13005/bbra/2605

ABSTRACT: The pigeonpea (Cajanus cajan) is grown between the 45oN and 45oS as a summer food legume, and consumed by billions of people in the world. Recent renewed interest from Australian growers prompted the current study to evaluate high-yielding varieties and develop agronomic parameters for this crop. Performance of four selected pigeonpea genotypes were assessed under three row spacing (25, 50 and 100 cm) treatments and at one plant density (30 plants/m2) in two diverse Australian environments (Kingaroy and Gatton) in Queensland. Decreasing row spacing from 100cm to 25cm led to a linear increase in mean shoot dry matter (DM) at both sites. However, maximum grain yields of up to 2.9 t/ha were achieved at 50cm row spacing but the yields declined at 25cm spacing at both sites. Genotypic variation for radiation use efficiency (RUE) measured at Gatton site ranged from 1.40 to 1.76 g/MJ, which accounted for 76% of variation in DM. There was a significant effect of site and genotype on grain N and 100-seed mass. The study demonstrated that pigeonpea could be grown as a legume break crop in subtropical Australia, with potential export market opportunities.
KEYWORDS: Genotype; Grain Yield; Pigeonpea; Row Spacing;Radiation Use Efficiency Shoot Dry Matter;
Download this article as:| Copy the following to cite this article: Rachaputi R. C. N, Bedane G. M, Broad I. J, Deifel K. S. Genotype, Row Spacing and Environment Interaction for Productivity and Grain Quality of Pigeonpea (Cajanus Cajan) in Sub-Tropical Australia. Biosci Biotech Res Asia 2018;15(1). |
| Copy the following to cite this URL: Rachaputi R. C. N, Bedane G. M, Broad I. J, Deifel K. S. Genotype, Row Spacing and Environment Interaction for Productivity and Grain Quality of Pigeonpea (Cajanus Cajan) in Sub-Tropical Australia. Biosci Biotech Res Asia 2018;15(1). Available from: https://www.biotech-asia.org/?p=28996 |
Introduction
The pigeonpea (Cajanus cajan (L.) Millspaugh] is a perennial legume from the family Fabaceae. It is believed to be originated from India1 with some 13 wild species endemic to Australia.2 Over millions of years of domestication, it is now grown as an annual food and fodder crop in Asia, Africa, and Latin America. The crop ranks sixth in the world in dryland legume production, with also a forage yield of greater than other legumes and grasses when used for livestock production.3 Pigeonpea is cultivated on about 6.23 million hectares globally with India accounting for around 70% of the total global production followed by Myanmar, Malawi, Kenya and Tanzania.4,5,6
Although India is the largest producer, the average national yield remains less than 1 ton/ha,7 while grain yield of up to 3 t/ha has been reported in other parts of the world.8,9
Pigeonpea grain is an excellent source of protein (20-22%), specifically enriched with amino acids that are often limiting in the human diet, including methionine, lysine, and tryptophan10 and consumed by more than billion people globally, as a source of vegetable protein.
Relative to other legume crops, pigeonpe a is tolerant to drought and heat, being able to retain a minimum productivity levels in the regions with less than 650 mm annual rainfall.11 However, the response to irrigation was found to be substantial in some genotypes.12 Pigeonpea can fix atmospheric nitrogen and is noted for its adaptability to diverse soils.13 Its deep tap root with abundance of root organic matter is known to improve soil structure, nutrients turnover and soil water storage.
In Australia, the University of Queensland (UQ) had implemented a pigeonpea breeding program for the first time in the 1970’s and 1980’s,14,15 to explore the development of photo-insensitive, short duration and high yielding varieties that were amenable for mechanical cultivation. However, pigeonpea industry could not be sustained due to lack of awareness about optimum agronomic practices, including the integrated pest management practices amongst growers, and lack of market support, and thus, the varieties released by UQ in 1980’s were confined for use as a mandated trap crop in Australian cotton production to help reduce the likelihood of Helicoverpa (pod borer) developing resistance to Bt cotton16 and as a fodder crop.17 However, there has been a renewed interest in Australian grain industry to identify appropriate high yielding pigeonpea genotypes due to rising global demand and asses their fit in the Australian cropping systems. The broad adaptation of pigeonpea to the Australian cotton cropping regions, and it’s resilience to extreme climate variability, makes this crop a potential summer legume option where existing legumes are poorly adapted or not profitable. However, there have been limited studies in Australia on assessing potential productivity of pigeonpea as food crop in the northern grains region.
The objective of this study was to assess the seasonal yield potential of four selected pigeonpea genotypes under two diverse sub-tropical environments in Australia. The study examines the genotype (G) x environment (E) x management (M) interaction for shoot dry matter (DM), grain yield (Yld), harvest index (HI), 100 seed mass, fractional intercepted radiation (f), photosynthetically active radiation use efficiency (RUE), nitrogen content in shoot dry matter (SNC) and grain nutrient profile (GN).
Materials and Methods
Crop Management
The four genotypes of pigeonpea were selected from a total of 10, introduced from the International Crops Research Institute for the Semi-Arid Tropics (ICRISAT), following the Australian bio-safety regulations. The four genotypes (Pcv1, Pcv2, Pcv3 and Pcv4) were selected based on their thermal time to maturity, agronomic traits, which included plant height, yield, seed size, and thermal time to maturity, for further studies. A two-site field experiment was conducted at Gatton (27.55° S 152.33° E) and Kingaroy (26.55° S and 151.85° E) locations in Queensland, Australia. The soil at Kingaroy is red-ferrosol (red soil) while that of Gatton site was a self-mulching cracking clay (vertisol). Planting was done using a mechanical planter on 5/12/2016 at Kingaroy and 12/1/2017 at Gatton. Prior to planting, seeds were treated with Group “J” Rhizboium and planted in three row-spacing treatments, 25, 50 and 100 cm, at a rate of approx. 300,000 plants/ha, in a randomised complete block design with three replications. The plot size was 15m L × 2 m W at Kingaroy, while it was 12m L × 2m W at Gatton. A basal fertilizer of 13.5N:15P:12.5K: 1.2S was applied mechanically in the seeding row at the time of planting. The crop received two supplementary irrigations of 25mm each at 31-1-17 and 14-2-17 at Kingaroy, and 13-1-2017 and7-2-2017 at Gatton. A post-emergence herbicide (verdict ®) was applied to control grasses at Kingaroy, while at Gatton, a pre-emergence herbicide “Pendimethalin” and a post-emergent herbicide “Imazapic” were applied using a shielded sprayer.
At Kingaroy and Gatton, two sprays of “Chlorantraniliprole” (Aliticore®) was applied around flowering time to control insect pests. Plants were desiccated on 5-5-2017 & 22-5-2017 at Kingaroy and Gatton, respectively, using a foliar spray of Glyphosate® at 2 L/ha and machine-harvested approximately10-12 days after desiccation at both sites. The crop was threshed using a mechanical thrasher and seeds were collected.
Measurements
Weather
The hourly data on Max T, Min T, rainfall, incident solar radiation, relative humidity and pan evaporation were obtained from an automatic weather stations installed within 0.5 km distance from the experimental sites at both locations. The data was integrated over 24 hrs period for analysis.
Fractional Intercepted Radiation (f)
The dynamic changes in fractional intercepted radiation was measured at hourly intervals between 11-02-2017 (30 DAS) to 22-5-2017 (130 DAS), only at Gatton site, using tube-solarimeters (Model Delta-T). The tube solari-meters which were of 90cm length were installed perpendicular to the rows of the crop at 10 cm above the ground. Two tube solari-meters were placed only in 50cm spacing treatment for all cultivars excepting for Pcv 1 and Pcv 3 which had only one tube solari-meter in each spacing. Two reference tubes were placed 2m above the plant canopy to record incident radiation. The tubes were flushed with nitrogen gas as when necessary to remove any moisture condensation in the tube and occasionally readjusted to avoid any interference of intercepted radiation by weeds. Data from the tubes were captured using a data logger at 5min intervals and integrated over one hour. The tubes along with the logger were removed 2 or 3 days before the desiccation.
Daily totals and individual tube-calibration factors were used to calculate the fraction of the incident radiation intercepted by the crop (f).
Radiation intercepted were computed as described in equation 1.
RI = (1-r) x Dr (1)
Where,
RI = Daily intercepted radiation by the crop (MJ/m2)
r= Proportion of radiation recorded by the tube
Dr= Daily incident radiation (from the two tubes placed 2m above the canopy)
Cultivars were compared using the daily short-wave radiation intercepted which was converted into the photosynthetically active radiation (PAR).18 The radiation use efficiency (RUE) was then calculated as a ratio of total dry mass g/m2 and PAR intercepted (MJ/m2) as described in equation 2.
RUE = DM / RI (2)
Where, RUE (g/MJ) was the ratio of the DM (g/m2) accumulated and RI (MJ/m2) was the total radiation intercepted by the canopy, during the measurement period (i.e. 11th Feb to 22nd May 2017).
Shoot dry Matter
Plants from 1m2 ground area were hand-harvested at the ground level at the peak biomass stage (just before start of senescence) 20-05-2017 and 08-05-2017, at Gatton and Kingaroy, respectively. The harvested plants were dried in a fan-forced oven at 80oC for 48 hrs before recording the dry weight of shoot (leaves, stems and pods) and the weights calculated based on area of harvest and expressed as t/ha.
Grain yield
The trials were harvested when 90% of plants in a plot had more than 80% mature pods as indicated by the dark colour pod wall. The effective plot area was measured before harvest. The grain samples collected from the harvester were cleaned to remove any extraneous matter before recording the grain weight. The final grain yield was calculated on the plot area basis and expressed as t/ha, at 12% seed moisture content.
Shoot and Grain Nitrogen
A sub-set of DM and grain samples were ground to pass through 2mm sieve and sub-sample of about 50g were used for carbon and nitrogen analysis. Another sub-sample of grain was used for other elemental analysis.
Carbon and Nitrogen Analysis
The plant or grain tissue sample of 0.25 g was weighed in a tin foil capsule which was placed into the induction furnace of a LECO Truspec. The CHN combustion analyser was set at 1100oC and calibrated with EDTA. The carbon present in the sample was combusted to CO2 which was determined with an infra-red detection cell. The nitrogen present was combusted to N2, NO2 and NO. The oxides were reduced to N2 which was determined quantitatively using a thermal conductivity cell. Results were automatically expressed as weight percentages.19
Elemental Analysis (Acid Digestion)
The grain tissue sample of 0.25 g was weighed and digested with 15 ml of 5:1 nitric: per-chloric acid mixture. The digested sample was made up to a volume of 25 ml and the elemental concentrations were then determined by ICPAES. Concentration measured in mg/L were converted into mg/kg by multiplying by the digest volume and dividing by the sample weight. The results were expressed as weight percentages.20
Results
Weather
Kingaroy and Gatton received in-season rainfall of 175 mm and 368 mm respectively. However, at Gatton most of the rain fell during pre-podding stage, while at Kingaroy it was well distributed throughout the growing season (Fig.1a and 1b). At Gatton, the maximum temperatures ranged between 30 and 35oC and the daily incident solar radiation between 20-25 MJ/m2 from emergence until 100 DAS after which, both the parameters declined steadily. The minimum temperatures reached below 5oC by the end of the season. At Kingaroy, the maximum temperatures ranged between 30 and 40oC and incident solar radiation ranged between 20-28MJ/m2, although radiation levels were 20MJ/m2 for most of the days during vegetative phase. After 120 DAS temperatures and solar radiation started declining. By the end of the season, minimum temperatures at Kingaroy also reached 5oC.
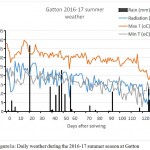 |
Figure1a: Daily weather during the 2016-17 summer season at Gatton
|
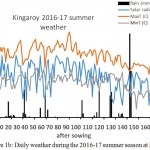 |
Figure 1b: Daily weather during the 2016-17 summer season at Kingaroy
|
Fractional Intercepted Radiation (f)
Genotypes differed significantly in the fractional intercepted radiation “f” throughout the growing season. The genotype Pcv1 showed the highest “f” from 50 DAS, while the “f” was the lowest for Pcv4 (<0.10) followed by Pcv2 (0.2) (Fig 2). However during 35-80 DAS, all genotypes rapidly expanded their leaf area to reach “f” of >0.6, although there were significant genotypic differences in the rate of canopy expansion as indicated by the rate of increment in “f”. The rate of increment of “f” during this period was 0.01/day (1% / day) for Pcv1 and Pcv3, respectively, while it was 0.013/day (1.3%/day) for Pcv2 and 0.017/day (1.7%/day) for Pcv4. However, Pcv1 and Pcv4 were intercepting 90% of the incident radiation (“f” = >0.9) from 80 DAS for rest of the season, while PCv3 reached 0.9 “f” from 100 DAS. It was interesting to note that the “f” remained 0.8 for Pcv2 and declined to <0.6 from 120 DAS. The total intercepted photosynthetically active radiation (PAR) between 35-120 DAS and the radiation use efficiency (RUE) of the four genotypes is presented in table 1. The Pcv 1and Pcv 4 recorded similar RUE (1.76 g/MJ) dedspite variable “f” intercepted and different shoot dry matters produced during the 35-120 DAS period. However, Pcv 2 and Pcv 3 recorded 1.67 and 1.40 RUEs respectively.
Table 1: Radiation-use efficiency of pigeonpea genotypes at Gatton.
| Cuitivar | Net PAR | Net DM | RUE (g/MJ)# |
| intercepted | accumulated | ||
| (MJ/m2) during | during 35- 120 | ||
| 35- 120 DAS # | DAS | ||
| Pcv1 | 511 | 859 | 1.76 (0.07) |
| Pcv2 | 441 | 696 | 1.67 (0.09) |
| Pcv3 | 462 | 606 | 1.40 (0.17) |
| Pcv4 | 439 | 732 | 1.76 (0.08) |
#The values of net intercepted PAR were averages of 2 replications and values in the parenthesis of RUE are standard deviation from the mean of two replications.
Shoot dry Matter
There was a response to row spacing with DM being the highest at 25 cm spacing, compared to the 50 cm and 100 cm treatments (P<0.001) for all genotypes at both sites (Table 2). The mean DM in general was greater at Kingaroy compared to Gatton in all row spacing treatments (P<0.001) and the highest average DM of 13 t/ha was recorded by Pcv 4 at 25 cm row spacing at Kingaroy. The site effects for DM were significant at P<0.05 with an average DM being higher at Kingaroy compared to Gatton. There was a significant (P<0.05) site × variety interaction with Pcv 4 producing the highest DM at Kingaroy and the lowest at Gatton. The site × row spacing interaction was also significant (P<0.05), with row spacing differences especially between 25cm and 50cm treatments were more consistent at Gatton compared to Kingaroy. For example, the optimum row spacing was 50 cm for Pcv 1 and Pcv 3 at Kingaroy compared to other genotypes which showed 25cm being optimum.
Table 2: Shoot dry matter (DM), grain yield and harvest index of the four pigeonpea genotypes grown in three row spacing treatments at Gatton and Kingaroy sites.
| Site | Geno -type | DM (t/ha) | Grain yield (t/ha) | Harvest Index | ||||||||||
| 25 | 50 | 100 | Mean | 25 | 50 | 100 | Mean | 25 | 50 | 100 | Mean | |||
| cm | cm | cm | cm | cm | cm | cm | cm | cm | ||||||
| Gatton | Pcv1 | 8.4 | 9 | 3.7 | 7.1cd | 2.8 | 2.7 | 2.1 | 2.6bc | 0.34 | 0.31 | 0.3 | 0.32bcd | |
| Pcv2 | 8.9 | 7.4 | 2.7 | 6.3d | 2.4 | 2.6 | 2.2 | 2.4cd | 0.28 | 0.36 | 0.35 | 0.33bc | ||
| Pcv3 | 7.6 | 6.5 | 2.7 | 5.6d | 2.7 | 3.1 | 2.8 | 2.9a | 0.36 | 0.57 | 0.54 | 0.49a | ||
| Pcv4 | 7.6 | 7.2 | 2.8 | 5.7d | 3.1 | 3.3 | 1.8 | 2.8ab | 0.42 | 0.34 | 0.36 | 0.37b | ||
| Mean | 8.1 | 7.4 | 3 | 2.8 | 2.9 | 2.2 | 2.63 | 0.35 | 0.39 | 0.39 | 0.37 | |||
| Kingaroy | Pcv1 | 9.9 | 10.6 | 6.6 | 9.1ab | 1.8 | 2.8 | 1.7 | 2.1de | 0.19 | 0.27 | 0.29 | 0.25cde | |
| Pcv2 | 8.7 | 7.6 | 7.4 | 7.9bc | 2.1 | 2.7 | 1.7 | 2.1de | 0.24 | 0.36 | 0.22 | 0.27cde | ||
| Pcv3 | 7.9 | 10 | 8 | 8.6b | 1.9 | 2.6 | 1.6 | 2.0e | 0.25 | 0.26 | 0.2 | 0.24e | ||
| Pcv4 | 13 | 9.7 | 8.4 | 10.4a | 2.2 | 3.1 | 2 | 2.4cd | 0.17 | 0.32 | 0.24 | 0.24de | ||
| Mean | 9.9 | 9.5 | 7.6 | 2 | 2.8 | 1.7 | 2.16 | 0.21 | 0.3 | 0.24 | 0.25 | |||
| Site | ** | ** | ** | |||||||||||
| Var | * | * | * | |||||||||||
| RSp | ** | ** | * | |||||||||||
| Site x var | * | * | * | |||||||||||
| Site x RSp | * | * | ns | |||||||||||
| Var x RSp | ns | ns | ns | |||||||||||
| Site x Var x Rsp | ns | ns | ns |
Var= Variety; RSp= Row Spacing; ** = P<0.001; * = P<0.05; ns = non-singificant In the Mean column, values with the same letter are not significantly different
Grain yield
The grain yield differed significantly between the sites (P<0.001) with the average yield being higher at Gatton (2.63 t/ha) compared to 2.16 t/ha at Kingaroy (Table 2). Varieties differed significantly with Pcv 3 and Pcv 4 consistently producing higher grain yields at Gatton (2.85 t/ha) compared to 2.2 t/ha at Kingaroy (P<0.05). There was a significant effect of row spacing (P<0.001) with yield being the highest at 0.50cm row spacing at both sites. The yields declined by 29% at 25cm row spacing (P<0.001) at Kingaroy while the yield reduction between 50 cm and 25 cm treatments were marginal at Gatton (Table 2).
Harvest Index
Harvest Index (HI) indicate the proportion of economic yield in the total dry matter produced by a crop. The sites differed significantly (P<0.001) with the average HI being 0.39 at Gatton compared to 0.24 at Kingaroy (Table 2). The HI in general was higher for all the four genotypes at Gatton compared to Kingaroy. However, the Pcv 3 had the highest average HI (0.49) compared to other genotypes, while at Kingaroy Pcv 1 and Pcv 2 had slightly higher HI compared to the other two. The effects of row spacing treatment was also significant (P<0.05), at both sites, with the mean HI being highest at 50cm row spacing compared to the other two row spacing treatments. Similar to grain yield, three was a consistent decline in HI at 25cm row spacing.
Relationship between shoot dry matter and grain yield
The effect of environment on the shoot dry matter productivity and its relationship with grain yield is presented in the fig. 3. It was clear that the grain yields were generally higher for a given amount of dry matter produced at the Gatton site compared to the Kingaroy site. There was trend for a curvilinear relationship between the shoot dry matter and grain yield at both sites, with R2 being significant at Gatton (P<0.001). At Kingaroy the shoot dry matter productivity reached >14 t/ha with no apparent benefits in grain yield while at Gatton, maximum shoot dry matter reached 12 t/ha but higher partitioning of dry matter to yield is seen throughout the range of the shoot dry matter productivity.
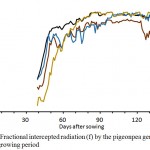 |
Figure 2: Fractional intercepted radiation (f) by the pigeonpea genotypes over the growing period
|
Hundred Seed Mass
Hundred seed mass is an important indicator of grain quality and it also contributes to crop yield as well as marketability. There was a significant effect of site (P < 0.001) with Gatton site recording 7% higher 100-seed mass than Kingaroy site. The differences between varieties was also significant (P<0.001) with Pcv 1 recording the highest and Pcv 3 the lowest 100-seed mass at both Gatton and Kingaroy. The row spacing did not affect the 100-seed mass. The lack of site x varieties interaction shows the variation in 100-seed mass was genetic and environment did not affect genotypic ranking for the 100-seed mass (Table.3).
Table 3: Summary of 100-seed mass of four varieties at the Gatton and Kingaroy sites
| Site | Geno type | 100 seed mass (g) | |||
| 25 cm | 50 cm | 100 cm | Mean | ||
| Gatton | Pcv1 | 11.3 | 11.2 | 11.2 | 11.2 |
| Pcv2 | 10.8 | 10.4 | 10.4 | 10.5 | |
| Pcv3 | 10.9 | 9.8 | 9.5 | 10.1 | |
| Pcv4 | 10.6 | 10.7 | 10.7 | 10.7 | |
| Mean | 10.9 | 10.6 | 10.5 | ||
| Kingaroy | Pcv1 | 10.1 | 10.3 | 10.2 | 10.2 |
| Pcv2 | 9.5 | 9.9 | 9.8 | 9.8 | |
| Pcv3 | 9.5 | 9.5 | 10 | 9.7 | |
| Pcv4 | 10.5 | 9.9 | 9.4 | 9.9 | |
| Mean | 9.9 | 9.9 | 9.8 |
Site **
Var **
RSp ns
Site x var ns
Site x RSp ns
Var x RSp ns
Site x Var x Rsp ns
Shoot N and grain N content, and net N contribution from the vegetative dry matter to the soil
The varieties differed significantly for shoot N content (P<0.001). Pcv 4 had the highest shoot N content at both sites. However, site had significant effect with grain N content at Kingaroy being 11% higher than at Gatton (Table 4). Varieties differed significantly (P<0.001) with Pcv 1 having the lowest grain N content compared to other three varieties at both sites. The net N contribution (after discounting N removal from grain), was generally higher at Kingaroy (93 kg/ha) compared to Gatton (60 kg/ha) due to higher DM production at Kingaroy. Varieties also differed significantly for net N contribution through vegetative stubble following harvest of grains. Pcv 4 recorded the highest N contribution (128 kg/ha) at Kingaroy but not at Gatton. However, Pcv 1 maintained N contribution of 86-88 kg/ha at both sites (Table 4).
Table 4: The nitrogen content in shoot, grain and net N–contribution through the vegetative matter or four pigeonpea varieties at the Gatton and Kingaroy sites.
| Gatton | Kingaroy | ||||||
| Plant | Grain | Net N | Plant | Grain N | Net N | ||
| N % | N% | contribution | N % | % | contribution | ||
| at harvest | at harvest | ||||||
| kg/ha) | kg/ha) | ||||||
| PCV1 | 1.91 | 2.82 | 86 | 1.7 | 3.13 | 88 | |
| PCV2 | 1.73 | 3.01 | 54 | 1.88 | 3.25 | 78 | |
| PCV3 | 1.73 | 2.99 | 46 | 1.66 | 3.28 | 77 | |
| PCV4 | 1.95 | 2.86 | 58 | 1.99 | 3.25 | 128 | |
| Mean | 1.83 | 2.92 | 60 | 1.81 | 3.23 | 93 |
| Plant N% | Grain N% | Net N | ||
| Contribution | ||||
| Site | ns | ** | * | |
| Var | ** | ** | ** | |
| RSp | ns | ns | ** | |
| Site x var | * | ns | * | |
| Site x RSp | ns | ns | ns | |
| Var x RSp | ns | ns | ns | |
| Site x Var x Rsp ns | ns | * | ||
Mineral Composition of the Pigeonpea Grain
There was significant effect of site and verities on mineral composition of pigeon pea grain but there was no row spacing effect and hence, the data was pooled across row spacing treatments (Table 5). The differences between the sites were significant for most minerals excepting for Boron (B) and Sodium (Na). Grain harvested from Kingaroy site generally contained a higher levels of most minerals except for potassium and phosphorus whose levels were higher in the grain harvested at Gatton (Table 5). The differences between the sites could also be noticed for nutrients such as Aluminium (Al), Copper (Cu), Iron (Fe), Magnesium (Mg), Manganese (Mn), Sodium (Na) and Zinc (Zn). However, some nutrients such as Potassium (K), Phosphorous (P) and Sulphur (S) were higher at Gatton compared to Kingaroy.
Table 5: Mineral composition in the grain of 4 pigeonpea genotypes (mg/kg) at the Gatton and Kingaroy sites
| Site | Genotype | Al | B | Cu | Fe | K | Mg | Mn | Na | P | S | Zn |
| Gatton | Pcv1 | 5 | 20 | 8 | 30 | 1.55 | 0.14 | 7 | 36 | 0.43 | 0.17 | 25 |
| Pcv2 | 3 | 13 | 9 | 30 | 1.57 | 0.14 | 8 | 8 | 0.47 | 0.18 | 25 | |
| Pcv3 | 3 | 11 | 8 | 29 | 1.53 | 0.13 | 7 | 8 | 0.43 | 0.17 | 23 | |
| Pcv4 | 2 | 13 | 8 | 34 | 1.45 | 0.14 | 9 | 13 | 0.45 | 0.17 | 23 | |
| Mean | 3 | 14 | 8 | 31 | 1.53 | 0.14 | 8 | 16 | 0.45 | 0.17 | 24 | |
| Kingaroy | Pcv1 | 7 | 18 | 10 | 40 | 1.46 | 0.15 | 10 | 29 | 0.31 | 0.16 | 33 |
| Pcv2 | 7 | 18 | 11 | 35 | 1.41 | 0.15 | 10 | 17 | 0.33 | 0.16 | 33 | |
| Pcv3 | 7 | 17 | 11 | 47 | 1.46 | 0.13 | 10 | 40 | 0.29 | 0.16 | 33 | |
| Pcv4 | 5 | 11 | 12 | 36 | 1.48 | 0.16 | 12 | 14 | 0.34 | 0.17 | 36 | |
| Mean | 7 | 16 | 11 | 40 | 1.45 | 0.15 | 10 | 25 | 0.32 | 0.16 | 34 | |
| Site | * | ns | ** | ** | ** | ** | ** | ns | ** | ** | ** | |
| Variety | ns | ** | * | ns | ns | ** | ** | ** | ** | ns | ns | |
| Site x Rsp | ns | ns | ns | ns | ns | ns | ns | ns | ns | ns | ns | |
| Site x Var | ns | * | ns | * | * | * | ns | ** | ns | ** | ns | |
| Site x Rsp x Var | ns | ns | ns | ns | ns | ns | ns | ns | ns | ns | ns |
The values are pooled for row spacing treatments as there was no significant effect
Discussion
The RUE, the ratio of the total dry matter (DM) produced and the PAR absorbed by canopy, is one of the major crop attributes used to explain the variation in DM due to either genotypes or environments.21,22,23 There were significant differences between varieties for the early canopy development as indicated by the rate of increase in fractional radiation intercepted (“f”) between 35 to 60 DAS period at Gatton. The RUEs ranged from 1.40 to 1.76 g/MJ amongst varieties. These values are close to those measured for pigeonpea24 but higher than the values (1.30 g/MJ and 1.62 g/MJ) observed by18 and25 respectively. However, the variation in the RUEs in the current study accounted for 76% of the variation in DM produced by the varieties.
The “f” values during early stages of crop growth (up to 40 DAS) were low and ranged from 0.1 to 0.25, compared to >0.4 observed for other legumes.26 The poor seedling growth of pigeonpea observed in the current study supports earlier studies.24,27 However, the current study demonstrated significant varietal differences for the rate of early canopy development with Pcv 1 showing rapid canopy development in contrast to Pcv 4 which showed the least, during the 30-70 DAS (Fig 2). While the reasons for the poor seedling growth in pigeonpea is not clear, it could be attributed to some bio-chemical changes occurring at the molecular level in germinating pigeonpea seed compared to other legume species.28 This phenomenon needs further investigation, as the poor seedling growth would influence the subsequent crop growth.
Row spacing treatments had significant effect with the average DM being maximum at 25cm compared to 50 and 100cm spacing treatments. However, the grain yield was maximum at 50cm spacing and there was a trend for decline in the yield with further reduction in row spacing at both the sites.
There is limited systematic efforts to study the effects of row spacing on the pigeonpea productivity, and to our knowledge this is the first attempt to study the row spacing effects, particularly for the new pigeonpea cultivars in Australia.
Among the four genotypes, mean DM ranged from 5.6 to 10.4 t/ha at the two sites which were generally higher than those reported by other researchers 3.06-5.87,29 3.7t/ha,30 6.4-12.6.31 Genotype Pcv 3 resulted in the lowest DM (5.6t/ha) at Gatton (Table 1).
The grain yield of a genotype is a principal measure of its economic performance in a cropping system as it contributes to higher whole farm profit. Average grain yield ranged between 2.0 and 3.1 t/ha at the two sites (Table 1). However, these yields are higher than the average national yield measured in the major pigeon pea producing countries such as India, 1 ton/ha,7 1.4 to 1.9 t/ha at a plant population of 100000 to 200000 plants/ha,32 and matches with the maximum yield of 3 t/ha reported from different parts of the world.8,9,12,33
Grain yield is dependent on the efficiency with which the plant drymatter is produced and partitioned into grains. In this study the relationship between shoot dry matter and grain yield clearly showed the environmental effect in partitioning of dry matter into yield (Fig.3). The preferential allocation of dry matter to grain at Gatton needs further investigation. The historical varietal development in pigeonpea, has largely resulted in an indirect selection for biomass production in a given environment.34 However, the current study showed that the grain yields increased with increase in dry matter only up to 8t/ha, there was no further increase in yield with further increase in DM from 8 to 10t/ha at both sites. Unfortunately, partitioning efficiency has not been systematically assessed in pigeonpea for identifying key physiological traits underpinning this trait.35 In general enhanced biomass production among improved varieties could also be due to longer maturity or heterosis, however, in the current study all the four genotypes were short duration indeterminate types, not hybrids, which have been planted and harvested at the same time.
The harvest index (HI) across the two sites ranged from 0.21 to 0.39 with the HI being generally higher at Gatton site compared to Kingaroy site. Low harvest index in pigeonpea has been identified a yield constraint, and attributed to extensive flower drop.36 This flower drop could be due to the continuous nature of flowering, where the earlier formed pods out-compete the later formed flowers for attracting assimilates.
The mean 100 seed mass ranged from 9.8 to 10.9 g, which were much higher than what was reported32 (5.41-7.95 g). The higher solar radiation in the Australian environments could contribute to higher photosynthetic efficiency, which in turn would have contributed to the translocation of photosynthates to the grain. The 100 seed mass was also higher at Gatton site compared to Kingaroy site. The 100 seed mass was significantly different among sites and between genotypes (P<0.001). The increase in HI and 100 seed mass at Gatton are not clear and need further investigation.
The nitrogen contribution by the crop is also higher than those reported by other researchers,32 (32 kg/ha),8 (26-100 kg/ha).
The composition of Zn, Fe, Mn and Cu from the pigeonpea grain observed in the study was comparable with what was reported by,37 24,3913 and 18 mg/kg respectively). Nutritionally, trace minerals determined in our work are higher in B, Cu, Na and Zn content and comparable in Fe and Mn compared to composition of common beans, reported by,34 highlighting the outstanding nutritional value of pigeonpea.
Conclusions
The two-site field study evaluated seasonal productivity potential of four pigeonpea varieties with three (100, 50 and 25 cm) row spacing treatments in subtropics of Australia. The decreasing row spacing from 100 cm to 25 cm resulted in increased shoot drymatter significantly, but there were genotypic differences. The intercepted solar radiation measured in 50 cm row spacing only at Gatton showed that RUE accounted for 76% of the variation in shoot dry matter production. However, average grain yields of up to 2.9 t/ha were achieved at 50cm spacing, although some genotypes (pcv 4) yielded >3.1 t /ha at both sites. A decline in grain yields with further reductions in row spacing to 25cm was apparent at both sites. The average harvest index (HI) was higher (by 48%) at Gatton site than Kingaroy mainly due to higher DM production at Kingaroy. The varieties differed significantly for shoot and grain N content at both sites. The net N contribution was generally higher at Kingaroy (93 kg/ha) compared to Gatton (60 kg/ha). There was significant effect of site and verities on mineral composition of pigeonpea grain but there was no row spacing effect.
The study concluded that pigeonpea can provide an alternative broad leaf summer legume for Australian grain growers. The grain can be used as a source of energy-rich protein for the vegetarian population throughout the world.
Acknowledgement
The project was funded by Department of Industry, Innovation and Science www.business.gov.au, in partnership with an Australian private agency. Authors wish to thank farm support staff at Gatton and Kingaroy research stations for helping with on-farm operations during the crop growth.
References
- der V.M. India is the native home of the pigeonpea. Liber gratulatorius in honorem HCD de Wit. Misc. Paper 19. Wageningen, the Netherlands. 1980;257–262.
- Khoury C.K, Castañeda-Alvarez N.P, Achicanoy H. A, Sosa C.C, Bernau V, Kassa M.T, Norton S L, Jos G. f.L, der v.M, Upadhyaya H.D, Ramírez-Villegas U, Jarvis A, Struik P.C. Crop wild relatives of pigeonpea [Cajanus cajan (L.) Millsp.]: Distributions, ex situ conservation status, and potential genetic resources for abiotic stress tolerance. Biological Conservation. 2015;184:259–270.
CrossRef - Arnold J. Pigeonpea benefits cattle on the range. Agricultural Research. 2002;58(8);18.
- Faostat. Food and Agriculture Organisation of the United Nations. http://www.fao.org/faostat/en/#data/QC/visualize (seen on the FAO website as of 18-1-2018). 2015,.
- Pal G, Channanamchery R, Singh R.K, Kethineni U.B, Ram H and Prasad S.J. An economic analysis of pigeonpea seed production technology and its adoption behaviour: Indian context.The Scientific World Journal. 2016;7.
- Wood L. Pigeon pea market: Global industry trends, share, size, growth, opportunity and forecast. 2017-2022. Business Wire. http://www.researchandmarkets.com/research/ks4pzr/pigeon_pea.
- Pramod G, Pujari B.T, Basavaraja M.K, Mahantesh V and Gowda V. Yield, yield parameters and economics of pigeonpea (Cajanus cajan (L.) Millsp) as influenced by genotypes, planting geometry and protective irrigation. International Journal of Agricultural Science. 2010;61(2):422-425.
- Ahirwar R.P, Mishra U.S, Mitra N.G and Sirothia P. Effect of phosphorus and bio-fertilizers on phosphorus use efficiency, biological N-fixation and yield of pigeonpea (Cajanus cajan L.). International Journal of Agriculture. Environment and Biotechnology. 2016;9(6):1039-1043.
CrossRef - Mligo J.K and Craufurd P.Q. Adaption and yield of pigeonpea in different environments in Tanzania. Field Crop Research. 2004;94:43-53.
CrossRef - Singh U, Jambunathan R, Saxena R and Subrahmanyam N. Nutritional quality evaluation of newly developed high-protein genotypes of pigeonpea (Cajanus cajan). Journal of Science, Food and Agriculture. 1990;50: 201-209.
CrossRef - Johra A, Dubey A, Saxena R. K, Penmetsa R.V, Poornima K. N, Kumar N.N, Farmer A. D, Srivani G, Upadhyaya H. D, Gothalwal R, Ramesh S, Singh D, Saxena K, Kishor P. B. K, Singh N. K, Town C. D, May G. D, Cook D. R and Varshney R. K. Analysis of BAC-end sequences (BESs) and development of BES-SSR markers for genetic mapping and hybrid purity assessment in pigeonpea (Cajanus spp.). BioMedCentral-Plant Biology. 2011;11:56.
- Rao J.V.D.K.K, Johansen C, Chauhan1Y.S. Chauhan2 Y.S, Jain V.K, Jain K.C and Talwar H.S. An analysis of yield variation among long-duration pigeonpea genotypes in relation to season, irrigation and plant population. Journal of agricultural Science. 2001;136:291-299.
- Rao K, Johansen C, Yoneyama T, Tobita S and ITO O. Estimation of nitrogen fixation by the natural 15N-abundance technique and Nitrogen uptake by pigeonpea genotypes of different maturity groups grown in an inceptisol. Journal of Agronomy and crop Science. 1996;177:129-138.
CrossRef - Byth D.E, Wallis E.S and Saxena K.B. Adoaption and breeding strategies for pigeonpea. Proceedings of the international workshop on pigeonpea, ICRISAT Center, Patancheru, India. 1981;450-464.
- Wallis E.S. and Whiteman P.C. Pigeonpea (Cajanus cajan (L.) Millsp.): A potential grain crop for Queensland. Australian oil seed and protein grain research conference, Toowoomba, Queensland. 1976.
- Baker G.H, Tann C.R. Mating of Helicoverpa armigera (Lepidoptera: Noctuidae) moths and their host plant origins as larvae within Australian cotton farming systems. Bulltin Entomological Research. 2013; 103(2); 171–181.
CrossRef - Wijnberg C and P. C. Whiteman P.C. Effects of stocking rate of goats and stage of crop growth when grazed on grain yield and goat production from pigeonpea (Cajanus cajan). Australian Journal of Experimental Agriculture. 1985;25:796-805.
CrossRef - Muchow R.C. An analysis of the effects of water deficits on grain legumes grown in a semi-arid tropical environment in terms of radiation interception and efficiency of use. Field Crops Research. 1985;11:291-307.
CrossRef - Rayment G.E and Lyons D.J. “Soil Chemical Methods – Australasia“, CSIRO publishing 2011 Section. 2011;6(2):75.
- Martinie G.D and Schilt A.A. Investigation of the Wet Oxidation Efficiencies of Perchloric Acid Mixtures for Various Organic Substances and the Identities of Residual Matter. Analytical Chem. 1976;48:70-74.
CrossRef - Monteith J.L. Climate and efficiency of crop production in Britain. Phil. Trans. R. Soc. London Ser. B. 1977;281:277–294.
CrossRef - Gallagher J.L, Biscoe P.V. Radiation absorption, growth and yield of cereals. J. Agric. Sci. Camb. 1978;91:47–60.
CrossRef - Russell G, Jarvis P.G, Monteith J.L. Absorption of radiation by canopies and stand growth. In: Russell G, Marshall B, Jarvis P.G. (Eds.), Plant Canopies: Their Growth, Form and Function. Cambridge University Press, Cambridge. 1989;21-40.
CrossRef - Patel N.R, Mehta A. N and Shekh A. M. Radiation Absorption, Growth and Yield of Pigeonpea Cultivars as Influenced by Sowing Dates. Expl Agric. 2000;36:291-301.
CrossRef - Thirathon A, Byth D. E, Fischer K. S & Whiteman P. C. Relationship between leaf area, radiation interception and dry matter production after flowering in short-season pigeonpea. In Food Legume Improvement for Asian Farming Systems. Proceedings of an International Workshop held in Khou Kaen, 1987.Thailand, 1±5 September, 1986. ACIAR Proceedings No. 18, 252±253 (Eds E. S. Wallis & D. E. Byth), Canberra: ACIAR.
- Tesfaye K, Walker S and Tsubo M. Radiation interception and radiation use efficiency of three grain legumes under water deficit conditions in a semi-arid environment. Europ. J. Agronomy. 2006;25:60-70.
CrossRef - Sivakumar M.V.K and Virmani S.M. Crop productivity in relation to interception of photosynthetically active radiation. Agricultural and Forest Meteorology. 1984;31:131-141.
CrossRef - Oloyo R.A. Chemical and nutritional quality changes in germinating seeds of Cajanus cajan L. Food Chemistry. 2005;85:497–502.
CrossRef - Anon. Plant material No 40. International Crop Research Institute for the semi-Arid Tropics (ICRISAT), Patancheru, 1994, Andhra Pradesh 502324, India.
- Mostafa M.G, Hossain S.M.M and Fakir M.S.A. A study of canopy structure and dry mass production in short duration pigeonpea morphotypes. Journal of Agroforestry and Environment. 2009;3(1):9-12.
- Rao, S.C., Phillips, W.A., Mayeux, H.S. and Phatak, S.C. Potential grain and forage production of early maturing pigeonpea in the Sothern Great Plains. Crop Science Society of America, 677 S. Segoe rd, Madison, WI 53711 USA, 2003; 2212-2217.
- Singh A, Prasad R and Saraf C.S. Effects of plant type, plant population density and application of phosphate fertilizer on growth and yield of pigeon pea. J. agric. Sci. 1981;97:103-106.
CrossRef - Tayo T.O. Growth, development and yield of pigeon pea (Cajanus cajan (L.) Millsp.) in the lowland tropics, Effect of planting configuration. J agric. Sci. 1983;101:441-445.
CrossRef - Mhango1 W.G, Snapp S and George Y. K.P. Biological nitrogen fixation and yield of pigeonpea and groundnut: Quantifying response on smallholder farms in northern Malawi. African Journal of Agricultural Research. 2017;12(16):1385-1394.
CrossRef - Chauhan, Y. S. , Johansen , C. and Saxena , K. B. ( 1995 ), Physiological basis of yield variation in short duration pigeonpea grown in different environments of the semi-arid tropics. Journal of Agronomy and Crop Science, 174 : 163–71 .
CrossRef - Saxena K. B, Chauhan Y.S, Kumar C.V.S, Hingane A.J, Kumar R.V, Saxena R.K., and Rao G.V.R. Developing improved varieties of pigeonpea. In: Grain Legumes Burleigh Dodds Science Publishing Limited.2017;1-26.
- Sheldrake A. R, Narayanan A and Venkataratnam N. ‘ The effects of flower removal on the seed yield of pigeonpea ( Cajanus cajan ) ’. Annals of Applied Biology. 1979;91:383–90.
CrossRef - Beebe S, Gonzalez A.V and Rengifo J. Research on trace minerals in the common bean. Food and Nutrition Bulletin. 2000;21(4):387-391.
CrossRef - Nwokolo E. Nutritional evaluation of pigeonpea meal. Plant Foods for Human Nutrition. 1987;37:283-290.
CrossRef

This work is licensed under a Creative Commons Attribution 4.0 International License.


