

Manuscript accepted on : 30 January 2018
Published online on: --
Diversity of Tropical Marine Macroalgae from Coastal Area of Sayang Heulang, West Java Indonesia
Dimas Frananta Simatupang1, Jannah Sofi Yanty1,3, Yanti Rachmayanti1, Fida Madayanti Warganegara1 and Akhmaloka1,2
1Biochemistry Research Group, Department of Chemistry, Faculty of Mathematics and Natural Sciences, Institut Teknologi Bandung, Indonesia.
2Department of Chemistry, Faculty of Science and Computer, Universitas Pertamina, Indonesia.
3Department of Medical Laboratory Techmologgy, Politeknik Kesehatan Bali, Indonesia.
Corresponding Author E-mail: loka@chem.itb.ac.id
DOI : http://dx.doi.org/10.13005/bbra/2616

ABSTRACT: Genetic diversity of nine marine macroalgae from coastal area of Sayang Heulang were assessed based on phenotypic and ribotyping analysis. Morphology of the macroalgaes were classified based on the color of the organism such as red (4 samples), brown (3 samples) and green (2 samples). Genomic DNA from the organisms were isolated using CTAB method with slight modification. The 18S rRNA gene amplified by PCR method using standar primers for V4 region of 18S rRNA gene. The amplicons were sequenced and analysed. The results showed that all the sequences are closed to V4 region of 18S rRNA gene. Comparison among the nine sequences showed a variation of homology. The best homology was shown by the sequence of SB and TC (99,1%), both are brown color macroalgea. The lowest homology was shown by GU (red color) and TC (brown color) with the homology at around 64,6%. Further analysis by comparing among the same color and the cross color showed that the same color does not show genetically close each other. Phylogenic analysis showed that the three brown colors are closed each other, however the rest are seen different and far away each other.
KEYWORDS: Ribotyping Analysis; Tropical Macroalgae; V4 Region of 18S rRNA Gene
Download this article as:| Copy the following to cite this article: Simatupang D. F, Yanty J. S, Rachmayanti Y, Warganegara F. M, Akhmaloka A. Diversity of Tropical Marine Macroalgae from Coastal Area of Sayang Heulang, West Java Indonesia. Biosci Biotech Res Asia 2018;15(1). |
| Copy the following to cite this URL: Simatupang D. F, Yanty J. S, Rachmayanti Y, Warganegara F. M, Akhmaloka A. Diversity of Tropical Marine Macroalgae from Coastal Area of Sayang Heulang, West Java Indonesia. Biosci Biotech Res Asia 2018;15(1). Available from: https://www.biotech-asia.org/?p=28968 |
Introduction
Macroalgae is a low marine plant classified as algae or more well-known as plant with thallus. Basically, macroalgae contains just root, stem and leaf which similar to higher plant. Macroalgae implified in group of Thallophyta adhered to substrate using holdfast . The organism contains chlorophyll for photosynthesis process and few pigments. According to Jiang, et al (2006), macroalgae, synonym of seaweed is collective term that refers to series of non-phylogenetic, multi cellular, macroscopic and eukaryotic organism. A first classification of seaweeds are given by their ability to absorp light for the purpose of photosynthesis. Therefore, based on the parameter, the organisms are grouped as microalgae or marine microalgae (kelp or seaweed) in red algae (or rhodophytae, rodophyicae), brown algae (or pheophytae, pheophycae) and green algae (or chlorophytes, chlorophycae) (Sulaiman, et al, 2015)
Littoral benthic organism may serve as useful tools to detect environmental changes since they integrate the environmental factors over time (Fredriksen, et al, 2015). Littoral species are directly exposed to change in air and sea surface temperatures, as well as changes in ice cover and freshwater input and the littoral may thereby be considered as an “early warning habitat” of a shifting climate (Høglund, et al, 2014). A good baseline understanding of species diversity is therefore important from a management perspective (Fredriksen, et al, 2015). One of the main applications for analysis of genetic variation from marine species is genetic conversation. Marine ecosystems are potentially in a high-risk category, with estimates of approximately 10,000 species being transported daily, yet marine research lagged behind investigations of terrestrial and freshwater ecosystem (Frankham, et al, 2002). The genetic pattern of given species or stock may be disturbed or totally lost even by small and localized disturbance of the environment due to man induced activities like over exploitation, environmental degradation etc. Individual with high level of genetic variation have greater prospect in aquaculture in terms of higher growth rate, developmental stability, viability and resistance to environmental stress and disease (Prasad, et al, 2007)
Molecular systematic in seaweeds and other organisms had rapidly progressed with the use of PCR coupled by sequencing methods (Akhmaloka, et al, 2006; Safika et al 2013; Sun et al, 2016). This molecular approach has been effective in addressing many phylogenetic questions that had not been solved using phenotypic characters (Sun, et al, 2016). The nuclear 18S rRNA gene has been used extensively at various taxonomic levels for type of macroalgae such as Hildenbrandia from genus of Rhodophyta in North America (Sherwood, et al, 2000) and Prasiolales from genus of Chlorophyta in Canada (Sherwood et.al, 1999). Recently, few reports on taxonomy and phylogeny of macro algae are available in Indonesia, however all of the studies based on phenotypic characters (Anggraeni et al, 2008). Here we report the identification and classification of Indonesian macroalgae based on ribotyping analysis. The study was focused on isolation of genomic DNA from fresh marine macroalgae, amplification of specific region of 18S rRNA gene, followed by analysis the 18S rRNA gene sequences.
Materials and Methods
Sampling and Morphology Identification
Sampling of macro algae has been carried out by purposive sampling method in certain coordinate point in Coastal Area of Sayang Heulang, West Java, Indonesia. The Selected macroalgae were weight and identify its phynotypic based on standard handbook of algae identification (Mckenzie et al, 2003). The samples were stored on temperature -800C until DNA isolation.
DNA Isolation
DNA Isolation was carried out by using CTAB method (Philips, et al, 2006). 100 mg of wet sample was cleaned and polished with liquid nitrogen in mortar by using pestle. This step was repeated three times. The sample was then mixed with 500 μL extraction buffer and placed in sterile mictotube 1.5 mL. The sample was incubated in water bath at 60 0C for 30 min. The microtube was centrifuged for 10 min in 8.000 g. The supernatant was moved to another sterile microtube and mixed with chloroform: isoamyl alcohol (24:1), then centrifuged again in same condition. The upper phase was collected into sterile microtube. The mixture was added by pure ice cold isopropyl alcohol in the same volume of aqueous phase, then mixed gently and incubated in freezer at -200C for 30 min. After incubation, the mixture was centrifuged and the pellet was collected. Furthermore the pellet was washed by 70% alcohol, re-centrifuged, removed aqueous phase and let the pellet dried (air dried) for overnight. Finally the pellet was added by 50 μL TE buffer and tapped gently to dissolved.
DNA Amplification
Amplification of 18S rRNA gene fragment was conducted with RAPD-PCR method. The primer used was standard sequence for the VU region (Tables). Generally all RAPD-PCR process was carried out using composition of reaction mixture with total volume of 25 μL. The PCR mix consists of 1 μL DNA template, 10 μM for each primer with total volume 5 μL, 2.5 μL of 2 mM dNTPs mixture, 2.5 μL of PCR buffer 10X, 2 μL of 25 mM MgCl2, 1 unit of Tag DNA polymerase and ddH2O until total volume up to 25 μL. RAPD-PCR process was run with Thermal Cycler Bio-Rad. Total cycles of RAPD-PCR was carried out for 36 times with pre-denaturation at 95 0C for 3 min, denaturation at 95 0C for 30 sec, anneling at 50 0C for 30 sec and extention in 72 0C for 1 min. Final extension was run for 10 min.
DNA Sequencing Analysis
DNA sequencing was done at Macrogen Inc., South Korea. The process involved Dye Terminator method (3’-dye labeled dideoxynucleotide triphosphate) which consists of template preparation, sequencing reaction, PCR product purification and electrophoresis with scanning fluorescence.
Phylogenetic Analysis
Phylogenetic tree was constructed by DNA Baser v4.0.7 (licence: Demo) to view its contig, Notepad++ to observe, choose and join the contig analysis. BioEdit was used to edit sequence alignment and MEGA 6.06 to co contruct to phylogeny tree (Tamura, et al, 2011).
Results and Discussion
Sampling and Classification
Nine macroalgaes were successfully isolated from coastal area of Sayang Heulang. Morpholigal identification of the organisms were based on algae identification sheet (McKenzie, et al., 2003). The macroalgaes were classified as brown, green and red macroalgaes. Brown macroalgaes consisted of three samples coded as SB, SP, and TC. While green consisted two samples coded as UF and GM and last group was red macroalgaes consisted four samples coded as GA, GV, GS and HS (data not shown).
Amplification of V4 Region of 18S rRNA gene
Isolation of total DNA from macroalgaes was carried out suing CTAB method. The DNA were seen on agarose gel before used for amplification of 18S rRNA gene fragment (data not shown). V4 region of 18S rRNA genes were amplified using a pair of primer (Table 1). The primer will amplify at around 650 bp long fragment. In V4 region of 18S rRNA gene (Hadziavdic, et al., 2014). The result showed that single amplicons appear on agarose gel with the size at around 650 bp (Figure 1). This suggested that the primers amplified only the correct fragment of VU region of 18S rRNA gene.
Table 1: Primers used for amplification of U4 region of 18S rRNA gene
| Forward | 5’ – CAG CAG CCG CGG TAA TTC C-3′ |
| Reverse | 5’ – CCC GTG TTG AGT CAA ATT AGG C-3’ |
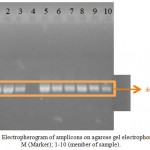 |
Figure 1: Electropherogram of amplicons on agarose gel electrophoresis. M (Marker); 1-10 (member of sample).
|
Sequence and Ribotyping Analysis of The Amplicons and Analysis
All of (nine) amplicons were sequenced and analysed. Homological analysis showed that the amplicons appeared high homology to 18S rRNA gene. Comparison among the sequences of the amplicons showed variation of some homology (Table 2). The best homology was shown between SB and TC samples with the homology of 99%. Both TC and SB samples belong to brown macroalgae. In contrast, the less homology was shown by SP and GV samples with homology of 64,6%. SP sample is member of brown macroalgae meanwhile GV sample is member of the red color algae.
Table 2: Percent similarity of the U4 region sequences among the samples. Brown samples (SP, TC and SB); Green samples (GM1 and UF); Red samples (GA, HSp, GV and GSp).
| SP | TC | SB | GM1 | UF | GA | HSp | GV | GSp | |
| SP | 100 | ||||||||
| TC | 98.58 | ||||||||
| SB | 98.40 | 99.12 | |||||||
| GM1 | 97.86 | 98.04 | 98.58 | ||||||
| UF | 74.25 | 74.48 | 75.51 | 75.58 | |||||
| GA | 67.03 | 67.28 | 68.43 | 68.93 | 67.11 | ||||
| HSp | 65.38 | 65.63 | 66.82 | 67.61 | 67.55 | 91.46 | |||
| GV | 64.61 | 64.86 | 66.07 | 65.92 | 66.10 | 84.17 | 85.90 | ||
| GSp | 67.84 | 68.08 | 69.23 | 69.56 | 68.86 | 86.55 | 88.88 | 95.82 | 100 |
Further analysis by comparing the sequence among the same colors and cross color showed that the lowest homology for the same color was shown by GM1 and UT samples, both are green samples, with the similarity at around 75,5%.. Moreover, the highest homology for different color was shown by SB and GM samples with the homology of 98,6%. These data suggest that the same color does not appear genetically close each other.
Phylogenetic Analysis of the Macroalgaes
Phylogenetic analysis of each samples were constructed with other 18S rRNA gene fragment based on the best similarity of the sequences. The brown samples are clustered on one branch (Figure 2), where TC sample is close to Turbinaria sp (KY 987 595), meanwhile SP and SB samples are not seem branch to all others but close to Sargassum.
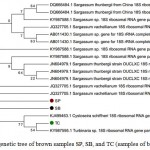 |
Figure 2: Phylogenetic tree of brown samples SP, SB, and TC (samples of brown macroalgea)
|
The phylogenetic of the green samples are a bit surprising. The UF sample clustered to the 18S rRNA gene of Ulva (Figure 3), meanwhile, GMI is close to Cystoseira, Turbinaria and Sargassum (Figure 4). The lost genes are belong to the brown color macroalgae.
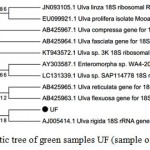 |
Figure 3: Phylogenetic tree of green samples UF (sample of green macroalgea)
|
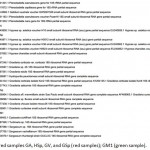 |
Figure 4: Phylogenetic tree of red samples GA, HSp, GV, and GSp (red samples); GM1 (green sample).
|
Phylogenetic at the red samples showed that HSp, GV and GSp are very close to Hypnea and Gracilia respectively (Figure 4). While GA is seen out of the branch which is close to Gelidium anstrack, Plerocladiella.. Based on the homology of the sequence GA is close to Gelidium. The 18S rRNA gene of the nine sequences were deposit in the genbank (Table 3).
Table 3: Gen bank accession number of nine samples. SC (Sample Code); AN (Accession Number).
| No | SC | AN |
| 1 | GA | MG680736 |
| 2 | GSp | MG680737 |
| 3 | HSp | MG680738 |
| 4 | SB | MG680739 |
| 5 | SP | MG680740 |
| 6 | TC | MG680741 |
| 7 | UF | MG680742 |
| 8 | GM1 | MG680743 |
| 9 | GV | MG462720 |
Acknowkledgement
We would like to thank to P3MI program of ITB, Ministry of Research, Technology and Higher Education to make this research possible to be carried out.
References
- Akhmaloka A, Suharto S. Nurbaiti
- Tika I. N and F. M. Warganegara Ribotyping Identification of Thermophilic Bacterium From Papandayan Crater. Proceeding ITB on Engeneering Sciences. 2006;38:1-10.
CrossRef. - Anggraeni S.R, Sudarsono, Soedharma D. Genetics characterization of Euchema spp. From three areas in Indonesia (Kepulauan Seribu, Keruak Sumenep). Jurnal Bionatura. 2008;10(3):196-208.
- Frankham R, Ballou J.D and Briscoe D.A. Introduction to conversation genetics, Cambridge University Press, England. 2002.
CrossRef - Fredriksen S, Gabrielsen T. M, Kile M.R & Sivertsen K. Benthic algal vegetation in Isfjorden, Svalbard. Polar Research. 2015;34:1-9.
CrossRef - Hadziavdic K, Lekang K, Lanzen A, Jonassen I, Thompsom E. M and Troedsson C. Characterization of the 18S rRNA gene for designing universal eukaryote specific pimers. Journal of PLOS ONE. 2014;9(2):1-10.
CrossRef - Høglund S, Sejr M.K, Wiktor J. Jr, Blicher M.E & Wegeberg S. Intertidal community composition along rocky shores in south west Greenland: a quantitative approach.Polar Biology. 2014;37:1549-1561.
CrossRef - Jiang R, Ingle K. N and Golberg A. Macroalgae (seaweed) for liquid transportation biofuel production: what is next. Algal Research. 2016;14:48-57.
CrossRef - McKenzie L.J, Campbel S.J & Roder C.A. Seagrass-Watch: Manual for Mapping and Monitoring Seagrass Resources by Community (Citizen) Volunteers, 2nd Department of Primary Industries Queensland. 2003.
- Philips N, Morden C.W and Smith C.M. An effevtive DNA extraction protocol for brown algae. Phycological Research. 2006;49:97-102.
- Prasad U, Deshmuke G, Dwivedi A and Singh S. D. Detection of genetic variation in four Ulva species based on RAPD technique. Indian Journal of Marine Science. 2007;38(1):52-56.
- Safika, Madayanti F, Aditiawati P, Akhmaloka. Succession of eukaryotic Community Microorganism from Cattle Manure During Composting Process. Journal of Pure and Applied Microbiology. 2013;7(3):2233-2241.
- Sherwood A.R & Sheath R.G. Biogeography and systematic of Hildenbrandia in North America (Rhodophyta, Hildenbrandiales): inferences from morphometrics and rbcL and 18S rRNA gene sequence analysis. European Jounal of Phycology. 1999;34(5):523-532.
CrossRef - Sherwood A.R, Garbary D.J & Sheath R.G. Assesing the phylogenetic position of the Prasiolales (Chlorophyta) using rbcL and 18S rRNA gene sequence data. Phycologia. 2000;39:139-146.
CrossRef - Sulaiman O. O, Rashid A, Binti N, Raship A, Saman A, Kader A & Madonna A. Macro Algae: Biodiversity, Usefulness to Humans and Spatial Study for Site Selection in Oceanic Farming. Biodiversity & Endangered Species. 2015;1-6.
- Sun S. M, Yang S. H, Golokhvast K.S, Le B and Chung G. Reconstructing the Phylogeny of Capsosiphom of Fulvescens (Ulotrichales, Chlorophyta), from Korea Based on rbc L and 18S rDNA Sequences. BioMed Research International. 2016;1-6.
- Tamura K, Stecher G, Peterson D, Filipski A, and Kumar S. MEGA6 : Molecular Evolutionary Genetics Analysis Version 6.0. Journal of Molecular Biology and Evolution. 2011;30(12):2725-2729.
CrossRef

This work is licensed under a Creative Commons Attribution-NonCommercial-ShareAlike 4.0 International License.

This work is licensed under a Creative Commons Attribution 4.0 International License.


