

Manuscript accepted on : 26 November 2016
Published online on: --
Plagiarism Check: Yes
The Impact of Land Use on Bacterial Community Composition and Physicochemical Properties of Soil
Ghobad Jalali1, Amir Lakzian1*, Alireza Astaraei1, Aliakbar Haddad-Mashadrizeh2, Mehdi Azadvar3 and Eisa Esfandiarpour4
1Department of Soil Science, Ferdowsi University of Mashhad, Iran.
2Department of Biology,Ferdowsi University of Mashhad, Iran.
3Department of Plant Protection, South Kerman Agricultural and Natural Resources Research and Education Center, Iran.
4Department of Soil Science, Vali-e-Asr University of Rafsanjan, Iran.
Corresponding Author E-mail: alakzian@um.ac.ir-alakzian@yahoo.com
DOI : http://dx.doi.org/10.13005/bbra/2380

ABSTRACT: In order to determine the effects of land useon bacterial community composition and some physicochemical properties of soil, a study was carried out in three different land uses (orchard, farm and shrub) in arid-region soils located in southeast of Iran. The selected land uses were adjacent to each other and have not been changed in 50 recent years. Three samples of surface soil were collected from each land use and the bacterial community composition of soil was assessed using denaturing gradient gel electrophoresis (DGGE). Moreover, some physicochemical soil characteristics were investigated. The results showed that significant differences exist among all of the physicochemical soil characteristics in different land uses. Higher values of organic carbon, N, P, K, EC, clay, silt, CaCO3, Fe, Mn, Zn and Cu and lower values of pH and sand occurred in the agricultural lands (orchard and farm) than shrub land. The results of principal component analysis showed that land use can affect soil properties. Furthermore, results of canonical correspondence analysis showed that the variability in bacterial community composition was related to the selected soil characteristics. Clay and CaCO3, sand, and OC, total N and EC were shown to be the most significant properties affecting the bacterial community composition in orchard, shrub and farm land uses, respectively. Generally, the findings of the present study showed that agricultural activities not only did not cause a reduction in species richness, but also resulted in a significant increase in the mentioned indices in orchard and farm land uses compared to shrub land use.
KEYWORDS: Arid-region; Land use; soil bacteria; soil characteristics; DGGE; PCA; CCA
Download this article as:| Copy the following to cite this article: Jalali G, Lakzian A, Astaraei A, Haddad-Mashadrizeh A, Azadvar M, Esfandiarpour E. The Impact of Land Use on Bacterial Community Composition and Physicochemical Properties of Soil. Biosci Biotech Res Asia 2016;13(4). |
| Copy the following to cite this URL: Jalali G, Lakzian A, Astaraei A, Haddad-Mashadrizeh A, Azadvar M, Esfandiarpour E. The Impact of Land Use on Bacterial Community Composition and Physicochemical Properties of Soil. Biosci Biotech Res Asia 2016;13(4). Available from: https://www.biotech-asia.org/?p=16989 |
Introduction
Different soil particle sizes and their arrangement in soil are resulted in the creation of very diverse and heterogeneous physical environment. Microbial community composition has a close relationship with variety of soil characteristics such as chemical, physical and biological properties[1-3]. Jangid et al. (2008) [4] reported that pH and organic carbon content have the greatest impact on soil microbial community composition. In this regard, another study showed that changes in pH and soil texture greatly influenced bacterial community composition[5].
In addition to the inherent characteristics of soil, many factors like rhizosphere (root effect on microorganisms), soil pollutants and land use play significant roles on soil microbial community composition. Many researchers have reported that human activities such as changes of land use and management practices exert great influences on the community composition of soil microorganisms[4, 6-9].
Recently, metagenomics methods have been frequently used for studying soil microbial communities. These methods eliminate the use of culture by providing access to genetic information of microorganisms existed in environmental samples. This issue can be a great help for comprehensive understanding of researchers of microbial community, and consequently plays a vital role in the progress of practical part of microbial research including agriculture[10-11].
One of the best PCR-based metagenomics methods used for assessing microbial community structure is PCR-DGGE method. The results of many researches have shown that molecular analysis using DGGE of 16S rDNA gene amplification is a powerful tool in the study of bacterial community composition in complex environments[12-16]. Therefore, the aim of this study was to evaluate the impact of land use on the bacterial community composition and some physicochemical properties of soil.
Material and methods
Site and sampling
Jiroft plain with the elevation of 650 meters is one of the lowest plains located 28˚ 28′ 40” to 28˚ 52′ 6” North and 57˚ 30′ 8” to 58˚ 4′ 27” East of Iran with hot and dry climate, mean precipitation of 140 mm, relative humidity of 55% and the maximum and minimum temperatures of 48 and 1 degree Celsius. Soil moisture and thermal regimes of the region are aridic and hyperthermic respectively.
In Jiroft plain, a dominant geomorphologic unit (alluvial plain, located in the village of Ali Abad) containing shrub land that has not been cultivated so far because of water scarcity (Calligonumpersicum and etc.), field crops (at least in the last 50 years under fall planting of potatoes and onions, and in some years the spring planting of corn and etc.) and horticultural crops (more than 50 years under citrus cultivation) was selected.
The order of studied soils in the three neighboring land uses was Aridisols. Three soil samples, each contains ten subsamples, were gathered from A horizon (0-10 cm) across each land use on February 2015.
Physicochemical analysis
The soil samples were dried and finally passed through 2 mm sieve. Some important soil characteristics (pH, electrical conductivity (EC), calcium carbonate (CaCO3) organic carbon (OC), clay, sand, silt, total nitrogen (N),available phosphorus (P), potassium (K), iron (Fe), manganese (Mn), zinc (Zn) and copper (Cu)) affecting microbial community composition were determined using common laboratory methods.
Soil DNA extraction and PCR amplification
TheNucleoSpin® Soil kit (Macherey-Nagel, Duren, Germany) was used for extraction and purification of DNA from soil samples. Bacterial universal primer set of 341F (CCTACGGGAGGCAGCAG) and 534R (ATTACCGCGGCTGCTGG), which amplify the variable region V3 of bacterial 16S rDNA gene sequences, was used for amplification of 16S rDNA gene of soil bacteria. Besides, A GC-rich clamp (CGCCCGCCGCGCGCGGCGGGCGGGGCGGGGGCACGGGGGGCCTACGGGAGGCAGCAG) was added to the forward primer prevented the complete melting of the PCR amplicons during subsequent separation in DGGE [17].
Soil DNA was amplified in a Bio-Rad T100 thermal cycler (Bio-Rad Laboratories, Hercules, CA, USA). PCR reaction mixture in a volume of 50 μl contains: 50 ng of soil genomic DNA, 20 pmol of each of 341F-GC and 534R primers, 25 μl of Taq DNA Polymerase 2X Master Mix Red (1.5mM MgCl2) (Ampliqon, Skovlunde, Denmark) and Milli-Q water to the final volume of 50 μl. PCR was conducted under the following conditions: initial denaturation at 95 °C for 5min, followed by35 cycles including 20 cycles of Touchdown program; denaturation step at 94 °C for 30 sec; annealing step at 55-65 °C for 30 sec (decreased 0.5 °C per cycle); elongation step at 72 °C for 30 sec, and 15 cycles including 94 °C for 30 sec, 55 °C for 30 sec and 72 °C for 30 sec, and completed by a final elongation step of 10 min at 72 °C. The amplified products (5 μl) electrophoresed on a 2% agarose gel, stained with ethidium bromide, and finally imaging was performed using a UV transilluminator.
PCR-DGGE analysis
DCodeTM Universal Mutation Detection System (Bio-Rad Laboratories, Hercules, CA, USA) was used for DGGE analysis, so that equal amount (25 μl) of amplified segments of 16S rDNA gene was run onto 8% polyacrylamide (37.5: 1, acrylamide: bisacrylamide) denaturing gel containing a 40-60% gradient(100% denaturant concentration was defined as 7 M urea and 40% v/v deionized formamide). Then, the gel was electrophoresed in 1X TAE buffer (40 mMTris base, 20 mM acetic acid, and 1 mM disodium EDTA, pH 8.3) for 17 hours with a constant voltage of 100 V at 60 °C. After the run, the gel was silver-stained[18] and photographed with Camera.
Data analysis
DGGE image and bacterial species richness (the number of bands present) were analyzed using GelCompar II 6.6 software. The position and intensity of each band were determined automatically [19].
The data were subjected to a one-way ANOVA by using IBM SPSS software.Principal component analysis (PCA), performed by PAST3 software, was used for evaluating the soil properties in various land uses[20]. PAST3 software was also used for canonical correspondence analysis (CCA), which was used for assessing the influence of soil properties on the structure of the bacterial community (DGGE patterns) [21-22]
Results
Physicochemical soil properties
The results related to the physicochemical properties measured from soils of different land uses are shown in Table 1. As the results showed, significant differencesat 5% level were observed in soil properties among land uses which continue to be listed separately.
Soil moisture content
Soil moisture content at the time of sampling in farm and orchard was significantly greater than shrub land use.
Soil texture
Results showed that doing agricultural practices for about half century on shrub land changed the soil texture, especially in the surface layer, thus the dominant sand texture in shrub land use (this land use is adjacent to orchard and farm land uses, but is not under cultivation due to water restrictions) has been changed to sandy loam texture in orchard and farm lands. In addition, a significant difference was found in the means of soil separates (clay, silt and sand) in various land uses. The mean percentage of sand in the soil of shrub land use was higher than that of the other two land uses. Silt and clay percentages were greater in orchard and farm land uses, respectively.
CaCO3
CaCO3 percentagein farm land use was significantly higher than the other two land uses, but no significant difference was found between shrub and orchard land uses at 5% level. The higher amount of CaCO3 in farm land use may be associated to the role of agricultural practices like plowing, which occurs annually in the land use and leads to the transfer of CaCO3 from subsurface horizons to soil surface.
Soil pH
Soil pH may change owing to the different land management methods.
The results showed that soil pH in shrub land use was higher than the two land uses of farm and orchard; however this difference was significant only with orchard land use.
EC
EC rates in all the three land uses were low (less than 3 ds/m). A comparatively greater rate of this variable in orchard land use showed significant difference from the other two land uses, mainly due to the salinity resulting from the long-term use of chemical fertilizers.
OC
Orchard land use with an average of 0.086% OC showed significant differences at 5% level from farm and shrub land uses with 0.043 and 0.030%, respectively.
Total N
Orchard land use contained significantly a greater level of total N relative to farm and shrub land uses, which can be owing to the use of chemical fertilizers as well as greater content of organic material in orchard land use.
Available P
The amount of available P in orchard and farm land uses was significantly higher than shrub one, which might be mainly due to the use of phosphorous fertilizers in agricultural lands.
Available K
General comparison of the soil from the three land uses showed that the amount of K in shrub land use was significantly less than the other two land uses, which can be mainly owing to the consumption of potassium fertilizers in agricultural lands.
Available Fe, Mn, Zn and Cu
Unlike shrub land use, the means of four properties showed significant enhancement in agricultural land uses (orchard and farm). Climatic conditions, status of parent materials and topographic conditions in all the three adjacent land uses were the same; therefore, the main reason for the higher content of these micronutrients in agricultural lands could be the role of human and use of micronutrient-containing chemical fertilizers.
Table 1: Means for selected physicochemical soil properties of the studied soils from different land uses.
| Land uses | Physicochemical soil properties | ||
| Shrub land use | Farm land use | Orchard land use | |
| 8.17b | 7.96b | 7.70a | pH |
| 0.030b | 0.043b | 0.086a | OC(%) |
| 27.00b | 48.59b | 84.33a | N (mg/kg) |
| 1.11b | 9.87a | 11.15a | P (mg/kg) |
| 78b | 273a | 259a | K (mg/kg) |
| 0.46b | 0.89b | 2.52a | EC (ds/m) |
| 0.00a | 3.71b | 0.25a | Clay (%) |
| 1.33b | 39.00a | 46.63a | Silt (%) |
| 98.66b | 60.61a | 53.11a | Sand (%) |
| 4.02a | 5.50b | 3.86a | CaCO3 (%) |
| 1.23b | 9.34a | 13.06a | Moisture (%) |
| 1.14b | 3.83a | 3.69a | Fe(mg/kg) |
| 0.12b | 0.58a | 0.57a | Zn(mg/kg) |
| 1.15b | 2.33a | 2.56a | Mn(mg/kg) |
| 0.09b | 0.26ab | 0.36a | Cu(mg/kg) |
Values with the same letters within a row are not significantly different at 5% level among the land uses.
PCA analysis of soil properties
Basically, if the number of properties is high, correlation coefficient increases and therefore they will be difficult to interpret. As a result, researchers have been looking for ways to reduce the data in a way that this reduced set of data shows the maximum variance in the data [23]. 15 physicochemical soil properties were used for the PCA. As the results of PCA analysis (Table 2) demonstrate, the first two components showed totally 89.39% (70.06% the first component and 19.33% the second component) of the variance among the investigated soils in different land uses.
If the two main components show totally the high variance with total data, properties can be distinguished well by plotting these two components and draw the biplot by this method. Biplot shows the position of properties. In the drawn biplot, the lesser distance of the vectors shows the higher correlation among properties. The advantage of this method is that positive or negative relationships among properties can be easily observed [23].
Ordination biplot of the PCA of physicochemical soil properties in various land uses is shown in figure 1. Together the three soil samples of each land use in the diagram indicate that soil properties influenced by different land uses. Soil samples representing farm land use (FL1, FL2 and FL3) have the highest correlation with the positive side of the first component; while in the case of shrub land use, the samples (SL1, SL2 and SL3) have the highest correlation with the negative side of the first component. Besides, in orchard land use, the soil samples (OL1, OL2 and OL3) were shown to have the highest correlation with the positive side of the second component.
Table 2: Results of the eigenvalues of the PCA from soil samples.
| PC | Eigenvalue | % variance |
| 1 | 10.51 | 70.06 |
| 2 | 2.89 | 19.33 |
| 3 | 0.75 | 5.05 |
| 4 | 0.44 | 2.98 |
| 5 | 0.24 | 1.62 |
| 6 | 0.08 | 0.58 |
| 7 | 0.04 | 0.31 |
| 8 | 0.00 | 0.03 |
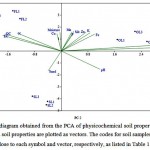 |
Figure 1:The biplot diagram obtained from the PCA of physicochemical soil properties. Soil samples are plotted as symbols and soil properties are plotted as vectors. The codes for soil samples and soil properties are placed close to each symbol and vector, respectively, as listed in Table 1. |
Considering the correlation between the properties and PCA components (Table 3), total N, OC, P, K, Fe, Zn, Mn, Cu, EC, silt and soil moisture content are positively correlated with the first component. By contrast, properties of sand and pH have negative correlation with this component. The other two properties, the percentage of CaCO3 and clay, have positive correlation with the second component.
Table 3: Correlation of soil properties with the first two components of PCA
| Soil properties | PC1 | PC2 |
| N | 0.88 | -0.41 |
| OC | 0.83 | -0.52 |
| P | 0.89 | 0.11 |
| K | 0.89 | 0.26 |
| Fe | 0.82 | 0.30 |
| Zn | 0.93 | 0.22 |
| Mn | 0.93 | 0.09 |
| Cu | 0.85 | -0.04 |
| CaCO3 | 0.17 | 0.94 |
| pH | -0.89 | 0.35 |
| EC | 0.76 | -0.54 |
| Sand | -0.97 | -0.12 |
| Clay | 0.30 | 0.92 |
| Silt | 0.97 | 0.11 |
| Moisture | 0.92 | -0.01 |
Soil bacterial community analysis by DGGE
To begin with, DGGE banding patterns of V3 region of 16S rDNA amplified with primers 341F-GC and 534R were used to evaluate the bacterial species richness. As DGGE gel image clearly shows in Figure 2, some common bands with different relative intensity were observed in all profiles.
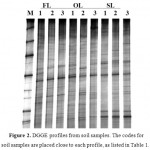 |
Figure 2: DGGE profiles from soil samples.The codes for soil samples are placed close to each profile, as listed in Table 1. M (bacterial 16S rDNA marker): a mixture of PCR amplified 16S rDNA fragments from bacterial species ofPseudomonas putida, Bacillus subtilis, Escherichia coli, Klebsiella pneumonia, Proteus mirabilis, Pseudomonas aeruginosa, Acinetobacterbaumannii, and Salmonella entericaserovarTyphi. |
Furthermore, after attaining the bacterial species richness from DGGE banding patterns, one-way ANOVA was perform to evaluate as to whether or not there is significant difference among three land uses regarding species richness index. Based on the results, bacterial species richness (bands number) showed significant differences among different land uses, where the highest and lowest species richness was seen in farm and shrub land uses with the average of 45.33 and 33.33 species, respectively. The number of bacterial species in orchard land use, on average, was 39.67 (figure 3).
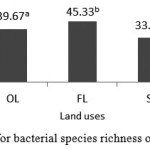 |
Figure 3: Means for bacterial species richness of the studied soils. |
Relationship between DGGE profiles and soil properties
CCA was used to identify the soil properties that best explain the pattern of DGGE profiles via Monte Carlo test. To perform CCA, firstly environmental data matrix (15 physicochemical soil properties) and zero one matrix (absence and presence of the species) of bacterial species derived from DGGE profiles were prepared, and then it was performed using PAST3 software.
The results of CCA are presented in Table 4. Three ordination axes showed 83.82% of the variance related to the relationship of the structure of bacterial community and soil properties. According to Table 4, the first and second axes with eigenvalues of 0.125 and 0.039, respectively, showed 56.25 and 17.62% of the variance between bacterial species and data obtained from physicochemical soil properties, respectively. The first and second axes, which have the highest eigenvalues, were used to display the results (Figure 4). In this diagram, more effective properties have longer vectors.
Table 4: The results of the axes obtained by CCA.
|
Axis |
Eigenvalue | % Variance |
P |
| 1 | 0.125 | 56.25 | 0.60 |
| 2 | 0.039 | 17.62 | 0.41 |
| 3 | 0.022 | 9.95 | 0.76 |
| 4 | 0.013 | 6.20 | 0.60 |
| 5 | 0.009 | 4.16 | 0.69 |
| 6 | 0.006 | 2.71 | 0.90 |
| 7 | 0.005 | 2.47 | 0.95 |
| 8 | 0.001 | 0.62 | 0.53 |
Table 5 shows the correlation coefficients for each of the soil properties in proportion to the ordination axes. The first axis has correlation with properties of sand, silt, EC, moisture, pH, OC, N, K, P, Fe, Zn, Mn and Cu. The sand and pH properties are positively correlated with this axis and the rest of properties had negative correlation with it. Furthermore, the second axis had negative correlation with the properties of clay and CaCO3.
Figure 4 shows the ordination diagram of the soil samples of the three examined land uses based on the first and second ordination axes. The distance of soil samples representing each land use from axes represents the intensity of relationship, so that the longer the vectors length of soil properties and smaller their angles with axes, the greater the correlation between these properties and axes and stronger their relationship with the characteristics showing axes[21]. Moreover, the distance of the points showing soil samples on the diagram represents the degree of similarity or difference in soil samples in terms of the studied factors (structure of bacterial species and soil properties).
As it is obvious in the diagram, three soil samples representing each land use are located in a separate location compared to soil samples in the two other land uses. The samples of shrub land use are located around the first axis in the first quarter (SL1 and SL3) and in the second quarter (SL2) of the diagram. The most effective soil variable in shrub land use is sand percentage. Samples of farm land use (FL1, FL2 and FL3) are located in the fourth quarter, and the most influential variable in isolation of these samples is soil OC, followed by EC and total N. Samples of orchard land use are situated in the third quarter, with CaCO3 and clay being the most effective properties in separating these samples.
Table 5: Correlation coefficients between soil properties and the first two axes obtained from CCA
| Soil properties | Axis 1 | Axis 2 |
| N | -0.727 | 0.446 |
| OC | -0.664 | 0.592 |
| P | -0.907 | 0.110 |
| K | -0.900 | -0.211 |
| Fe | -0.841 | -0.044 |
| Zn | -0.936 | -0.167 |
| Mn | -0.936 | -0.012 |
| Cu | -0.834 | 0.350 |
| CaCO3 | -0.369 | -0.916 |
| pH | 0.759 | -0.367 |
| EC | -0.630 | 0.476 |
| Sand | 0.977 | -0.105 |
| Clay | -0.491 | -0.790 |
| Silt | -0.967 | 0.094 |
| Moisture | -0.892 | 0.205 |
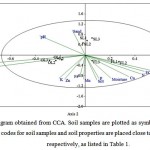 |
Figure 4: The biplot diagram obtained from CCA. Soil samples are plotted as symbols and soil properties are plotted as vectors. The codes for soil samples and soil properties are placed close to each symbol and vector, respectively, as listed in Table 1. |
Discussion
The differences in the investigated land uses in the last 50 years in the study area have influenced the structure of soil bacterial communities as well as the physicochemical soil properties. The results of one-way ANOVA and comparison of means showed that all soil properties were significantly different at least in one land use compared to the two other land uses. In this regard, it was reported that land use changes (from forest to shrub) can result in significant and long-term impacts on soil properties such as nutrient elements, carbon amount, pH and texture[5].
The most important soil characteristic which was different between shrub land use and the other land uses was soil texture, which changed from sand (in shrub land use) to sandy loam in both orchard and farm land uses as the result of agricultural activities during the past half-century.
Moreover, the difference among land uses was significant in terms of soil organic carbon. Climatic conditions such as temperature and rainfall have great impacts on the amount of soil organic carbon. Naturally, accumulation of organic matter under the conditions of higher precipitation and cooler temperatures is higher; but, by contrast, decomposition of organic matter is higher under warmer and drier conditions [24]. In Jiroft plain, decomposition of organic matter is higher due to the low rainfall and hot and dry conditions, while production of organic matter is lower owing to the unfavorable climatic conditions. Therefore, soil organic carbon content in all the three land uses is low. Fertilization and irrigation caused organic carbon content to be higher in orchard and farm land uses than shrub one. Through affecting production, fertilization increases plant residue and consequently soil organic matter. On the other hand, irrigation delays the decomposition of organic matter by increasing soil moisture content[24-25].
Furthermore, cultivation of farm crops and establishment of citrus orchards in the region as well as consumption of nutrients as fertilizer led to the increase in the concentration of nutrient elements (N, P, K, Fe, Mn, Zn and Cu) in agricultural land uses compared to shrub land use.
The results obtained from PCA indicated that agricultural land use has had a significant impact on physicochemical soil characteristics. In figure 1, the position of vectors indicates how the intended properties in the studied land uses were changed. Considering the length and angel of vectors, sand percentage can be known as the effective factor in isolation of the soil samples representing shrub land. Besides, clay and CaCO3 content were effective in separating of soil samples representing orchard land. As is evident in figure 1, more soil properties were involved in isolation of soil samples representing farm land, among which OC, total N and EC were the most important properties.
As the findings of this study represent, there was lower bacterial species richness in shrub land use compared to the two other land uses; the possible reason can be low average of rainfall in the study area, which consequently leads to unfavorable soil moisture conditions for growth and reproduction of bacteria.
By contrast, favorable moisture conditions in soil and application of nutrients in the form of fertilizer in agricultural lands provided better conditions for bacteria growth and reproduction compared to the shrub land [26-27].
CCA technique was used for investigating some physicochemical soil properties influencing the structure of soil bacterial communities in various land uses. Ordination diagram obtained from CCA showed the position of the soil samples representing each land use in relation to the studied soil characteristics. Our results showed that differences in the structure of bacterial communities in the studied soils were significantly correlated to changes in soil properties. In orchard land use, clay and CaCO3 content had the greatest impact on the structure of bacterial communities; in shrub land use, the most important factor was sand percentage; and more factors were involved in farm land use, where according to the length of the vectors, OC, N and EC can be said to be more important. Because soil type was the same for the three studied land uses in 50 years ago, it can be assumed that changes in soil properties associated with land use change from shrub to agriculture[27-28].
In general, in line with the results of other studies, our results also showed that agricultural practices have strong impacts on physicochemical soil properties which will lead to shifts in the structure of soil microbial communities [28]. For example, researchers concluded that land use and soil properties were found as important factors determining the diversity and structure of bacterial communities[29-30].
Furthermore, other researches also showed that the application of mineral fertilizers can significantly affect structural shifts in the soil microbial communities [31-34].
Conclusion
This study, for the first time, reports that agricultural activities during the last 50 years in arid and semi-arid regions of southeast Iran, Jiroft County, caused a change in the structure of soil bacterial communities and some physicochemical soil characteristics of former shrub lands, which may permanently affect the natural soil ecosystem. Based on the results of the present study, it can be said that bacterial species richness in shrub land use was lower than agricultural land uses (orchard and farm); mainly because of hot weather and unfavorable soil moisture conditions. Therefore, it can be concluded that agricultural practices such as irrigation and fertilization improved the species richness of soil bacteria in agricultural land uses (orchard and farm) compared to shrub land use.
Finally, it is notable that generalizing and transferring of findings obtained at our studied region with specific soil properties cannot be accurate for other regions with different soil properties.
Acknowledgments
The project (3/31214) was financially supported by Ferdowsi University of Mashhad, Iran.
References
- Ranjard, L., Lejon, D.P.H., Mougel, C., Schehrer, L., Merdinoglu, D., Chaussod, R. Sampling strategy in molecular microbial ecology: influence of soil sample size on DNA fingerprinting analysis of fungal and bacterial communities. Environ. Microbiol., 2003; 5: 1111-20.
CrossRef - Moorthy, K. Isolation of Soil Bacteria for Bioremediation of Hydrocarbon Contamination. Biosci.Biotechnol.Res. Asia, 2010; 7(2).
- Eswar Ganesh Babu, T., Mastan, S.A. Isolation and Characterization of Bio-Degrading Bacteria from Soil Samples.Biosci.Biotechnol.Res. Asia, 2011; 8(1).
- Jangid, K., Williams, M.A., Franzluebbers, A.J., Sanderlin, J.S., Reeves, J.H., Jenkins, M.B., Endale, D.M., Coleman, D.C., Whitman, W.B.,. Relative impacts of land-use, management intensity and fertilization upon soil microbial community structure in agricultural systems. Soil Biol. Biochem., 2008; 40: 2843-53.
CrossRef - Lauber, C.L., Strickland, M.S., Bradford, M.A., Fierer, N. The influence of soil properties on the structure of bacterial and fungal communities across land-use types.Soil Biol. Biochem., 2008; 40: 2407-15.
CrossRef - Kowalchuk, G.A., Stienstra, A.W., Heilig, G.H.J., Stephen, J.R., Woldendorp, J.W. Molecular analysis of ammonia-oxidizing bacteria in soil of successional grasslands of the Drentsche A (The Netherlands). FEMS Microbiol. Ecol., 2000; 31: 207-15.
CrossRef - Marschner, P., Yang, C.H., Lieberei, R., Crowley, D.E. Soil and plant specific effects on bacterial community composition in the rhizosphere. SoilBiol. Biochem., 2001; 33: 1437-45.
CrossRef - Webster, G., Embley, T.M., Prosser, J.I. Grassland management regimens reduce small-scale heterogeneity and species diversity of ß-Proteobacterial ammonia oxidizer populations. Appl. Environ. Microb., 2002; 68: 20-30.
CrossRef - Miethling, R., Ahrends, K., Tebbe, C.C. Structural differences in the rhizosphere communities of legumes are not equally reflected in community level physiological profiles. Soil Biol. Biochem., 2003; 35: 1405-10.
CrossRef - Dahllof, I., Baillie, H., Kjelleberg, S. rpoB-based microbial community analysis avoids limitations inherent in 16S rRNA gene intraspecies heterogeneity. Appl. Environ. Microb., 2000; 66: 3376-80.
CrossRef - Peixoto, R.S., Coutinho, H.L.D., Rumjanek, N.G., Macrae, A., Rosado, A.S. Use of rpoB and 16S rRNA genes to analyse bacterial diversity of a tropical soil using PCR and DGGE. Lett. Appl. Microbiol., 2002; 35: 316-20.
CrossRef - Ovreas, L., Torsvik, V. Microbial diversity and community structure in two different agricultural soil communities. Microb. Ecol., 1998; 36: 303-15.
CrossRef - Smalla, K., Wieland, G., Buchner, A., Zock, A., Parzy, J., Kaiser, S., Roskot, N., Heuer, H., Berg, G. Bulk and rhizosphere soil bacterial communities studied by denaturing gradient gel electrophoresis: plant-dependent enrichment and seasonal shifts revealed. Appl. Environ.Microb.,2001; 67: 4742-51.
CrossRef - Smit, E., Leeflang, P., Gommans, S., van den Broek, J., van Mil, S., Wernars, K. Diversity and seasonal fluctuations of the dominant members of the bacterial soil community in a wheat field as determined by cultivation and molecular methods. Appl. Environ. Microb., 2001; 67: 2284-91.
CrossRef - Yi, S., Tay, J.H., Maszenan, A.M., Tay, S.T.L. A cluture-independent approach for studying microbial diveristy in aerobic granules.Water Sci. Technol., 2003; 47: 283-90.
CrossRef - Long, L.K., Yao, Q., Guo, J., Yang, R.H., Huang, Y.H., Zhu, H.H. Molecular community analysis of arbuscular mycorrhizal fungi associated with five selected plant species from heavy metal polluted soils. Eur. J. Soil Biol., 2010; 46:288-94.
CrossRef - Muyzer, G., de Waal, E.C., Uitterlinden, A.G. Profiling of complex microbial populations by denaturing gradient gel electrophoresis analysis of polymerase chain reaction-amplified genes coding for 16S rDNA. Appl. Environ. Microb.,1993; 59: 695-700.
- Hwang, S.Y., Jin, L.T., Yoo, G.S., Choi, J.K. Silver staining method for DNA in polyacrylamide gels using eriochrome black T as a silver ion sensitizer. Electrophoresis, 2006; 27: 1744-48.
CrossRef - Tao, S.Q., Xia, Q., Zhu, L., Chen, J.J., Wang, Y.N., Qin, B. Analysis of the bacterial communities in lime concretion black soil upon the incorporation of crop residues. Open J. Soil Sci., 2012; 9: 312-19.
CrossRef - Montecchia, M.S., Correa, O.S., Soria, M.A., Frey, S.D., Garcia, A.F., Garland, J.L. Multivariate approach to characterizing soil microbial communities in pristine and agricultural sites in Northwest Argentina. Appl. Soil Ecol., 2011; 47: 176-83.
CrossRef - Palmer, M.W. Putting things in even better order: the advantages of canonical correspondence analysis. Ecology, 1993; 74: 2215-30.
CrossRef - Steenwerth, K.L., Jackson, L.E., Calderon, F.J., Stromberg, M.R., Scow, K.M. Soil microbial community composition and land use history in cultivated and grassland ecosystems of coastal California. Soil Biol. Biochem., 2002; 34: 1599-611.
CrossRef - Gauch, Jr., H.G. Multivariate Analysis in Community Ecology. Cambridge University Press, Cambridge, 1999; 168 pp
- Tisdale, S.L., Nelson, W.L., Beaton, J.D., Havlin, J.L. Soil fertility and fertilizers, 5th edition. Macmillan Publishing Company, 1993; 634 pp
- Pan, G., Smith, P., Pan, W. The role of soil organic matter in maintaining the productivity and yield stability of cereals in China.Agr.Ecosyst.Environ.,2009; 129: 344-8.
CrossRef - Papatheodorou, E.M., Argyropoulou, M.D., Stamou, G.P. The effects of large- and small-scale differences in soil temperature and moisture on bacterial functional diversity and the community of bacterivorous nematodes.Appl. Soil Ecol., 2004; 25: 37-49.
CrossRef - Potthoff, M., Steenwerth, K.L., Jackson, L.E., Drenovsky, R.E., Scow, K.M., Joergensen, R.G. Soil microbial community composition as affected by restoration practices in California grassland. Soil Biol. Biochem., 2006; 38: 1851–60.
CrossRef - Koberl, M., Muller, H., Ramadan, E.M., Berg, G. Desert farming benefits from microbial potential in arid soils and promotes diversity and plant health. PLOS ONE, 2011; 6(9): e24452.
CrossRef - Hartman, W.H., Richardson, C.J., Vilgalys, R., Bruland, G.L. Environmental and anthropogenic controls over bacterial communities in wetland soils. P. Natl. Acad. Sci. USA., 2008; 105: 17842–47.
CrossRef - Wakelin, S.A., Macdonald, L.M., Rogers, S.L., Gregg, A.L., Bolger, T.P., Baldock, J.A. Habitat selective factors influencing the structural composition and functional capacity of microbial communities in agricultural soils, Soil Biol. Biochem., 2008; 40: 803-13.
CrossRef - Cruz, A.F., Hamel, C., Hanson, K., Selles, F., Zentner, R.P. Thirty-seven years of soil nitrogen and phosphorus fertility management shapes the structure and function of the soil microbial community in a Brown Chernozem. Plant Soil, 2009; 315: 173-84.
CrossRef - Wei, D., Yang, Q., Zhang, J.Z., Wang, S., Chen, X.L., Zhang, X.L., Li, W.Q. Bacterial Community Structure and Diversity in a Black Soil as Affected by Long-Term Fertilization. Pedosphere, 2008; 18: 582-92.
CrossRef - Zhong, W.H., Gu, T., Wang, W., Zhang, B., Lin, X.G., Huang, Q.R., Shen, W.S. The effects of mineral fertilizer and organic manure on soil microbial community and diversity.Plant Soil, 2010; 326: 511–22.
CrossRef - Wu, F.S., Gai, Y.F., Jiao, Z.F., Liu, Y.J., Ma, X.J., An, L.Z., Wang, W.F., Feng, H.Y. The community structure of microbial in arable soil under different long-term fertilization regimes in the Loess Plateau of China. Afr. J. Microbiol. Res., 2012; 32: 6152-64.
CrossRef

This work is licensed under a Creative Commons Attribution 4.0 International License.


