

Manuscript accepted on : 20 December 2016
Published online on: --
Plagiarism Check: Yes
Prediction of Dose Calculation of Breast and Chest Tumors using Different Algorithms
S. Ahmed1,4 ,Ehab M. Attalla2,5 , M. E. Abdelwanis4, Y. Saddeek3, E. Shaaban3 and Nizam Uddin Farooqui6
1Department of physics, Rabigh college of science and arts king abdulaziz university,21911Rabigh, Saudi Arabia.
2Radiotherapy and Nuclear Medicine Department, National Cancer Institute, Cairo University, Cairo, Egypt.
3Department of physics Alazhar university Assiut branch Assiut Egypt.
4Department of radiotherapy and nuclear medicine south Egypt cancer institute Assiut university Assiut Egypt.
5Children Cancer Hospital, Cairo, Egypt.
6Department of Biological Sciences, Rabigh college of science and arts king abdulaziz university,21911Rabigh, Saudi Arabia.
DOI : http://dx.doi.org/10.13005/bbra/2409

ABSTRACT: This work significantly observes the suitable of algorithms by comparing the dose calculation of breast and chest tumorsusing Clarkson, Convolution, Superposition and Fast Superposition algorithms in three-dimensional Conformal Radiotherapy (3D-CRT). Thirteenpost-operativebreast casesand fifteen cancer chest patients were taken in this work. Treatment plans were createdusing 6 and 15 MV Photon beam qualitywith the CMS XiO treatment planning system (Computerized Medical System, St. Louis, MO). Statistical analysis was done by relating the mean relative difference, conformity index, and homogeneity index for target structures. The percentage of differencenoted between algorithms were9.4%, recorded with a low density point in case of breast. Superposition and fast superposition algorithm were presentedvery good results in both cases in view of the mean relative variancesusing a prescribed dose with four algorithms andthe lowest relative variableusing a given dose in different treatment techniques PTV. Superposition algorithm exposed good calculations in all techniques. Clarkson algorithm showed monotonically variation in the dose calculation points and histogram parameters. The other three algorithms are shown approximately similar results. we found from the dosimetric results aconsiderable differenceamongfour algorithms.Conferring to this study, the algorithms varied.Significant upkeep must be occupied when calculating treatment plans, as the selection of the dose computation algorithm may affected on treatment planning as well as clinical effects.
KEYWORDS: Algorithm; chest tumors; cancer breast; homogeneity index; treatment planning system
Download this article as:| Copy the following to cite this article: Ahmed S, Attalla E. M, Abdelwanis M. E, Saddeek Y, Shaaban E, Farooqui N. U. Prediction of Dose Calculation of Breast and Chest Tumors using Different Algorithms. Biosci Biotech Res Asia 2016;13(4). |
| Copy the following to cite this URL: Ahmed S, Attalla E. M, Abdelwanis M. E, Saddeek Y, Shaaban E, Farooqui N. U. Prediction of Dose Calculation of Breast and Chest Tumors using Different Algorithms. Biosci Biotech Res Asia 2016;13(4). Available from: https://www.biotech-asia.org/?p=17446 |
Introduction
The radiotherapy isuseful toprovide a given dose to tumor specifically while minimizing dose to critical organs. The radiation dose is abasis of the process, which also includes dose computation and delivery of radiation beam. The previous is the mainsection of a treatment planning system. Accuracyand features of any treatment planning system (TPS) are dependent on the type of algorithms which used in steps of the planning procedure. An algorithm is defined as a sequence of instructions that operates on a set of input data, converting that information into a set of ultimate results that are of interest to the user. Many algorithms are used in the treatment planning progression. The most recognizeddose calculation algorithm thatgenerates the dose at any point in the patient while taking into accountbeam characteristicsand the patient[1]. It is aprincipal importance for the present conformal radiotherapy technique to have accuracy in dose computations in almost all applicable clinical situations. Treatment of lung tumors is One of these situations where irradiation has to be planned under stimulating conditions for dose calculation[2]. Thepatient dose predictions accuracy has continuously improved by moving from the simple scatter inhomogeneity corrections over pencil beam algorithms to point kernel-based Convolution/Superposition methods[3]. In our study Clarkson, convolution, superposition, and fast superposition algorithms were applied to all plans. Our aim of thisstudy to compare the resultsfromfour algorithms, Six dissimilar points, demonstratingdifferent heterogeneity conditions andposition using 3D-CRT“Three-Dimensional Conformal Radiotherapy (3D-CRT)“ Technique. This helpfulfor knowing the suitability of an algorithm for the particular diagnostic and treatment technique. Conformity Index, Homogeneity Index, Mean Dose, and Mean Relative Difference have been used to evaluate the external beam plans. Also, Dose Volume Histograms (DVH) for different structures were calculated to quantify the dose to the other OARs.
Materials and Methods
Patients and techniques
Twenty eight Cancer patients wereexamined for two treatments position in the chest region:thirteen breast cases tangential 6,15 MV photons to the chest wall with 2-4 fields for treatment, The other fifteenpatient inside chest wall treated with 2-6 fields with 6,15 MV photon beam. Doses of 200 cGy/Fraction, were set to the planning target volume of the breastand other chest legion. Planning Target Volume (PTV) was getting drawn using the 5mm isotropic extension of the Clinical Target Volume (CTV), which in turn was gained from the macroscopic Gross Tumor Volume (GTV). The PTV was made to eliminate other OARs by 5mm[4].Treatment planning designs for the target and OARs were created using 6MV, 15 MV and mixed 6and15 MV Photon beam quality using Clarkson, convolution, superposition, and fast superposition algorithms. For each patient, six points are selected to compare dose calculation for different algorithms, which used include isocenter of PTV,3cm from isocenter, 0.5cm under skin, low and high density, and point under the block. Commercially available CMS XiO (Computerized Medical Systems, USA) Planning system was used for planning purposes.
Dose Calculation Algorithms
Four calculation algorithms used to calculate the radiation dose for all plans which were formed through this study. The XiO’s fast-Fourier transform (FFT) convolution algorithm, and the superposition (Wiesmeyer and Miften) [5]. Algorithms are comparable that, they both calculate the dose by considering the total energy released in the patient with Monte Carlo-generated energy deposition kernels, computed by Mackie et al. [6]. The kernel is the dose matrix created per unit TERMA at the collaborating sites. Total energy released per unit mass (TERMA) producefrom the mass attenuation coefficient and the essential energy flounce[7]. The selection of dose calculation algorithms is a serious respect when using “high-ended” planning procedures and comparing one method with another[8–10].
Clarkson Sector Integration Algorithm
One of the most fundamental modified algorithm uses patient data, treatment machine data, and setup information to simulate dose distributions inside the patient. The patient data contain relative electron density information whichcharacterizes a sector of the patient. These have been earliercreated by assignment density values in areas incorporated by marking contours or by granting the CT to comparative electron density conversion of patient image data. For a 3-D plan, only transverse patient data are used in the dose computation; Data of The treatment machine required for the Clarkson algorithm must include a set on the diagonal off-center ratios (OCDs), a band of tissue maximum ratios (TXRs) which comes from TAR or modified TPR values, information about the various beam modifiers and different machines (energy) specific constants. If the beam has a multileaf collimator or customized port; the transmissions and outlines of the blocked areas need to be implanted The algorithm takes into account initial dose correction for inhomogeneity in the patient and the transmission by the wedge and bolus, compensators and blocks. Furthermore, the Clarkson algorithm does not take into account scatter modifications due to differences in field intensity (wedges), patient density, or surface curvature. It contracts into account scatter modifications due to field shape. The Clarkson scatter calculation does not accurately the model dose for forked structures because it does not consider the scatter reduction of the air space between the separated contours. Each ray is calculated individually and then the beams are summed together.The full dose of all beams represent the dose that received by the patient [1].
Convolution Algorithm
The energy deposited kernels of Mackie et al[5]. Must be interpolated from spherical to Cartesian coordinates on a common grid with the TERMA to complete the FFT convolution. Sampling and interpolation of kernels from spherical to Cartesian coordinates are complicated by steep kernel gradients. Adaptive quadrature techniques certify that the correct energy in and near the interaction point is characterized in the Cartesian coordinates.
Evaluation of calculation outcomes specifies that incorrect doses are found if the effect of spread from the neighbors is omitted over a large enough area. It is essential that data of the patient be denoted over a 3D volume since the scatter consideredas a point is based on the 3D volume of the scattering intermediate.The essential volume over which scatter of kernel contributions must be necessitated and the maximum volume used in XiO planning system is close to 30cm in the forward direction, 5cm in the backward direction, and replicate the field size dimension laterally (basically the contributions from all interaction points must be collected). Sharpe and Battista [11]have reported the same ranges, as well as Mackie et al. [12,13] have described the same obligatory lateral range.
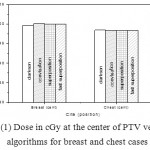 |
Figure 1: Dose in cGy at the center of PTV versus algorithms for breast and chest cases
|
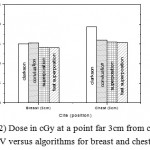 |
Figure 2: Dose in cGy at a point far 3cm from center of PTV versus algorithms for breast and chest cases
|
As well as dose contributions above such a large area needs a significant time for computation. This computation time can be reduced by accomplishment separate calculations; one with the main core for which the computation is done at a high resolution, but over a small region, the other with a scatter kernel where a computation is achieved at a lower resolution but over a large area, as suggested by Mackie et al.[5, 8]. This method is possible for the primary kernels have particularly large gradients close to the point of interaction, but they make no contribution outside a few centimeters from the interaction point, whereas, the scatter kernels have smaller gradients but contribute the dose over a much larger range. The XiO planning system completes a separate high and low resolution FFT calculated for the primary and scatter kernels, saving a time of about 65% over accomplishment a single calculation at high resolution.
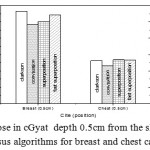 |
Figure 3: Dose in cGyat depth 0.5cm from the skin surface versus algorithms for breast and chest cases.
|
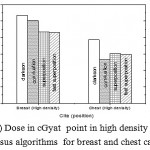 |
Figure 4: Dose in cGyat point in high density regions versus algorithms for breast and chest cases
|
Superposition Algorithm
The XiO superposition dose accumulated method is a modification of the “collapsed cone” dose calculation process [9]. As with FFT Convolution, all calculations of superposition are done with coordinates of the beam. The dose in the beam coordinates is interpolated to the user quantified calculation volume. It is conceivable for superposition algorithms to directly imitate the kernel calculation method; that is, to compute deposited energy by dispersion the energy released (TERMA) at the collaboration points to points in the interest volume, according to the distribution obscure by the kernel. This method is recognized as the “interaction point of view”.Dissimilar to the FFT convolution algorithms, the superposition algorithm energy deposition kernels can be adjusted to account for fluctuations in electron density.The density scaling method, based on O’Connor’s theorem [14] is applied to distort the kernels by finding the average density along the straight-line path between the interaction site and dose deposition site[15]. A good approximation for scattered photons is Density scaling, because the photons move in straight lines and the mass attenuation coefficient scales linearly with the material density (assuming that the atomic number remains unchanged).
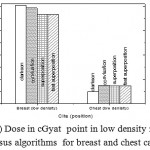 |
Figure 5: Dose in cGyat point in low density regions versus algorithms for breast and chest cases
|
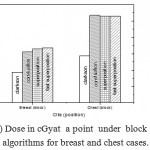 |
Figure 6: Dose in cGyat a point under block versus algorithms for breast and chest cases.
|
Fast Superposition Algorithm
Spherical kernels, or “dose spread arrays”, are cylindrically symmetric and well-defined in terms of rays drawn along zenith and azimuth angles. The spherical kernel computation has been enlarged with the ability to combine (select and sum) adjacent zenith rays in the center.Therefore, it is possible to determine the quantity and direction of zenith rays for the function of adjusting speed/accuracy.
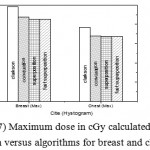 |
Figure 7: Maximum dose in cGy calculated from histogram versus algorithms for breast and chest cases.
|
Trade offs: The less the rays, the quicker and less accurate the calculation, The more the rays, the denser and more accurate the calculation.Although the azimuth angles must be evenly spaced, Control of both the number and direction of zenith rays and azimuth rays is possible,.The fast mode provides a fast superposition dose calculation with a speedup factor of 2.5cm at the monetary value of a small loss in accuracy, compared to the “standard” superposition calculation.
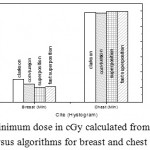 |
Figure 8: Minimum dose in cGy calculated from histogram versus algorithms for breast and chest cases.
|
Dose Reporting and Evaluation
All patients plan calculated to receive 200 cGy through two or more treatment field. Weight values rangingfrom 1 to 100. The weight applied to decrease or increase the dose over the whole volume of the structure.For each patient, dose volume histograms (DVHs) were produced utilizing the CMS XiO planning system for 3DCRT plan.Single dose-volume point were also registered. Minemum dose, maximum dose, and mean dose were estimated for the PTV and OARs. And Uniformity Index Conformity Index were calculated for PTV in all instances.Relative dose volume differences (percentage) between the outcomes of the different dose calculation algorithms were computed. Maximum percent variation between algorithms were recorded for PTV, for all cases. All the sets of treatment plans were assessed utilizing a lot of evaluation parameters, which complied with the evaluation criteria recommended by the international committee on radiation units and measurements (ICRU) Report 62 [15,16]. The evaluation parameters included the homogeneity index (HI) and the conformity index (CI). The CI was defined as the quotient of the treated volume and the intensity of the PTV [16].The conventionally used homogeneity index (H-index) is defined as the ratio of the maximum dose in the PTV to the prescribed dose with a value closer to 1 indicating better homogeneity [17]. The H-index commonly varies from 1 to 1.5 in the practical patient treatment plans. The index’s simplicity has led to its being extensively used for quantifying dose homogeneity in tumor volumes. For the evaluation of doses to the OARs, the mean dose was used.
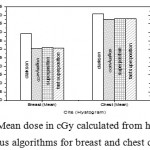 |
Figure 9: Mean dose in cGy calculated from histogram versus algorithms for breast and chest cases.
|
Results and Discussion
Fig. (1) Showed in significant variation in the dosmetric study of the central point of PTV in both breast and chest cases between four algorithms was used. The maximum percentage of variation was 0. 24% with breast cases, this ratio decreases to 0.03% in cases of chest. As shown in Fig (2) we detect as mall variation in dose appeared at a point far 3cm from the central point which have a percentage 0.6% of breast cases. This variation percentage increase to 2% in the cases of chest. Fig. (3) Declared a large change in the doses which calculated at the point have 0.5 cm depth of skin service with breast cases, where the mean percentage of variation in the dose calculation between four algorithms up to 7.9%. At the same point, a significant change was detected in the cases of chest with a dose variation percentage 3.2%, it’s clear the variety between four algorithms in same point dose, thus due to the error, in the dose calculation in the area near skin service with tangential field. We can observe the relative highest in dose which calculate by Clarkson algorithm, where its take in a consider scattering dose from one slid not from hall volume,while this variation decreases to 3.62% in the cases of chest because the opposite field solve partly the error in dose skin calculation.Fig. (4) And fig. (5) represent dose in high and low density regions respectively, A significant variations found with in homogeneity regions represented by points in high density (bone), low density (lung) where the percentage was 3.01% and 6.2%, respectively, in the cases of chest. On the other hand, in the case of breast these percentage increase to 9.4% at low density region this is due to most of low density area (lung) in the breast field located in penumbra region. While this percentage decreases to 2.62% high density region (bone). As clear in fig (6) At a point in a protected area in the case of chest, we found a consider percentage of variation about 6.2, the main reason of this variation bake to the dose which calculated by Clarkson algorithm, where it didn’t take in consider the internal scatter, we note the main variation with doses calculated by Clarkson algorithm and the other three algorithms have a close value. Figs. (7), (8) and (9) showed Maximum, minimum and the mean dose of PTV for both breast and chest cases which obtained from histogram calculated by each algorithm, the percentage of variation in maximum dose going to 3.26 % and 2.4%, this percentage became 5.2% and 1.2% with a minimum dose of cases of breast and chest respectively. Same variation detected in the mean dose where it founded about 4.4% in the case of breast and 1.63% in the case of chest.The increasing of these parameters with breast cases, related to the PTV of the breast has more in homogeneity than chest cases. Also histogram gives us a percentage of volume, which received 190cGy (95% of the dose),The difference of these percentages founded as 5.51%,3.44%of the breast and chest cases respectively as shown in fig. (10). Fig. (11) explained Same behavior founded with 200 cGy(100% of the dose) where it appears as 7.4% and 6.8% in the breast and chest cases respectively.
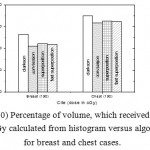 |
Figure 10: Percentage of volume, which received dose 200 cGy calculated from histogram versus algorithms for breast and chest cases.
|
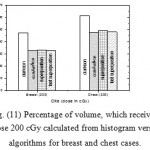 |
Figure 11: Percentage of volume, which received dose 200 cGy calculated from histogram versus algorithms for breast and chest cases. |
Conclusion
Dose calculated four 28 breast and chest cases, by four different algorithms understudies gives the same values approximately at center point. Except in very small variation with the case of breast, because no difference in field intensity or tissue in homogeneity at the center in both cases. When we are far from the center a considerable percentage of variation appears, as we see in points, which located at three centimeters from the center. This variation was clear with the doses which calculated by Clarkson algorithm due to the Clarkson algorithm does not take into account scatter modifications due to the field intensity (wedges) so this variation increase in the case of chest. This variation decreases in the case of breast. At the point of depth of 0.5 cm of the skin surface, large variation appear in dose which calculated by convolution algorithm and superposition algorithm recorded in the case of breast this Similarity due to both algorithms compute the dose by convolving the total energy released in the patient so they need a large volume of scatter that’s Explains why The variation decrease in the case of chest. The largest value of the dose variation recorded in the case of breast at the point of low density, where the dose calculated by Clarkson and convolution algorithms were convergent, and more than which one calculated by superposition and fast superposition algorithms, which also close.
References
- Kirloskar T. Advantages of multiple algorithms support in treatment planning system for external beam dose calculations. J Cancer Res Ther. 2005;1:12–20.
CrossRef - Garcia-Vicente F, Minambres A, Jerez I, Modocell I, Perez L, Torres JJ. Experimental validation tests of Fast Fourier Transform convolution and multigrid superposition algorithm for dose calculation in low density media. Radiother Oncol. 2003;67:239–49.
CrossRef - Vanderstraeten B, Reynaert N, Paelinck L, Madani I, De Wagter C, De Gersem W, et al. Accuracy of patient dose calculation for lung IMRT: A comparison of Monte Carlo, convolution/superposition, and pencil beam computations. Med Phys. 2006;33:31-49.
CrossRef - De Neve, Wilfried, Yan Wu, and Gary E. “Practical IMRT planning.”Image-guided IMRT. Springer, Berlin Heidelberg, 2006: 47-59.
- Mackie TR, Scrimger JW, Battista JJ. A convolution method of calculating dose for 15 MV X-rays. Med Phys. 1985;12:188–96.
CrossRef - Wiesmeyer MD, Miften MM. A Multigrid approach for accelerating three-dimensional photon dose calculation. Med Phys. 1999;26:11-49.
- Khan FM. The physics of radiation therapy. USA: Lippincot Williams and Wilkins; 2003.
- Beavis AW, Abdel-Hamid A, Upadhyay S. Re-treatment of lung tumor using a simple intensity-modulated radiotherapy approach. Br J Radiol. 2005;78:358-61.
CrossRef - Miften MM, Beavis AW, Marks LB. The influence of the dose calculation model on Treatment plan evaluation in conformal therapy:A three case study.Med Dosim.2002;27:51-7.
CrossRef - Jeraj R, Keall PJ, Siebers JV. The effect of dose calculation accuracy on inverse treatment planning. Phys Med Biol. 2002;47:391–407.
CrossRef - Sharpe MB, Battista JJ. Dose calculations using convolution and superposition principles: The orientation of dose spread kernels in divergent X-ray beams. Med Phys.1993;20:1685-94.
CrossRef - Mackie TR, El-Kathib E, Battista J, Scrimger JW, Van Dyk J, Cunningham JR. Lung dose corrections for 6-and 15-MV X-rays. Med Phys. 1985;12:327-32.
CrossRef - Ahnesjö A. Collapsed cone convolution of radiant energy for photon dose calculation in heterogeneous media. Med Phys. 1989;16:577–92.
CrossRef - Hogstrom KR, Mills MD, Meyer JA, Palta JR, Mellenberg DE, Meoz RT, et al. Dosimetric evaluation of a pencil-beam algorithm for electrons employing a two-dimensional heterogeneity correction. Int J RadiatOncolBiol Phys. 1984;10:561–9.
CrossRef - Wu VW, Sham JS, Kwong DL. Inverse planning in three-dimensional conformal and intensity-modulated radiotherapy of mid-thoracic esophageal cancer. Br J Radiol 2004;77:568-72.
CrossRef - Wambersie A, Landberg T, ICRU Report 62: Prescribing Recording and Reporting Photon beam Therapy (Supplement to ICRU Report 50) 1999; Perkins CL, et al. JOP. J Pancreas (Online) 2006;7:372-81.
- Yoon M, Park SY, Shin D, Lee SB, Pyo HR, Kim DY, et al. A new homogeneity index Based on statistical analysis of the dose volume Histogram. J ApplClin Med Phys 2007;8:1-8.
CrossRef

This work is licensed under a Creative Commons Attribution 4.0 International License.


