
Localized Surface Plasmon Resonance Biosensor for Detection of Serum Prostate Specific Antigen in Prostate Cancer Patients
1Department of Immunology, Shahid Sadoughi University of Medical Sciences and Health Services, Yazd, Iran.
2Faculty of New Science and Technology, University of Tehran, Iran.
3Protein Research Centre, Shahid Beheshti University, Tehran, Iran.
4Medical Nano-Technology and Tissue Engineering Research Center, Department of Tissue Engineering and Regenerative Medicine, School of Advanced Technologies in Medicine, Shahid Beheshti University of Medical Sciences, Tehran, Iran.
Corresponding Author E-mail: *m_omidi@sbmu.ac.ir
DOI : http://dx.doi.org/10.13005/bbra/2394
Download this article as:
![]()
Prostate specific antigen (PSA), as a tumor biomarker, plays an important role in early cancer detection, prognosis prediction and treatment evaluation for prostate cancer patients. In particular, therefore, identification of sensitive and specific methods for early cancer detection is required.so one of the method for early cancer detection are Localized surface plasmon resonance (LSPR) technique based on noble metal nanoparticles. Herein, we develop a novel LSPR biosensor for the detection of PSA. First, gold nanoparticle was prepared using turkevich method. To achieve the goal, anti-PSA was covalently conjugated to gold Nano spheres using 11-Mercaptoundecanoic acid (MUA). Finally, sample serum was investigated by localized surface Plasmon resonances and finally, the results obtained by LSPR and Chemiluminescence assay were compared with each other. The results suggested that LSPR sensor had good potential and good sensitivity in detecting of total PSA. The proposed Nano bio-optical sensor delivered a good sensitivity with average sensitivity 1.1 ng/ml, and a low detection limit of o.9 ng/ml. Our study represents the application of the LSPR biosensor in prostate cancer, and demonstrates that this method have good sensitivity, selectivity the and short assay time
KEYWORDS:localized surface plasmon resonance; biosensor; prostate cancer biomarker; prostate specific antigen
Introduction
prostate cancer is a major health issue in the world .It is third most common cancer , occurring mostly in men older than 50 years[1] .early detection of the prostate cancer is important for decreasing the mortality rates. Human Prostate-specific antigen (PSA) was detected in 1980[2]. PSA a 32 -33 kd single -chain glycoprotein is found in serum, seminal plasma, benign hyperplastic and prostatic fluids, so it is a well-known tumor biomarker for prostate cancer screening and monitoring after treatment. the serum of men have naturally trace levels of PSA but prostate cancer tumor growth leads to increasing levels of PSA in serum. [3, 4], A PSA level below 4ng/ml is regarded as negative ;between 4-10 ng/ml is gray zone and A total PSA level (i.e.free PSA plus ACT-bound PSA) above of 10 ng/ml or higher is regarded as positive and a highly probable indication for prostate cancer[5].
Enzyme-linked immunosorbent assays (ELISA), chemiluminescence immunoassay (CLIA), radioimmunoassay and fluorescent immunoassay (FIA) are some methods for PSA detection [4, 6]
At the present, most tumor biomarker is analyzing with large and automated instrument and most of these analyzers are time-consuming and high cost[7].The using of biosensor as diagnostics tools is one of the way to improve of some of problems such as sensitivity , accuracy ,fast ,easy to use and inexpensive methods of analysis biosensor can play a great role for in the early detection cancer[7].Biosensor is diagnostics device for analyzing of biomaterial sample by converting of biological response into an electrical signal .there are many various biosensor that include calorimetric, potentiometric, aerometric, piezo-electric and optical biosensors[8]. Localized surface Plasmon resonance (LSPR) technique based on gold nanoparticles is good methods because it has good sensitivity, good selectivity and short assay time[9].
LSPR is a noble characteristic of metallic nanoparticle, caused by the collective oscillation of free electrons by incidence light. Nanoplasmonic phenomenon is an intensive absorption and scattering of light come from in 3-dimensional metallic nanoparticle [6, 10].
shape, orientation, size, composition and local dielectric environment of nanoparticles are factors which can effect of LSPR extinction spectrum in in the ultraviolet (UV)–visible region[9].
bio-molecular interactions can change of the local refractive index near the nanoparticle surface and the peak wavelength of the LSPR extinction spectrum (λmax) is very sensitive environmental refractive indexes, so This optical property enables metallic nanoparticles to serve in different fields such as medical diagnosis, environmental monitoring, drug screening and food safety[11-14].
Moreover, the LSPR biosensor has advantages in biomarker detection, rapid test time, low cost, and direct assay format, unlike approaches; and compared with the traditional immunoassay(e.g., ELISA, CLA) [15].
Material and method
Materials
All chemicals were obtained from commercial sources. hydrogen tetrachloroaurate (III) (HAuCl.43H2O, Alfa Aesar,99.99%) and trisodium citrate (Na3C6H5O7_ 98% ) came from Merck co.,Ltd(Germany). 1-ethyl-3-[3-dimethylaminopropyl] carbodiimide hydrochloride(EDC) was obtained from Sigma-Aldrich com.Ltd(India), N-hydroxysuccinimide(NHS) and 11- Mercaptoundecanoic acid (11-MUA) were obtained from Sigma-Aldrich co.Ltd(Japan) and human serum albumin (HAS) were obtained from Sigma-Aldrich co.Ltd(USA). Mouse anti-Total PSA antibody was obtained from Abcam Co., Ltd (USA). Sorbitan monolaurate (Tween-20) was purchased from Merck Co., Ltd (Germany). All other reagents were of analytical reagentgrade and deionized water with an electric resistivity 18.2 M_·cm was used throughout.
Patients and samples
The human serum samples from prostate cancer patients were collected from shahid beheshti University Hospital (Tehran, People’s Republic of Iran). Written informed consent was not obtained. Sera were isolated from whole blood samples via centrifugation at 3,000 rpm for 15 minutes, and subsequently kept frozen at -80°C until analysis.
Instrumentations
The optical absorption spectra were recorded with a UV-3600 spectrophotometer (England). The TEM images were measured with a JEM-200CX transmission electron microscope (Philips, Japan). The samples for taking TEM imagines were prepared by evaporation of a drop of nanoparticles/bio conjugates solution on carbon films supported on standard copper grids. The exact pH value was obtained using a PP-50 pH meter (Sartorius, Germany)
Preparation of Gold Nanoparticles
In a typical synthesis route, GNPs were synthesized with diameters in the range of 12–22nm through sodium citrate reduction of hydrogen tetrachloroaurate (III) (HAuCl43H2O). Briefly, 50mL of 0.3mM (HAuCl43H2O) was brought to a vigorous boil with stirring; subsequently, 5mL of 5mM sodium citrate was added rapidly to the solution. This solution was boiled for another 15 min, during which time the solution changed color from pale yellow to deep red. The solution left to cool to room temperature, and then stored in a refrigerator until to use. The resulting colloidal gold solutions were characterized by visible absorption spectra and transmission electron microscope.
11-MUA assembles on citrate stabilized gold nanoparticles according to the procedure described in Ref. [41]In brief, 9.0 mL phosphate buffer (10 mM ,pH 7.0with 0.2 mg/mL Tween-20) was added to 18.0 mL gold nanoparticles and the obtained solution was allowed to stand for at least 60 min. Then 18 mL 11-MUA solution (0.5 mM in 1:3 alcohol/H2O) was added the mixture, followed by a gentle shake for 5 h. after shaking centrifugation was carried out in 1.5 mL
Tubes using a 5415D centrifuge (Eppendorf, Germany) at a speed of 16000 × g rcf. Every tube contained 1.0 mL mixture. The centrifugation procedure was kept for 30 min and repeated three times. The supernatant containing alkane thiol of every tube was removed, while the sediment was resuspended in 1 mL phosphate buffer (10 mM, pH 7, with 0.2 mg/mL Tween-20).
The activation of hydroxyl-terminal groups was performed with the presence of EDC and NHS [16-18]. In detail, a mixture solution (200μL) of freshly prepared 200 mM EDC and 50 mM NHS was added to 11-MUA modified gold nanoparticles solution and the mixture was allowed to incubate for 10 min. The resulted mixture in every tube was centrifuged to remove unreacted EDC/NHS and dispersed in 1 mL phosphate buffer as described above. This mixture were finally dispersed under ultra-sonication.
Attachment with PSA Antibody
Mouse anti-PSA antibody was coupled to the gold nanoparticles via displacing the NHS group with the lysine residues of the antibody.36 As such, 200 μL solution of mouse anti-PSA antibody (4 μg/mL) was added to the suspension of gold nanoparticles with NHS ester groups in every tube. The mixture was then incubated at 4 °C for at least 3 h. After centrifugation at 16,000×g for 20 min and removal of the supernatant, the sediment in every tube was dispersed in 1 mL of 10 mM phosphate buffer (pH 7.4).
Serum sample detection
Under the room temperature, every tube contained 0.5 mL Antibody Coated Gold Nanoparticles was added 50 μL serum sample and incubate for 20 min and LSPR peak serum sample was measured by UV-visible spectrophotometer ranging from 400 nm to 800 nm.
Results and Discussion
To figure out of optical properties of Nano-particles and Particle size distribution and geometry and Surface charge of nanoparticles, optical absorption spectroscopy, TEM and DLS were performed. Figure .1 shows the optical absorption spectra of different AuNPs in each stages, in which the curve peak shows the characteristic surface Plasmon resonance (SPR) of AuNPs[19].
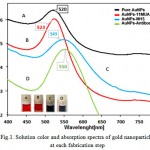 |
Figure 1: Solution color and absorption spectra of gold nanoparticles at each fabrication step |
The SPR of Pure gold nanoparticles with red color (curve A) is about 520 nm. The and the SPR shifts to 523 nm after chemisorption of 11MUA and color of gold nanoparticles changes to dark red (curve B).by Au–S It is obvious that a formed dielectric monolayer of 11-MUA had been on around AuNPs and alkane thiol molecules are adsorbed on surface of gold nanoparticles by interaction between Au-s[20, 21].the COOH terminal of 11-MUA , the SPR peak at 543 nm (curve c) . The obvious red shifting and changing color suggest that the NHS-terminated gold nanoparticles with a partial aggregation colloidal particle aggregation because the NHS esterification of terminal carboxyl group can charge neutralization and lose ionizable carboxyl groups on nanoparticle surface during the activation using of EDC/NHS[22, 23].finally, the gold nanoparticles/antibody solution (curve d) displays a SPR peak at 550nm. The SPR peak shifting and purple color final bioconjugate solution is only 27 nm compared with MUA-modified AuNPs, suggest that gold nanoparticles with antibody had coupled.
Figure .2 shows the FT-IR spectra of AuNPs. For citrate-stabilized AuNPs, absorbance at about 1690 cm-1 represents the citrate component by an evidential carboxylate groups (curve a)[23]. Peaks obtained from FTIR analysis represents a good functional groups on the surface of gold nanoparticles. For MUA modified AuNPs, the distinct peaks appeared at 2849 cm-1 are ascribed to the vibrational stretches of –CH2 groups of long alkane chains, For NHS-terminated AuNPs, the peak at 1742 cm-1 assigned to the succinimidyl carbonyl group, and the two weak peaks at 1830 and 1782 cm-1 assigned to the band splitting of the ester carbonyl C=O stretching vibration (curve b)[23]. For the Antibody/AuNPs bioconjugates, the peaks at 1650 and 1540 cm-1 assigned to the secondary amide C=O stretching(curve c)[23, 24]. Therefore, FT-IR results show component information of different modified AuNPs. The morphology of different modified AuNPs was characterized by TEM. Fig 3 shows the good dispersity of citrate-stabilized AuNPs with unique size of about 20.27 nm in diameter. Moreover, the citrate-stabilized AuNPs were further analyzed by DLS as shown in Fig 4 and the average diameter of the nanoparticles are obtained 27.98 nm. The DLS results show information of the aggregation ratio. The aggregation ratio obtained by DLS measurement by divided by values of TEM. If the aggregation ratios is closer to 1, nanoparticle is more stable[25]. In this study, the aggregation ratios was obtained 1.38 which indicated stability of nanoparticles.
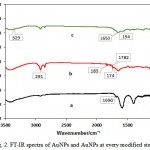 |
Figure 2: FT-IR spectra of AuNPs and AuNPs at every modified step |
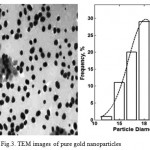 |
Figure 3: TEM images of pure gold nanoparticles |
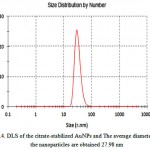 |
Figure 4: DLS of the citrate-stabilized AuNPs and The average diameter of the nanoparticles are obtained 27.98 nm |
The LSPR sensor were incubated in different concentrations of standard total PSA solution ranging from 1 ng/ml to 50 ng/ml under optimal conditions, and LSPR peak were obtained with peak shifts recorded. Mean value and standard deviation of ∆λmax were calculated, since each concentration measurement was repeated three times. As shown in Figure 5, the LSPR ∆λmax values increased stepwise with increasing total PSA concentrations and were Exponential equation. Correlation coefficient (R) of 0.9987 and the limit of detection (LOD) in the present method is 0.9 ng/mL which was obtained by the equation LOD=3 (SD/S). The average sensitivity of the LSPR method for total PSA 1.1 ng/ml was obtained.
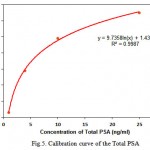 |
Figure 5: Calibration curve of the Total PSA |
In this study, we investigated the practicability of the proposed LSPR sensor for detecting Total PSA in human serum. Total PSA concentration of each serum sample was calculated according to the Exponential regression equation. A series of six serum samples from prostate cancer patients were analyzed and the results were compared with chemiluminescence assay (Fig. 6).
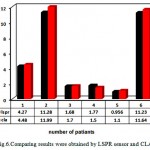 |
Figure 6: Comparing results were obtained by LSPR sensor and CLA |
The selectivity is known as a key parameter in LSPR sensors. To investigate the selectivity of this sensor, the influences of various tumor marker (CEA, CA125, CA19-9, BHCG, and Alb) in the certain concentration were tested (Fig.7). The results indicate that, no significant shift is observed in samples containing other tumor marker. The results demonstrate that in the present method a high selectivity for the sensing of total PSA [25-29].
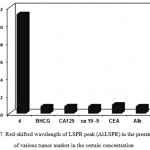 |
Figure 7: Red-shifted wavelength of LSPR peak (ΔλLSPR) in the presence of various tumor marker in the certain concentration |
To study the effect of the time stability, the detection of total PSA at different times are performed (Fig.8). The results show that after 20 day (at 4∘C) the sensor response change is only about 32% [31].
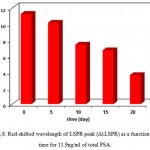 |
Figure 8: Red-shifted wavelength of LSPR peak (ΔλLSPR) as a function of time for 11.9ng/ml of total PSA. |
Conclusion
This method can be successfully used as an LSPR-based sensor for total PSA. We fabricated antibody covalently gold nanoparticles using 11-MUA as the linker. The localized surface plasmon resonance (LSPR) as a tool for interaction between antigens and antibodies immobilized on the surface of gold nanoparticles were used .The present results show that when the nanoparticles such as AuNps are used, the sensitivity and selectivity of LSPR sensor for sensing of total PSA can be improved. In addition, the sensor also shows a good stability. The amount of average sensitivity and low detection limit of the LSPR sensor for total PSA respectively 1.1 and 0.9 ng / ml was calculated .This method is rapid, selective, and highly sensitive assay and it has potential applications in assay for other tumor marker.
Reference
- Siegel, R.L., K.D. Miller, and A. Jemal, Cancer statistics, 2015. CA: A Cancer Journal for Clinicians, 2015. 65(1): p. 5-29.
CrossRef - Stephan, C., B. Ralla, and K. Jung, Prostate-specific antigen and other serum and urine markers in prostate cancer. Biochimica et Biophysica Acta (BBA) – Reviews on Cancer, 2014. 1846(1): p. 99-112.
CrossRef - Qu, B., et al., A novel electrochemical immunosensor based on colabeled silica nanoparticles for determination of total prostate specific antigen in human serum. Talanta, 2008. 76(4): p. 785-790.
CrossRef - Huang, L., et al., Prostate-specific antigen immunosensing based on mixed self-assembled monolayers, camel antibodies and colloidal gold enhanced sandwich assays. Biosensors and Bioelectronics, 2005. 21(3): p. 483-490.
CrossRef - Arya, S.K. and S. Bhansali, Anti-Prostate Specific Antigen (Anti-PSA) Modified Interdigitated Microelectrode-Based Impedimetric Biosensor for PSA Detection. Biosensors Journal, 2012. 1: p. 1-7.
CrossRef - Brown, J.Q., et al., Ultra-sensitive detection of biomarker using localized surface plasmon resonance (LSPR) enhanced by ELISA. 2015. 9537: p. 95371F.
- Tothill, I.E., Biosensors for cancer markers diagnosis. Seminars in Cell & Developmental Biology, 2009. 20(1): p. 55-62.
CrossRef - Atta, N.F., A. Galal, and S.M. Ali, Nanobiosensor for Health Care. 2011.
- Xi, M., et al., A reusable localized surface plasmon resonance biosensor for quantitative detection of serum squamous cell carcinoma antigen in cervical cancer patients based on silver nanoparticles array. International Journal of Nanomedicine, 2014: p. 1097.
CrossRef - Hwang, W.S. and S.J. Sim, A Strategy for the Ultrasensitive Detection of Cancer Biomarkers Based on the LSPR Response of a Single AuNP. Journal of Nanoscience and Nanotechnology, 2011. 11(7): p. 5651-5656.
CrossRef - Bingham, J.M., W.P. Hall, and R.P. Van Duyne, Exploring the unique characteristics of LSPR biosensing, in Nanoplasmonic Sensors. 2012, Springer. p. 29-58.
CrossRef - Petryayeva, E. and U.J. Krull, Localized surface plasmon resonance: nanostructures, bioassays and biosensing—a review. Analytica Chimica Acta, 2011. 706(1): p. 8-24.
CrossRef - Monk, D.J. and D.R. Walt, Optical fiber-based biosensors. Analytical and bioanalytical chemistry, 2004. 379(7-8): p. 931-945.
CrossRef - Kreuzer, M.P., et al., Colloidal-based localized surface plasmon resonance (LSPR) biosensor for the quantitative determination of stanozolol. Analytical and bioanalytical chemistry, 2008. 391(5): p. 1813-1820.
CrossRef - Yuan, J., et al., Detection of serum human epididymis secretory protein 4 in patients with ovarian cancer using a label-free biosensor based on localized surface plasmon resonance. Int J Nanomedicine, 2012. 7: p. 2921-2928.
CrossRef - Pacioni, N.L., et al., Surface plasmons control the dynamics of excited triplet states in the presence of gold nanoparticles. Journal of the American Chemical Society, 2010. 132(18): p. 6298-6299.
CrossRef - Raj, V., et al., Detection of cholesterol by digitonin conjugated gold nanoparticles. Biosensors and Bioelectronics, 2011. 27(1): p. 197-200.
CrossRef - Weng, G., et al., Decreased resonance light scattering of citrate-stabilized gold nanoparticles by chemisorption of mercaptoacetic acid. Colloids and Surfaces A: Physicochemical and Engineering Aspects, 2010. 369(1): p. 253-259.
CrossRef - Daniel, M.-C. and D. Astruc, Gold nanoparticles: assembly, supramolecular chemistry, quantum-size-related properties, and applications toward biology, catalysis, and nanotechnology. Chemical reviews, 2004. 104(1): p. 293-346.
CrossRef - Nath, N. and A. Chilkoti, A colorimetric gold nanoparticle sensor to interrogate biomolecular interactions in real time on a surface. Analytical chemistry, 2002. 74(3): p. 504-509.
CrossRef - Weng, G., J. Li, and J. Zhao, Enhanced Resonance Light Scattering of Antibody Covalently Conjugated Gold Nanoparticles Due to Antigen-Antibody Interaction Induced Aggregation. Nanoscience and Nanotechnology Letters, 2013. 5(8): p. 872-878.
CrossRef - Aslan, K., C.C. Luhrs, and V.H. Pérez-Luna, Controlled and reversible aggregation of biotinylated gold nanoparticles with streptavidin. The Journal of Physical Chemistry B, 2004. 108(40): p. 15631-15639.
CrossRef - Li, D., et al., Immobilization of glucose oxidase onto gold nanoparticles with enhanced thermostability. Biochemical and biophysical research communications, 2007. 355(2): p. 488-493.
CrossRef - Lou, S., et al., A gold nanoparticle-based immunochromatographic assay: The influence of nanoparticulate size. The Analyst, 2012. 137(5): p. 1174-1181.
CrossRef - Majzik, A., et al., Growing and stability of gold nanoparticles and their functionalization by cysteine. Gold bulletin, 2009. 42(2): p. 113-123.
CrossRef - Baniasadi, Ladan, et al., An inhibitory enzyme electrode for hydrogen sulfide detection. Enzyme and microbial technology, 2014, 63: p. 7-12.
CrossRef - Omidi, M., et al., A Label-Free Detection of Biomolecules Using Micromechanical Biosensors. Chinese Physics Letters, 2013, 30(6): p. 068701.
CrossRef - Omidi, M., et al., Protein-based nanobiosensor for direct detection of hydrogen sulfide. EPL (Europhysics Letters), 2015,109(1): p. 18005.
- CrossRef
- Omidi, M., S. Alaie, and Amir Rousta, Analysis of the vibrational behavior of the composite cylinders reinforced with non-uniform distributed carbon nanotubes using micro-mechanical approach. Meccanica, 2012, 47(4): p 817-833.
CrossRef - Omidi, Meisam, et al. Protein Based Localized Surface Plasmon Resonance Gas Sensing. Chinese Physics Letters, 2015, 32(1): p 018701.
CrossRef - Rahimpour, A., Design and Manufacturing of Electromechanical Chip for Rapid Measurement of IgG1 Antibody in Cell-Culture Supernatant. Biology and Medicine, 2016, 8(7): p 340.
CrossRef
Accepted on: 01 November 2016


![]()
![]()
