

Manuscript accepted on : 21 July 2016
Published online on: --
Plagiarism Check: Yes
The Influence of Lecithin Administration on Hepatic Expression FMO3 and FMO5 Genes in N-Mary Mice
Abbas Mohammadi1,2, Mohammad Reza Baneshi3, Zakaria Vahabzadeh4 and Tahereh Khalili1,*
1Department of Clinical Biochemistry,Afzalipour School of Medicine, Kerman University of Medical Sciences, Kerman, Iran.
2Physiology Research Center, Kerman University of Medical Sciences, Kerman, Iran.
3Modeling in Health Research Center, Institute for Futures Studies in Health, Department of Biostatistics and Epidemiology, School of Public Health, Kerman University of Medical Sciences, Kerman, Iran.
4Clinical biochemistry department, Faculty of Medicine, Kurdistan University of Medical Sciences, Sanandaj, Iran.
Corresponding Author E-mail: taherehkh2131@yahoo.com
DOI : http://dx.doi.org/10.13005/bbra/2332

ABSTRACT: To investigate the effect of lecithin on FMO3 and FMO5 gene expression, L-α-lecithin or ethanol 30% (as control) was administrated to female N-mary mice as intraperitoneal injection and animals were sacrificed 48h after treatment. The relative expression of mRNA and protein were assessed by real-time PCR and western blotting analysis. In this study, FMO5 expression was also evaluated in HepG2 cell line. FMO3 mRNA expression in mice liver was increased to 1.8-fold in animal received lecithin compared to control group, While FMO5 expression did not showed any changes as in vivo and in vitro experiments. The our results are suggested to induce of FMO3 expression by lecithin.
KEYWORDS: Lecithin; flavin-containing monooxyganase; gene expression
Download this article as:| Copy the following to cite this article: Mohammadi A, Baneshi M. R, Vahabzadeh Z, Khalili T. The Influence of Lecithin Administration on Hepatic Expression FMO3 and FMO5 Genes in N-Mary Mice. Biosci Biotech Res Asia 2016;13(3). |
| Copy the following to cite this URL: Mohammadi A, Baneshi M. R, Vahabzadeh Z, Khalili T. The Influence of Lecithin Administration on Hepatic Expression FMO3 and FMO5 Genes in N-Mary Mice. Biosci Biotech Res Asia 2016;13(3). Available from: https://www.biotech-asia.org/?p=15524 |
Introduction
The phospholipids are a class of lipids in body tissues and in plasma that require for the solubilization of cholesterol and emulsification of lipids and absorption [1, 2].Lecithin is the major phospholipid (>50%) in most mammalian membranes that is localized in the outer surface of the plasma membrane[3]. Some studies in animals have been investigated the effects of lecithin on lipid homeostasis. In rats, lecithin riched diets modulate plasma total cholesterol and HDL-cholesterol, also it can stimulate bile formation and secretion of biliary bile acids, phospholipid and cholesterol[4, 5]. In another study by OʼBrien and Corrigan, in the hypercholestrolemic guinea pigs was showed that the feeding of supplemented diet with soybean or egg lecithin can decreases total plasma cholesterol without decreasing HDL-cholesterol and results in the 177% increase in HDL-cholesterol without increasing in total cholesterol[6]. Although a number of studies in animals demonstrate the beneficial effects of lecithin on plasma and liver lipids, but there is limited to confirme lecithin effects on lipid homeostasis in human[7, 8]. In fact, Recently studies indicate that intestinal microbes-dependent metabolism of phosphatidilcholine (lecithin) can be involved in pathogenesis of cardiovascular disease[9, 10]. Intestinal microbes can convert the choline moiety of lecithin to trimethylamin (TMA) and TMA is subsequently converted to trimethylamine-N oxide (TMAO) by members of flavin-containing monooxyganase (FMO) family in liver[9]. TMAO is known as a metabolite that strongly associated with athrosclerosis[10]. Flavin-containing monooxygenases (FMOs) in mammals are detoxification enzymes that oxygenate drugs and xenobiotics containing nitrogen, sulfur and phosphorus[11, 12].In the most mammals, there are five isoforms of FMOs, FMO1-5. FMO3 is the most important isoform that in human and female mouse livers is highly expressed[13, 14]. FMO5 is also expressed in the liver of human and micethat its mRNA levels is higher than other FMOs[15-17]. FMOs expression can be affected byvarious factors such as diet, disease and hormonal status [18]. For example, indols that are compounds in the vegatables can inhibite FMO3 activity[19]. In mice, enriched diet with cholic acid induces hepatic FMO3 expression [20]. More recent studies indicate that changes in FMO3 and FMO5 expression could have physiological outcomes. For example, it has been found that in liver mice, FMO3 contributes to regulation of cholesterol balance and inflammatory responses[21]. In mice that FMO5 gene has been inactivated (FMO5 knockout gene), from 30 weeks of age, there is not metabolic changes dependent age such as increasing body weight or increase in the plasma cholesterol and glucose, indicating that FMO5 is involved in metabolic changes associated with age[22]. Forasmuch as, transcriptional changes of FMO3 and FMO5 genes affected on lipid metabolism and as aforementioned, lecithin is also known to influence on lipid homeostasis, therefor the objective of the present study was to investigate FMO3 and FMO5 gene expression at mRNA and protein levels in mice, after administration of lecithin.
Method and material
Chemical and Reagents
Dulbeccoʼs Modified Eagleʼs medium (DMED), Trypsin-EDTA, Penicillin/Streptomycin, 3-(4,5-dimethylthiozol-2-yl)-2,5-diphenyltetrazolium bromide (MTT) and L-α-phosphatydylcholine-from egg (P3556)(Lecithin) were obtained from Sigma-Aldrich (Germany). For cell culture experiments, 100mg from lecithinwas dissolved into 1ml of ethanol (100%) and added to the medium at interested concentrations, and for animal experiment this solution was diluted as 1:3 with distilled water. Fetal bovine serum (FBS) was purchased from Gibco Life Technologies (India). Anti-FMO3, anti-FMO5 antibodies and Goat anti-rabbit secondary antibody was prepared from the Abcam Biotech Company (Cambridge, UK). ). Anti-GAPDH and goat anti-mouse secondary antibody were from Novus Biological, LLC (Littleton, USA) and R&D Systems Europe, Ltd. (Abingdon, UK) respectively. All other chemicals were of molecular grade.
Animals and treatments
Female N-mary mice (8 to 9 weeks old) were kept at 12h light/dark cycle and chow diet as ad libitum. The animals were devided into two groups. One group of mice received 100 µl of L-α-lecithin in 30% ethanol (35 mg/ml), equal to 150 mg/kg, as intraperitoneal (ip) injection and the other group received ethanol 30% as ip injection. In rodents that has ever been studies, the maximal nontoxic intraperitoneal dose of lecithin was determined between 1 to 10 g/kg body weight[23]. After 48 hours, animals wre sacrificed by high concentration of CO2. The livers rapidly were removed, snap frozen in liquid nitrogen and stored at -80 °C until used.
Cell culture
The HepG2 cell line was cultured inDulbeccoʼs Modification of Eagleʼs Medium (DMEM) supplemented with 10% fetal bovine serum (FBS),150 U/ml penicillin/150μg/ml streptomycin and was maintained at 5% CO2 and temperature of 37°C. For cell treatment. HepG2 cells were grown to 90% confluency and then the medium was exchanged to medium containing lecithin with final concentration of 0.23 mg/ml or 0.46 mg/ml and incubated for 6, 12 and 24 hours. At the end of incubation, cells were washed twice with phosphate buffered saline (PBS) and protein lysis buffer or tripure reagent (Roche applied science, Switzerland) was added for protein or RNA extraction, respectively. Afterward, cells were detached from dishes and transferred to a microtube to store at -80°C.
RNA isolation and cDNA synthesis
Total RNA from 2-3×10⁶ cells (60 mm dish) and 20 -30 mg liver tissues were isolated with Tripureisolation reagent (Roche applied science,Germany) according to manufacturer’s instructions. The concentration of extracted RNA was quantifiedspectrophotometrically at 260nm. The purity and quality of RNA were evaluated with determination of 260/280 absorbance ratio using a ND-1000 nanodrop (Thermo Scientific, USA) instrument. Integrity of RNAwas also assessed by electrophoresis on 1% agarose gel. For cDNA synthesis, 1µg of total RNA was applied in a final volume of 20 µl of reverse transcription reaction by Revert Aid first strand cDNA synthesis kit (Thermo Scientific, USA) according to the manufacturer’s instruction. The cDNA was stored in -20°C until use.
Real-time PCR
The PCR test was performed using iQ-SYBR Green supermixkit (BioRad)in StepOne Real-time PCR System (Applied Biosystems). Reaction mix of PCR was prepared in 20 µl volumes consisted of: SYBR Super mix 1X (20 mMTris-HCl, pH 8.4, 0.2 mM each deoxynucleoside-5_-triphosphate, 3 mM MgCl2, 50 mMKCl, 25 U/ml iTaq DNA polymerase, SYBR Green I, 10 nM fluorescein, and stabilizers),Rox dye (500nM), 2-3 µl cDNA, H2O and specific primers (300-500nM). Table 1 presents primer sequences, accession numbers, annealing temperature (Tm) and PCR product size (bp). Thermal program was as follows: starting denaturation at 95°C for 10 min that was followed by 45 cycles at 95°C denaturationfor 10s, annealing temperature for each primer pair (table1) for 30s and extension temperature at 72°C for 30s, at the end was used one step collecting melting curve data at 55-95°C with ramping rate of 0.2°C/s.Hypoxanthin-guanine phosphoribosyltransferas (HPRT) was used as reference gene and data were normalized as the difference between Ct for interested gene and Ct of HPRT gene. Relative expression mRNA was calculated using the delta-delta CT (2-ΔΔCt) method from the differences between treated and control samples.
Table1: Primers used for real-time PCR experiment .
| gene | Forward/ReversPrimer sequence | product size (bp) | Accession numbers | Tma | References |
| hFMO51
|
5´-ACATTGCCCTCACAGAGTGAA-3´
5´-CCACCAAATCAGCAAGCTCT-3´ |
139 | XM_006711245 | 55 | [17] |
| hHPRT2 | 5´-GACCAGTCAACAGGGGACAT-3´
5´-GTCCTTTTCACCAGCAAGCT-3´ |
182 | XM_011531328 | 56 | [17] |
| mFMO33 | 5´-CACCACTGAAAAGCACGGTA-3´
5´-CTTATAGTCCCTGCTGTGGAAGC-3´ |
151 | NM_008030.1 | 57 | [29] |
| mFMO54 | 5´-ATCACACGGATGCTCACCTG-3´
5´-GCTTGCCTACACGGTTCAAG-3´ |
234 | NM_001161763.1 | 58 | [29] |
| mHPRT5 | 5´-AGCTACTGTAATGATCAGTCAAC-3´
5´-AGAGGTCCTTTTCACCAGCA-3´ |
198 | NM_013556.2 | 57 | [29] |
1 humanfalvin-containing monooxygenase5, 2 human hypoxanthine phosphoribosyltransferase (hHPRT), 3 mouse falvin-containing monooxygenases3,4mouse falvin-containing monooxygenases5, 5mouse hypoxanthinephosphoribosyltransferase (mHPRT). aAnnealing temperature for each primer pair and length of PCR product.
Western blotting
Western blot experiment was performed for investigation of gene expression at protein level. For protein extraction from HepG2, first the cells were washed with ice-cold PBS buffer, and then 500µl from RIPA (RadioImmunoPrecipitation Assay) buffer (tris-HCl; 50mM PH=7.5, NaCl; 150mM, SDS; 0.01 %, Na-deoxycholate; 0.5%, NP-40; 1% and EDTA; 1mM) consisted of protease inhibitor cocktail (1X) (Santa Cruz, USA) and phenylmethylsulfonyl fluoride, PMSF, (Sigma Aldrich) 1mM, was added to each 60mm dish. Liver tissue homogenates were made with 30-40 mg of tissue in 750-1000µl of RIPA buffer. After homogenizingwith an ultrasonic homogenizer (Hielscher, Germany), the samples were centrifuged at 12000g for 15min at 4°C. Protein concentrations were determined by the method of BCA (Bicinchoninic Acid) with BCA kit from Santa Cruz Biotechnology(Dallas, Texas, USA). The Proteins were separated on 10% SDS-acrylamide gel and transferred onto a PVDF(Polyvinylidene Fluoride) membrane(0.2 μm, BIO-RAD, USA). The membrane was blocked for 1 hr in %5 skim milk in TBST (20 mmol/L Tris, 137 mmol/L NaCl pH 7.6,with %0.5 tween-20) and was incubated for 1-1.5h with primary antibodies, including: anti-FMO3 (Abcam-ab126790) at 1/3000 dilution in TBST, anti-FMO5 (Abcam-ab103973) at 1/5000 dilution in TBST or anti-GAPDH (Nouos Biological-NB300-328) at 1/10000 diluted in TBST. After washing The membranes with TBST for 3 times (20 min each), membranes were incubated with the second antibodiesat room temperature for 1.5 to 2 hours. The secondary antibodies were goat anti-rabbit IgG conjugated to horseradish peroxidase (HRP) (Abcam-ab97051) diluted 1/20000 for anti-FMO3 and 5 and goat anti-mouse IgGconjugated-HRP (R&D system-HAF007) diluted 1/5000 for anti-GAPDH. Following a washing sequence in TBST, enhanced chemiluminescence (ECL) substrate (Perkin Elmer) was added on membrane and followed by exposure to X-Ray film. The protein bands were densitometered and were analyzed by an Image J software v1.48.
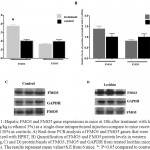 |
Figure 1: Hepatic FMO3 and FMO5 gene expressions in mice at 48h after treatment with lecithin (150mg/kg in ethanol 3%) as a single dose intraperitoneal injection compare to mice receiving ethanol 30% as controls. A) Real-time PCR analysis of FMO3 and FMO5 genes that were normalized with HPRT, B) Quantification of FMO3 and FMO5 protein levels in western blotting, C) and D) protein bands of FMO3, FMO5 and GAPDH from treated lecithin mice and controls.The results represent mean value±S.E from 6 mice. *: P<0.05 compared to control.
|
Statistical analysis
Statistical analysis was carried out using SPSS 22 software. The differences between treated group and control were assessed by Student’s t–test. Resultswere presented as mean ± standard error of mean (SEM) of 6 mice per group and P-values <0.05 were considered statistically significant.
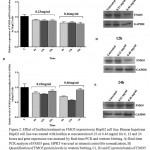 |
Figure 2: Effect of lecithin treatment on FMO5 expression in HepG2 cell line. Human hepatoma HepG2 cell line was treated with lecithin at concentration 0.23 or 0.46 mg/ml for 6, 12 and 24 hours and gene expression was assessed by Real-time PCR and western blotting. A) Real-time PCR analysis of FMO5 gene, HPRT was used as internal control for normalization, B) Quantification of FMO5 protein levels in western blotting, C), D) and E) protein bands of FMO5 and GAPDH after 6, 12 and 24 hours treatment with lecithin at 0.23 and 0.46 mg/ml. The results represent mean value±Standard Error (S.E) from at least four separate experiments.
|
Results and discussion
In the present study, we investigated FMO3 an FMO5 gene expression after intraperitoneal (ip) injection of lecithin to female NMRI mice. The peritoneal cavity provides a convenient storage for slow release of lipids into the blood stream[24]. In general, Lecithin is an edible and digestible compound of natural origin that is used in food industry, it constitutes predominant phospholipid (>50%) in most mammalian membranes[3, 23]. The metabolism of dietary lecithin in the intestine produces a variety of products including choline that it was metabolized by gut flora to producetrimethylamine (TMA), and TMA in turn was metabolized to trimethylamine-N oxide (TMAO) by hepatic FMO isoform, FMO3[9, 10]. Intraperitoneal injection allowed introducing lecithin into circulation without producing its metabolites TMA and TMAO. The change of FMO3 mRNA levels in mice livers, after treatment with lecithin, was shown in Fig 1. As it can be seen, the FMO3 mRNA levels increased to 1.8-fold compared to controls, which is statistically significant. However, no difference was observed between lecithin treated mice and controls (untreated) at the protein levels (fig 1). FMO3 protein levels increased at 1.3-fold after treatment with lecithin but no significant. Previous reports had indicated to induce of FMO3 gene expression by some factors. In a study on five strains of both male and female mice, researchers found that FMO3 gene expression was induced after feeding of mice with cholic acid enriched diet[20]. recent studies was shown that overexpression of FMO3 has profound effects on lipid and glucose metabolism and hepatic inflammatory responses[21, 25], so that increasing of FMO3 expression increases hepatic lipids and plasma lipids and glucose that suggests the role of regulating lipogenesis for FMO3[25]. The influence of lecithin on genes involved in lipid metabolism has been reported previously. A study on broiler chicken showed that chicken feeding with soy-lecithin increases the expression of genes regulating lipogenesis including acetyl-CoA carboxylase (ACC), malic enzyme (ME), fatty acid synthase (FAS) and also transcription factor sterol regulatory element binding protein-1 (SREBP-1)[1]. The investigation of FMO5 gene expression in response to lecithin treatment of mice, was not shown any changes at both mRNA and protein levels. Although, some reports have shown that FMO5 can be affected by some substrates but the knowledge in this field is very low. In humans and mice livers, FMO5 mRNA levels is higher than any other FMO indicating that it may had the physiological role(s) in the liver[15]. In fact, more recent studies have been shown FMO5 involved in physiological conditions. The study of Gonzales malagonet al [22], demonstrated that in mice with dsturped FMO5 gene (FMO5-/-) changes of glucose and lipids plasma levels after 30 weeks of age is similar to those levels in 10 weeks of age, while in wild-type mice, aging is associated with increase glucose and lipid levels in plasma, increase of weight and obesity. In present study, the changes of FMO5 gene expression were also investigated in HepG2 cell line. Because of unlimited availability and easy to culture, hepatoma cell line like HepG2 have been used extensively in studied. Despite the fact that the gene expression of FMO family is limited in HepG2 cells, FMO5 mRNA level were reported approximately equal to those levels in primary human hepatocyte[26]. Figure 2 depicts The changes in FMO5 mRNA and protein expression at concentration of 0.23mg/ml and 0.46mg/ml of lecithin after 6,12 and 24 hours treatment. No significant changes were seen in FMO5 mRNA and protein levels in treated cells compared to untreated controls. The utility of lecithin in cell culture medium of 3T3-L1 cell line has shown the overexpression of proliferator-activated receptor γ (PPARγ) and it also promotes lipid accumulation in human hepatoma HepG2[27]. This means that in cell culture medium, lecithin has potential of influence on gene expression. In vitro studies have shown the changes of FMO5 gene expression in HepG2 cell line such as the influence of hyperforin that induces FMO5 gene expression end testosterone that suppresses its expression[28]. It is necessary to do more studies to determine how and which way, lecithin can change FMO3 expression and also, it should be investigated subsequent physiological outcome(s) of FMO3 overexpression that is created after receiving the lecithin.
References
- J. Huang, D. Yang, S. Gao and T. Wang, Livestock Science, 118, 53 (2008).
CrossRef - T. C. Jenkins, T. Gimenez and D. L. Cross, J Anim Sci,67, 529 (1989).
CrossRef - S. H. Zeisel, FASEB journal : official publication of the Federation of American Societies for Experimental Biology, 7, 551 (1993).
CrossRef - E. Polichetti, N. Diaconescu, P. L. De La Porte, L. Malli, H. Portugal, A. M. Pauli, H. Lafont, B. Tuchweber, I. Yousef and F. Chanussot, The British journal of nutrition, 75, 471 (1996).
CrossRef - F. Rioux, A. Perea, I. M. Yousef, E. Levy, L. Malli, M. C. Carrillo and B. Tuchweber, Biochimica et biophysica acta, 1214, 193 (1994).
CrossRef - B. C. O’Brien and S. M. Corrigan, Lipids, 23, 647 (1988).
CrossRef - J. S. Cohn, E. Wat, A. Kamili and S. Tandy, Current opinion in lipidology, 19, 257 (2008).
CrossRef - J. T. Knuiman, A. C. Beynen and M. B. Katan, The American journal of clinical nutrition, 49, 266 (1989).
CrossRef - W. W. Tang, Z. Wang, B. S. Levison, R. A. Koeth, E. B. Britt, X. Fu, Y. Wu and S. L. Hazen, New England Journal of Medicine, 368, 1575 (2013).
CrossRef - Z. Wang, E. Klipfell, B. J. Bennett, R. Koeth, B. S. Levison, B. DuGar and F. A. E, nature, 472, 57 (2011).
CrossRef - S. K. Krueger and D. E. Williams, Pharmacol Ther, 106, 357 (2005).
CrossRef - B. A. Palfey and C. A. McDonald, Archives of biochemistry and biophysics, , 493, 26(2010).
CrossRef - C. T. Dolphin, J. H. Riley, R. L. Smith, E. A. Shephard and I. R. Phillips, GENOMICS, 46, 260 (1997).
CrossRef - J. G. Falls, B. L. Blake, Y. Cao, P. E.Levi and E. Hodgson, JBIOCHEM TOXICOLOGY,10, 171 (1995).
CrossRef - A. Janmohameda, D. Hernandeza, I. R. Phillips and E. A. Shepharda, Biochemical Pharmacology, 68, 73 (2004).
CrossRef - L. H. Overby, A. R. Buckpitt, M. P. Lawton, E. Atta-Asafo-Adjei, J. Schulze and R. M. Philpot, Arch Biochem Biophys., 317, 275 (1995).
CrossRef - J. Zhang and J. R. Cashman, Drug metabolism and disposition: the biological fate of chemicals, 34, 19 (2006).
CrossRef - J. G. Falls, D.-Y. Ryu, Y. Cao, P. E. Levi and E. Hodgson, ARCH BIOCHEM BIOPHYS, 342, 212 (1997).
CrossRef - J. R. Cashman, Y. Xiong, J. Lin, H. Verhagen, G. van Poppel, P. J. van Bladeren, S. Larsen-Su and D. E. Williams, Biochem Pharmacol, 58, 1047 (1999).
CrossRef - B. J. Bennett, T. Q. de Aguiar Vallim, Z. Wang, D. M. Shih, Y. Meng, J. Gregory, H. Allayee, R. Lee, M. Graham, R. Crooke, P. A. Edwards, S. L. Hazen and A. J. Lusis, Cell metabolism, 17, 49 (2013).
CrossRef - M. Warrier, D. M. Shih, A. C. Burrows, D. Ferguson, A. D. Gromovsky and A. L. Brown, Cell Reports, 10, 326 (2015).
CrossRef - S. G. Gonzalez Malagon, A. N. Melidoni, D. Hernandez, B. A. Omar, L. Houseman, S. Veeravalli, F. Scott, D. Varshavi, J. Everett, Y. Tsuchiya, J. F. Timms, I. R. Phillips and E. A. Shephard, Biochem Pharmacol, 96, 267 (2015).
CrossRef - Z. Fiume, International journal of toxicology, 20 Suppl 1, 21 (2001).
- I. Hanin and G. B. Ansell, Lecithin: Technological, Biological, and Therapeutic Aspects, Kluwer Academic Pub, (1987).
CrossRef - D. M. Shih, Z. Wang, R. Lee, Y. Meng, N. Che, S. Charugundla, H. Qi, J. Wu, C. Pan, J. M. Brown, T. Vallim, B. J. Bennett, M. Graham, S. L. Hazen and A. J. Lusis, Journal of lipid research, 56, 22 (2015).
CrossRef - L. Guo, S. Dial, L. Shi, W. Branham, J. Liu, J. L. Fang, B. Green, H. Deng, J. Kaput and B. Ning, Drug metabolism and disposition: the biological fate of chemicals, 39, 528 (2011).
CrossRef - Y. Zhang, C. Huang, X. Sheng, Z. Gong and Y. Q. Zang, International journal of molecular medicine, 23, 449 (2009).
CrossRef - L. Houseman, University of London, (2008).
- L. K. Siddens, M. C. Henderson, J. E. Vandyke, D. E. Williams and S. K. Krueger, Biochem Pharmacol, 75, 570 (2008).
CrossRef

This work is licensed under a Creative Commons Attribution 4.0 International License.


