

Manuscript accepted on : 13 July 2016
Published online on: --
Plagiarism Check: Yes
Targeting Sub-Watersheds with Conservation Practices Using SWAT model and GISTechniques in Libya
Ahmed Al-wadaey1*, Feras Ziadat2, Theib Oweis1, Mhieldin Elkhboli3 and Ahmed Alboueichi3
1Soil, Water and Environment Department, Faculty of Agriculture, Sana’a University Sana’a Yemen.
2Land and Water Division, Sana’a University Sana’a Yemen.
3College of agriculture, Omar Al-Mukhtar University, Libya Agriculture Research Center, Libya.
Corresponding Author E-mail: aalwadaey@gmail.com
DOI : http://dx.doi.org/10.13005/bbra/2276

ABSTRACT: Rainfall in the arid and semi arid areas is limited with high spatial and temporal variability resulting in low water productivity. Rainwater harvesting (RWH) and supplemental irrigation (SI) can improve water productivity, control erosion and contribute to adaptation to climate change and variability. The possibility of implementing RWH and SI depends on climate, hydrology, vegetation, agriculture practices, and soils. One common reason for low adoption of improved land and water management practices is the lack of systematic knowledge on potential areas and suitable locations for these interventions. This study aimed to identify areas within watersheds that are most suitable for RWH and SI, to maximize the benefits from their implementation. SWAT (Soil Water Assessment Tool) was used to identify suitable areas in four watersheds in eastern and western Libya. The paper presents a methodology that enable water managers to assess the suitability for RWH and SI for such large watershed areas (87-900 km2).GIS layers including digital elevation model (DEM), soil data, and land use were used to characterize the watershed for modeling. Data from eleven weather stations for eleven years (2000-2010) were used for simulation. Model output was used to assess hydrological process by estimating runoff coefficient (rainfall: runoff) in each sub-watershed and hydrologic response unit (HRU). Runoff coefficients at HRUs varied from zero to 0.23, with significant variation among the four watersheds. Areas where RWH and SI can be implemented can be identified based on runoff coefficient at field scale, while other techniques such as large dams can be placed on the stream network where high runoff is generated. These results were integrated with GIS layers of land use, soil and community distribution to identify potential sites for RWH and SI techniques. Results also indicate variable areas as suitable for RWH and SI for different watersheds.The results of the hydrological models were integrated with biophysical and socio-economic information to provide a useful tool to target RWH and SI as part of sustainable planning at watersheds level. This approach appreciate the role of spatial variability within watersheds and the importance of multi-disciplinary integration as viable tools for sustainable resource planning in the dry environment and under climate change scenarios.
KEYWORDS: Implementing RWH; Multi-disciplinary integration
Download this article as:| Copy the following to cite this article: Al-wadaey A, Ziadat F, Oweis T, Elkhboli M, Alboueichi A. Targeting Sub-Watersheds with Conservation Practices Using SWAT model and GISTechniques in Libya. Biotech Res Asia 2016;13(3). |
| Copy the following to cite this URL: Al-wadaey A, Ziadat F, Oweis T, Elkhboli M, Alboueichi A. Targeting Sub-Watersheds with Conservation Practices Using SWAT model and GISTechniques in Libya. Biotech Res Asia 2016;13(3). Available from: https://www.biotech-asia.org/?p=15881 |
Introduction
Libya is one of the arid and semiarid countries that face very severe water scarcity. Although rainfall is an extremely valuable resource in the country, its productivity is often low. At least 80 percent of Libya agricultural production depends on irrigated agriculture; however, yields from rainfed as well as irrigated agriculture are generally low. Irrigation potential has been estimated at 750, 000 ha, but when considering renewable water resources, it is estimated that a maximum of 40, 000 ha could be irrigated in the coastalareas (FAO 2005)
Rainwater harvesting (RWH) and supplement irrigation (SI) systems are important in managing scarce rainfall,these practices are among the most promising and efficient-proven technologiesfor optimizing the use of the limited water available from renewable resources in rainfed areas, and for improved farmer income in drier environment (Oweis and Hachum 2003).Success of RWH and SI systems are mainly depends on identification of suitable potential sites and technologies. However, the selection of appropriate sites for these technologies on a large scale presents great challenge due to lacking the necessary data and complexity of watershed variables.
Water harvesting and supplemental irrigation technologies have shown an enormous impact on the livelihoods of smallholders in the rainfed cropping systems and steppe environments of West Asia and North Africa (WANA.In the drier environments, most of the rainwater is lost by evaporation; therefore the rainwater productivity is extremely low. Rainwater harvesting can improve agriculture by directing and concentrating rainwater through runoff to the plants and other beneficial uses (Oweis and Hachum 2006).Rainwater harvesting also can improve the productivity of rainwater and maintain productive and sustainable agro-pastoral systems in marginal environments (Abu-Awwad and Shatanawi 1997; van Wesemael et al.1998; Prinz, et al. 1998). Additionally, it could control soil erosion and reduce the impact of drought (Samuel and Mathew 2008). The potential of rainwater harvesting to mitigate the spatial and temporal variability of rainfall has brought about its revival during the last two decades (MwengeKahinda et al. 2008).
The selection of appropriate sites and the determination of suitable methods for rainwater- harvesting are very important for ensuring sustainable implementation of RWH and SI systems. Often one can achieve high runoff efficiency (defined as the ratio of runoff volume collected at the target area to the volume of rainwater falling on the catchment area), but water may be lost in deep percolation in the target area, due to improper selection of the catchment size relative to target area under the given soil and climatic conditions (Oweis and Hachum 2006).
Oweis et al. (1998) also indicated that improper selection of suitable sites and matching the practice with its technical and socio-economical requirements can results in failure rainwater harvesting projects and adoption of RWH techniques. A major knowledge gap exists concerning the identification of those parts of the drylands in which the chances for impact and adoption of rainwater-harvesting techniques are high and to which further studies could be targeted (De Pauw et al. 2006). Specifically, for planning and implementation purposes, it is critical to be able to identify suitable areas for rainwater harvesting (MwengeKahinda et al. 2008). Therefore, there is a need for approach to identify areas that are suitable for RWH and SI technique, which can be used to assess the potential for implementation these techniques (Patrick 1997).
Suitable areas for RWH and SI that aim at improving productivity depend on hydrological characteristics of the watershed and farming practices. Therefore, appropriate data must be available on the climate, soil, crops, topography, and socioeconomics of the targeted area. These data can be collected through a combination of field visits, site inspections, topographic and thematic maps, aerial photos, satellite images, and geographic information systems (GIS).
Geographical Information Systems (GIS) help to facilitate this task for large areas and permit rapid and cost effective sites survey. For relatively small areas, a field survey can be conducted by experienced people. However, for larger areas, the application of modeling integrated with Remote Sensing (RS) and Geographic Information System (GIS) could be the most relevant means (Prinz et al. 1998; Holme and Tagg 1996; De Pauw et al. 2007). In fact, planning for large scale implementation requires quantitative information and spatial distribution of land characteristics, which are often unavailable for arid environments (Prinz et al. 1998). Because of the large extent of these environments and the relatively low population density, it is very expensive to inventory them using traditional survey methods (Patrick 2002). Therefore, the use of available data should be optimized to serve these purposes and to provide solid basis for site selection.
The Soil and Water Assessment Tool (SWAT) is one of the most widely used watershed-scale water quality models in the world. Nearly 600 peer-reviewed SWAT-related journal articles have been published and hundreds more have been published in conference proceedings and other formats. The SWAT model has proven to be a very flexible tool for investigating a range of hydrologic and water quality problems at different watershed scales, as well as very adaptable for applications requiring improved hydrologic and other enhanced simulation needs. The use of SWAT has expanded dramatically, not only in North America and Europe but also in Africa, Southeast Asia and countries such as China, India, and Iran. Several important trends have also emerged regarding improved hydrologic, best management practice, and pollutant transport methods. This paper presents a methodology that enables water managers to assess the suitability of rainwater harvesting and supplement irrigation for different watersheds of Libya. The objective is to develop a methodology for identifying the suitable areas where RWH and SI can maximize beneficial use of water.
Materials and Methods
The study was conducted in Libya 25 00 N, 17 00 E, with total area of 1, 76millionkm². The average annual precipitation is less than 400 mm. Rainfall occurs during the winter months, but great variability is observed from place to place and from year to year. Four watersheds named with the following codes 37 (Samalous), 83 (Ghadama), 416 (Ganeimah) and 416 (Turghut)were selected in the eastern and western parts of Libya. The watersheds were varied with area from 87 to 986 km2(Fig. 1). Those watershed benchmarks were selected in Al-JablalAl-Gharbi and Al-JabalAl-Akhdar with characterization and baseline information (please refer to the report we prepared for Libya).The selection of these watersheds included the to the matching ofselection criteria assigned bu multi-disciplinary team of researchers with existing biophysical and socioeconomic conditions of the watersheds, this included analyzing criteria of rainfall, cropping systems, communities (rural settlements), accessibility and visibility, topography and soil. The watersheds therefore identified as suitable for targeting rainwater harvesting and supplement irrigation techniques (Ziadat et al. 2010)
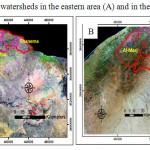 |
Figure 1: Selected watersheds in the eastern area (A) and in the western area (B).
|
ArcSWAT 9.3 (Soil and Water Assessment Tool) interfaced with GIS was used to characterize thehydrology of the selected watersheds. The model is used to evaluate the impact of land characteristics on the hydrological outputs. SWATis a physically based, river-basin scale, deterministic, continuous simulation model that operates on a daily time step(Arnold et al. 1998; Di Luzio et al. 2002; and Di Luzio et al. 2004). SWAT can predict the impact of land-management practices on water, sediment, nutrient and pesticide yields from large watersheds. The SWAT interface delineates watershed sub-basins based on topography and specified threshold drainage area. Soils and land use maps are overlaid to result in hydrologic response units with unique soil/land use combinations.Watersheds were delineated based on DEM (digital elevation model), sub basins distribution, and stream outlets. Modelsimulation was done for 11 years from 2000 to 2010 to identify the most active hydrological areas for runoff. Watershed delineation process consists of five sections namely: DEM setup, stream delineation, outlet and inlet definition, watershed outlet(s) selection and definition. The output of the model shows the amount of rainfall and surface runoff (Q) from which the runoff coefficient and runoff volume for each sub-watershed are estimated. The model calculates runoff using curve number method. The geographic coordinates of eleven weather stations in and around the targeted watersheds were derived from various sources and were used to create map that shows the distribution of these stations (Fig.2). A map of rainfall isohyets based on long-term average rainfall (more than 30 years) was received from the department of meteorology (Fig.3). The available land use map was used to derive land use / land cover layers. The scale of this map was 1:50,000 and was derived using the legend of the FAO land cover classification system (LCCS). Land use data was interoperated from field work, satellite images (scale 1:50,000), and collection of ground truthing observations using GPS (accuracy 5-10 m) (Fig. 4).
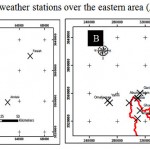 |
Figure 2: Distribution of weather stations over the eastern area (A) andthe western area (B).
|
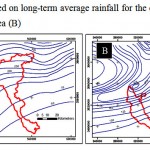 |
Figure 3: Isohyets based on long-term average rainfall for the eastern area (A) and the western area (B).
|
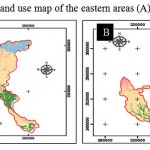 |
Figure 4: Land cover / land use map of the eastern areas (A) and the western area (B).
|
For topography and slope, data were derived from digital topographic layers prepared previously for part of Al-Jamahiriya (mapping the natural resources for agriculture use and planning (Fig. 5). These topographic maps (scale 1:50,000) provided the contour lines (at 20m vertical intervals and in some cases at 10m vertical intervals (Fig.6). These layers were used to derive digital elevation model (DEM) using standard command in ArcGIS. From this DEM, slope grid was derived to cover the four watersheds.The soil data were derived from the Russian study that was conducted in 1984. The scale of the map is 1:50,000 and the soil mapping units recorded many soil characteristics. An example for soil depth is shown for the eastern area and western area (Fig.7)
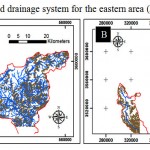 |
Figure 5: Contour lines and drainage system for the eastern area (A) for the western area (B).
|
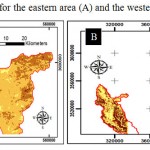 |
Figure 6: Slope grid for the eastern area (A) and the western area (B).
|
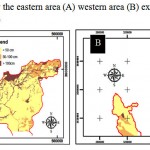 |
Figure 7: Soil depth for the eastern area (A) western area (B) extracted from 1:50,000 soil map.
|
Result and discussion
Runoff coefficients at hydrologic response units (HRUs) varied from zero to 0.23, with significant variation among the four watersheds(Fig.8).In watershed 37, sub basins 12, 13 and 19 have high runoff coefficient (0.12) compared with the other sub basins, runoff volume also can be illustrated for sub catchment (Fig. 9). For watershed 83, sub basin 1 generate high runoff (0.15) compared with downstream sub basins. However, the other two watersheds in eastern part are generating more runoff than western part (see sub basins 9 and 11 in Ghanemah with runoff coefficient of 0.23), which indicated the necessity of implementing RWH and SI on these sub basins. Other sub basins in Turghut watershed have less runoff coefficient (range between 0.12-0.14). Areas where RWH and SI can be implemented were identified based on runoff coefficient at field scale; large dams can be placed on the stream network where high runoff is generated. Hydrologic response varies within a watershed as a function of topography, soil, land cover and climatic conditions. Spatial and temporal data from targeted watersheds may provide information on where, when, how, and why the response varies. General classesof watershed characteristics attributed to the differences in hydrological response to rainfall are watershed size, local climate, vegetation cover, soil properties; geology anthropogenic activities, slope, and drainage characteristics (Black 1997; Uhlenbrook 2003; Sivapalan 2005). Because the suitability of certain location for RWH and SI depends not only on the predicted runoff amounts but also on other biophysical and socio-economic factors, these results were integrated with GIS layers of land use, soil and community distribution to identify potential sites for RWH and SI techniques. The results of suitability analyses indicated that different watersheds are containing variable areas that are suitable for various RWH systems.
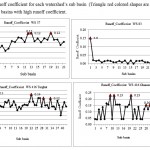 |
Figure 8: Runoff coefficient for each watershed’s sub basin (Triangle red colored shapes are indicated identified sub basins with high runoff coefficient.
|
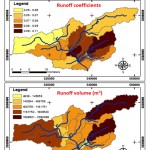 |
Figure 9: GIS layers of watershed 37 to show varied runoff coefficient within sub basins.
|
The runoff coefficient is the proportion of total flow to rainfall.Variations in spatial and temporal efficiencies of watershed-scale rainfall-to-runoff conversion have led to stream flow generation concepts such as variable source- area (Hewlett 1961) and partial-source-area (Dunne and Black 1970). Therefore; difference in runoff coefficient values within four watersheds are results of variation of the amount of runoff that each sub basin can generate see (table 1) for hydrological characteristics of the fourwatersheds.
Table 1: Selected watersheds and their hydrological properties
| Watershed
Site |
Watershed Area (km²) | Number of Sub basins | Average Precipitation (mm) | Average Surface Q (mm) | Average Runoff Coefficient. | Maximum RC |
| 37 (Samalous), | 896.368 | 23 | 285.89 | 24.34 | 0.08 | 0.12 |
| 83 (Ghadama) | 986.069 | 29 | 268.70 | 4.59 | 0.02 | 0.15 |
| 416 (Ganeimah) | 87.25 | 41 | 363.04 | 40.87 | 0.11 | 0.23 |
| 416 (Turghut) | 239.537 | 42 | 373.97 | 35.54 | 0.09 | 0.14 |
These results were discussed with hydrologists from Libya and were compared with some measured runoff amounts at certain locations. The results are generally accepted outputs given the scale of the input data and the purpose for which these results are going to be used for. It is anticipated that these results will be used only to determine potential sites for RWH and SI. However, the study outputs will not be used to design the structures of RWH and SI interventions. In fact, more measurements and detailed information are required for such in suite implementation. In addition, variability of seasonal precipitation over Libya are more strikingly experienced from 1976-2000 than from 1951-1975 indicating a growing magnitude of climate change in more recent times(Fig.10).
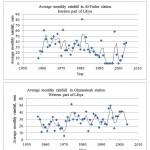 |
Figure 10: Trend of average monthly rainfall from 1950-2010for two stations in eastern and western parts of Libya.
|
To decide a suitable location for SI, the most important criterion is the availability of sufficient water for irrigation mainly by runoff to be harvested and stored in dams for later use. This criterion was explored by overlaying the layer that shows the predicted runoff coefficient and runoff volume for each sub-watershed within the selected watersheds. This provides an idea about the expected amounts of runoff to be harvested at the outlet of these sub-watersheds.Three layers of information were overlaid and examined: runoff amount from each sub-watershed, land use / land cover maps and the distribution of communities for Turghut watershed (Fig. 11) to define the potential sites for supplemental irrigation techniques.The layer which shows the runoff volume was overlaid with the land use / land cover map to identify areas where both criteria are satisfied.
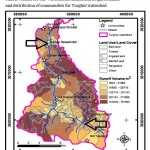 |
Figure 11: Potential sites for supplemental irrigation; an overlay of runoff volume for sub-watersheds, rainfed and irrigated lands, and distribution of communities for Turghut watershed.
|
In figure (11), although many sub-watersheds might generate reasonable amounts of runoff at their outlets, only two of these are potential sites for supplemental irrigation. This is because only those two sites (pointed by arrows) satisfies the above criteria; the outlets of these sub-watersheds indicated reasonable amount of predicted annual runoff, being close to collaborative community and surrounded by irrigated and rainfed lands, where harvested water could be distributed by gravity.
The results of SWAT indicated that in some cases the runoff was too small to ensure sufficient amount of water to be harvested and in other cases, the cumulative amount of runoff for successive sub-watersheds indicated very large amount of water that need a very large structure, which is beyond the scope of this study. However, in each watershed there were a number of possible sites with reasonable runoff volume.The other important criterion is the availability of suitable land to use the harvested water in the vicinity of the proposed dam or water collection structure. The availability of suitable land at elevation below the proposed dam would be an advantage to save the pumping energy.
Conclusion
The analyses indicated that small percentage of a watershed (could be estimated < 30%) is directly participates in storm flow generation. Even in these hydrologically active areas, rainfall-to-runoff conversion rates vary with the types of runoff generation processes: infiltration excess or saturation excess. Large hydrological structures such as dams can be more effective practices at sub-catchment scale specially at stream network where high runoff is generated.Results showed that the methodology provide approach that can be used for identifying potential areas for rainwater harvesting and supplement irrigation technologies. It can be concluded that integration of watershed modeling and GIS techniques with limited field survey are useful for identificationpotential sites for RWH and supplement irrigation. This approach is envisaged to support advanced modeling for such complex and large watershed scale.
References
- Abu-Awwad, A. M. and Shatanawi, M. R. 1997. Water harvesting and infiltration in arid areas affected by surface crust: examples from Jordan. J. Arid Env., 37(3): 443-452.
CrossRef - Arnold, J.G., R. Srinivasan, R.S. Muttiah, and J.R. Williams. 1998. Large Area Hydrologic Modeling and Assessment Part I: Model Development. Journal of the American Water Resources Association 34:73-89.
CrossRef - Black, P. E.: Watershed functions, J. Am. Water Resour. As., 33(1), 1–11, 1997.
CrossRef - 15 Bruijnzeel, L. A.: Hydrological functions of tropical forests: not seeing the soil for the trees?,Agr. Ecosyst. Environ., 104, 185–228, 2004.
CrossRef - De Pauw, E., Oweis, T., and Youssef, J. 2007. Assessment of potential water harvesting by integrating expert knowledge in GIS, methodology and a case study in Syria. (ICARDA), Aleppo, Syria. 41 pp.
- De Pauw, E., Oweis, T., Youssef, J., and Bashar, N. 2006. Assessing Biophysical Potential for Water Harvesting at National and Global Scale. 18th World Congress of Soil Science July 9-15, 2006 – Philadelphia, Pennsylvania, USA.
- Di Luzio, M., R. Srinivasan, and J.G. Arnold. 2002. Integration of watershed tools and SWAT model into BASINS. Journal of the American Water Resources Association 38:1127–1141.
CrossRef - Di Luzio, M., R. Srinivasan, and J.G. Arnold. 2004. A GIS-Coupled hydrological model system for the water assessment of agricultural nonpoint and point sources of pollution. Trans. in GIS. 8:113-136.
CrossRef - Dunne, T., and R. D. Black.1970. Partial area contributions to storm runoff in asmall New England watershed, Water Resour. Res., 6, 1296– 1311.
CrossRef - FerasZiadat, TheibOweis, Eddy de Pauw, Mhieldin El Oyjaly, YounisAwami, Ahmed Al-Buaishe, Ahmed Al Wadaey, Mohamed Saleh and Hussein Talib,2010. Characterization of selected watersheds for integrated research activities in Libya. Unpublished report.
- FAO. 2005. AQUASTAT – database (available at http://www.fao.org).
- Hewlett, J. D. Watershed management, In Annual Report for 1961, Southeastern Forest Experiment Station, U. S. Forest Service, pp. 61-66,196 la.
- Holme, D. and Tagg, J.G. 1996. Remote sensing and GIS in community based natural resource management in Namibia in Proceedings of an International Conference on the Application of Remotely Sensed Data and GIS in Environmental and Natural Resources Assessment in Africa, Harare, March 15-22, 1996: Harare, ERSI, 391-394 p.
- MwengeKahinda, J., Lillie, E. S. B., Taigbenu, A. E., Taute, B., Boroto, R. J. 2008. Developing suitability maps for rainwater harvesting in South Africa. Physics and Chemistry of the Earth, Parts A/B/C, 33 (8-13): 788-799.
CrossRef - Neitsch, S.L., Arnold, J.G., Kiniry, J.R., Williams, J.R., King, K.W. 2000. Soil and Water Assessment Tool.VERSION 2000. Grassland, Soil & Water Research Laboratory, Temple, Texas.
- Oweis, T. and Hachum, A. 2006. Water harvesting and supplemental irrigation for improved water productivity of dry farming systems in West Asia and North Africa. Agricultural Water Management, 80: 57-73.
CrossRef - Oweis, T. and Hachum, A. 2003. Oweis and A. Hachum, Improving water productivity in the dry areas of West Asia and North Africa. In: W.J. Kijne, R. Barker and D. Molden, Editors, Water Productivity in Agriculture: Limits and Opportunities for Improvement, CABI Publishing, Wallingford, UK (2003) pp. 179–197.
CrossRef - Oweis, T. 1999. Supplemental Irrigation: A Highly Efficient Water Use Practice. On-farm Water Husbandry Research Report Series No. 2, ICARDA, Aleppo, Syria.
- Oweis, T., Oberle, A., and Prinz, D. 1998. Determination of potential sites and methods for water harvesting in Central Syria. In: H.-P. Blum, H. Eger, E. Fleischauer, A. Hebel, C. Reij, and K.G. Steijner (ed.), Towards sustainable land use Vol. 1. Advances in Geoecology 31. Catena Verlag, Reiskirchen, Germany. p.83-88.
- Sivapalan, M.: Pattern, process and function: elements of a unified theory of hydrology at the catchment scale, in: Encyclopedia of Hydrological Sciences, edited by: Anderson, M. G., 10 John Wiley & Sons, Ltd, 2005.
CrossRef - Patrick, E. 1997. Assessing water harvesting suitability. In Proceedings of the international workshop remote sensing and water resources. Food and Agriculture Organization of the United Nations. Montpellier, France, November – December 1995.
- Patrick, E. 2002. Using remote sensing and indigenous knowledge for management of ephemeral surface water. Aridland Newsletter, the University of Arizona, No. 51, May/June 2002.
- Prinz, D., Oweis, T., and Oberle, A. 1998. Rainwater Harvesting for Dry Land Agriculture – Developing a Methodology Based on Remote Sensing and GIS. Proceedings, XIII. International Congress Agricultural Engineering, 2 -6 February, ANAFID, Rabat, Morocco.
- Samuel .M.P and Mathew A.C. 2008. Rejuvenation of water bodies by adcontrol soil erosion and reduce the impact of drought adopting rain water harvesting and ground water recharging practices in catchment area –A case study. Proceedings of Taal 2007.The 12th world lake conference 766-776.
- Uhlenbrook.S, McDonnell.J and Leibundgut.C.2003. Runoff generation and implications for river basin modelling special issue. Vol. 17 P 197–198.
- Van Wesemael, B., Poesen, J., Sole Benet, A., Cara Barrionuevos, L., and Puigdefabregas, J. 1998. Collection and storage of runoff from hillslopes in a semi-arid environments: geomorphic and hydrologic aspects of the aljibe system in Almeria Province, Spain. Journal of Arid Environments. 40: 1-14.
CrossRef

This work is licensed under a Creative Commons Attribution 4.0 International License.


