

Manuscript accepted on : 14 February 2016
Published online on: 26-02-2016
Study of Genetic Diversity of Sheep Breeds In Afghanistan
Mohammad Osman Karimi1, Mohammad Mahdi Shariati1*, Saeed Zerehdaran1, Mohammad Hossein Moradi2, Ali Javadmanesh1
1Ferdowsi University of Mashhad (FMU) 2Department of Animal Science, Faculty of Agriculture and Natural Resources, Arak University, Arak, Iran
DOI : http://dx.doi.org/10.13005/bbra/2072

ABSTRACT: Livestock production, such as mutton, milk and egg are important both as food and as trading staples. On the other hand, exterior exchange is being gained from selling the hide, wool, and other sub-products of the animals. The objective of this study is analysis of selected markers search as comparisons of two breeds among three Arab, Baluch and Gadic breeds. Mutual comparisons are conducted for detecting differences between breeds and accurately analyzing these differences. In this research the methods of haplotypic blocks analysis in experimental regions, the way of their erosions and LD graphs are drawn using Haploview v4.2 Software. Inputs used in this software consists genotypic information of markers in experimental regions and statistics that are used for LD calculation are the same correlational coefficients between r2 and surrounding SNPs.Animals and Samples Collection In this study, 45 blood samples were collected from three districts of Herat province (Shindand, Gulran and Obe) of three Afghan sheep breeds (Arabi, Baluchi and Gadic). 10 µL of blood was collected via the jugular vein in Venoject tubes with EDTA (Ethylene Diamine Tetraacetic Acid)for prevention of coagulation blood was collected immediately stored at 4 °C in the refrigerator. DNA was extracted from blood using the GenElute™ Blood Genomic DNA Kit. DNA concentration was determined using NanoDrop (Spectrophotometer ND-1000).Considering excess of heterozygosity within studied breeds, one can conclude that these breeds are not threatening in terms of heterozygosity decline and can be considered as an appropriate genetic reserve for different husbandry and eugenic purposes in Afghanistan. Furthermore high heterozygosity in studied chromosomes in Arab, Baluch and Gadic races suggests high diversity within population in spite of carrying out eugenic activities on livestock due to managerial plans which has managed to reduce the consistency level and keep the diversity in acceptable level.
KEYWORDS: Genetic diversity; sheep breed; LD graph; SNP; Afghanistan; Heterozygosity
Download this article as:| Copy the following to cite this article: Karimi M. O, Shariati M. M, Zerehdaran S, Moradi M. H, Javadmanesh A. Study of Genetic Diversity of Sheep Breeds In Afghanistan. Biosci Biotech Res Asia 2016;13(1) |
| Copy the following to cite this URL: Karimi M. O, Shariati M. M, Zerehdaran S, Moradi M. H, Javadmanesh A. Study of Genetic Diversity of Sheep Breeds In Afghanistan. Biosci Biotech Res Asia 2016;13(1). Available from: https://www.biotech-asia.org/?p=6800 |
Introduction
Afghanistan is a completely landlocked country, which lies between 29° and 38° N and 61° and 75° E (Thieme, 2006; Anwar U.H. and Lal R, 2007). Furthermore, it is bounded on the north by Turkmenistan, Uzbekistan and Tajikistan, on the east by China and Pakistan, on the south by Pakistan and on the west by Iran. Access from the north is good; the eastern frontier is blocked by some of the world’s highest mountain ranges: the Karakoram and the Pamir.
As mentioned earlier, Afghanistan has a different climate. The seasonal climate varies from one region to other region.
Afghanistan is a mountainous country; therefore there are alterations between north and south, west and east areas. It shows a big variety of ecological conditions, also a big variety of vegetation types which cover the land surface. These vegetation types are consisting of a high biodiversity (Breckle, 2007; Shank, 2008).
Around 2/3 population of Afghanistan is engaged in agriculture and, particularly in field of livestock. Most of animal products in Afghanistan are meat, milk, egg, wool, hide (raw skins of cattle, sheep, etc.); animals are also used for the purpose of work and transportation. The meat is mainly from mutton which is a one year old or older. Cattle, buffalo, sheep and goat are the main species which produce milk while meat is produced by cattle, sheep, goat and poultry. The most specialized sheep breeds, such as Karakul, are used majorly for producing hide and in the other hand; the yarn made from wool comes from sheep, goat and camel. Finally, cattle, horse, mule and camel are used in agricultural labors and for transformational purposes. The comprehensive picture of the distribution of livestock species in Afghanistan is reported in.
Herat province due to plain areas and temperate climate is ideal for small ruminant rearing. There are 9.11% sheep, goats with 9.2%. Furthermore, this province has the 9.8% of the Afghanistan donkey population.
The total number of camels in Afghanistan is 175,270, from which about 17.81% exists in Kandahar province. It is because this province is one of the warmest areas and has the major parts of deserts in Afghanistan and camels are well adapted to this environment. People, especially Kuchi, use camel mainly for transport, during seasonal migration. Nangarhar province has the highest percentage (8.6%) of poultry. This province is neighbor to Pakistan, and all the mother stock eggs for the incubator, and also the three-day-old chickens are imported from Pakistan. In general, production level per animal is low compared to the other countries. However, an improvement of livestock production, both in terms of quantity and quality, is of essential importance for Afghanistan for many following reasons.
According to the current statistical data, around 50.6 percent of the country exports were agricultural and livestock products, while the 17.5% of total exports of the country is represented by carpet (7.2 %), leather and hide (5.6 %), karakul (2 %), wool (2.7 %), intestine (0.4 %) (Zia, 2005).
The livestock kept in Afghanistan is typically raised for local consumption and to generate income through sale of livestock and livestock products.So, the animal products are low due to lack of knowledge of giving proper diet to the animals by the breeders. Another reason is lack of local marketing and the link with the national market. If we compare cosmopolitan breeds, Holstein, Brown Swiss and Jersey local breeds, Kandahari, Konari with Sistani breeds,theyproduce much less milk in the same lactation period than those of cosmopolitan.
Livestock production, such as mutton, milk and egg are important both as food and as trading staples. On the other hand, exterior exchange is being gained from selling the hide, wool, and other sub-products of the animals. As we know, a major part of the country has a particular topography which cannot be used for cultivation and agricultural purposes, but an unlikely effective use from these areas are essential as pasture for livestock fodders.So, livestock is a beneficial and effective occupation that provides good engagement for the farmers alone or beside the normal agricultural activities (Jahesh, 2011).
Sheep husbandry is a job opportunity for Afghan communities to generate income by sheep products which include hide, fat, mutton, milk and milk products (cream, butter, curd (dried whey), yogurt, and cheese). These are the major income resources for sheep breeders. In some parts of the country some farmers are keeping their sheep to be fattened and slaughtered in the beginning of winter for dried meat or mutton (local name is Lahndi or qadid, air-dried salted meat often lamb) to be consumed during the winter. (Ulfat & Iqbal, 2000).
The Arabi sheep breed
The Arabi sheep is the third most important sheep breed in the Heart province. This breed makes up 13% of all sheep in Afghanistan (Omid, 2009). It is found in Gulran, Karukh, Guzara and Injil districts. The local name of this breed in Herat province is Buri. This breed is fat-rumped, has long ears and both sexes are polled. The majority of these sheep are black with a characteristic white stripe along the forehead however in Herat province most Arabi sheep breeds have brown color. Accumulation of fat makes up two separate mass in the tail. These sheep are a large-farmed sheep with 45-50 Kg of body weight and a good mutton conformation and fattening ability. This breed is mainly used for meat, and short coarse wool. They have poor quality wool production 1.2-1.7kg. The milk yield of this breed during 130-140 days of a lactation period is 45-55 Kg. The fertility is (65-80 %) with (0-2%) chance of twinning. The sex mature rate is 6-8 months (Rashiq, 2006).
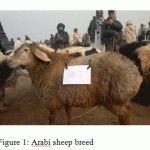 |
Figure 1: Arabi sheep breed |
The Baluchi breed makes up 13% of all sheep in Afghanistan (Omid, 2009). The wool color is white but there are some black spots around its mouth, nose, feet and its bottom parts. They have rather long earsand both ewe and ram are polled. They belong to fat-tailed breeds, the local name of this breed in Herat province is Guldom. This breed is found in Shindand, Zendajan Ghoryan Obe, Rabat Sangi and Kushki kuhna districts and has a better adaptation, to the arid range and desert areas. The annual greasy fleece weight is 1.3-2 Kg. The Baluchi is a medium-sized sheep with average body weight of 34-36 Kg. This is the meaty and wooly type breed. The birth rate of this breed is (60-75%) with (0-1%) chance of twinning. The milk yield during 120-130 days of a lactation period is 35-40 Kg (Zafar, 2005; Rashiq, 2006). It produces good quality carpet wool.
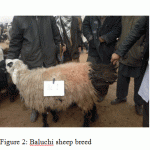 |
Figure 2: Baluchi sheep breed |
The Gadik Sheep Breed
This breed is mainly reared in Badakhshan (Wakhan) but also they are found in Obe, kushki kuhnaand Rabat Sangi Wakhan Gadikare. The breed is mostly white but there are some black and brown spots on the head and feet. In Wakhan Gadik have better adaptation and I choose for the study the Wakhan Gadik breed. Panjsher Gadik is dark brown and white
The Gadik sheep breed has small and short structure and belongs to fat-tailed. The ewes are polled and rams have strong horns. These breeds make up 1% of all sheep in Afghanistan. Gadik produces the finest wool amongst other breeds. It has 81.4% pure wool and 18.6 % hair in its wool fiber. The weight of an adult ewe is 25 to 28 kg, it produces 30 to 35 Kg of milk and the period of lactation is 120 to130 days. It produces wool 0.6 to 0.9 Kg annually, and the percentage of producing lamb is 65- 75% and the percentage of producing twin lambs is 0-1%. Some authors have declared that this breed can adapt to other environments other than their current environment (Rashiq, 2006; Omid, 2009).
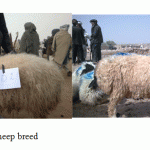 |
Figure 3: Gadik sheep breed |
Table 1: Herat province total population of sheep by district
| No. | District | Head | No. | District | Head |
| 1 | ADRASKAN | 22166 | 9 | KOHSAN | 50987 |
| 2 | CHISHTI SHARIF | 8641 | 10 | KUSHKI KUHNA | 35799 |
| 3 | FARSI | 5579 | 11 | OBE | 37499 |
| 4 | GHORYAN | 86652 | 12 | PASHTUN ZARGHUN | 29636 |
| 5 | GULRAN | 175077 | 13 | RABAT I SANGI | 73505 |
| 6 | GUZARA | 26740 | 14 | SHINDAND | 111413 |
| 7 | INJIL | 50207 | 15 | ZINDA JAN | 37959 |
| 8 | KARUKH | 38848 | |||
| Total | 413910 | 376798 |
Reasons why these three breeds were chosen for the study of ovinebiodiversity in Afghanistan are as follow;Arabi sheep are well adapted for Gulran, Karukh, Guzara and Injil districts. These parts have a colder climate and flatter terrain, which suits this large breed than other areas of Herat province. Arabi breed can better tolerate the coldness. The Baluchi sheep are better adapted for the Shindand, Zendajan, Ghoryan, Obe, Rabat Sangi and Kushki Kohna districts. In the south and southwest of Herat province, Baluchi sheep, are better adapted to the environment, because these areas are warm, and plain area. According to sheep breeders, Baluchi sheep have a better ability to walk than other breeds and they can even eat the dry stems of some of the thistle (alhagi). The Gadik sheep breeds are better adapted for the Obe, Rabat Sangi and Koshki kohna districts. This breed has a better compatibility for cold and high-altitude areas, because these sheep are light weight and they can use the Highland pastures. In Figure 4 is illustrated the percentage of these three sheep breeds in the province of Herat.
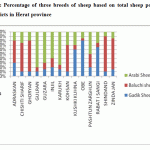 |
Figure 4: Percentage of three breeds of sheep based on total sheep population of different districts in Herat province |
GeneticDiversity
Genetic diversity plays an important role in the lives of most species that live longer. Diversity in genetics occurs at the molecular level as it is the key to the development of past, present and future of agriculture and animals, so it’s very important to know the information about the population of animals farm and their genetics in animal breeding (Esmail-Khanian et al., 2007).
Genetic diversity is represented in the observation that there is a diversity of genes within single species. Other genetic diversities can occur in random mutation at the molecular level.
Genetic diversity is the variation of heritable characteristics of a population.Genetic diversity shows a diversity of genes within a single animal. The others can occur randomly in mutation at the molecular level.
Genetic diversity is the variation of heritable characteristics in the same species population. It plays a significant role in evolution by allowing a species to adapt to a new environment and to stand against parasites.
Importance of genetic diversity for the sustainability of livestock
The term of biodiversity has been introduced as “the wealth of the poor” (World Resources Institute 2005) because the biodiversity provides goods and services for the poor who tend to live in the rural areas and their lives are dependent on land. For example, a productive crop and grazing land, fuel, building materials and wild fish. Land rich in biodiversity is a form of wealth, even if that wealth cannot be measured in strictly monetary terms. Genetic diversity is essential for the sustainability of livestock (and other) species for a variety of reasons:
Genetic diversity within the breed: for long-term genetic improvement of livestock breeds, and the election of new features or attributes in a changing environment. Also to avoid inbreeding is important because of low performance.
Genetic diversity between breeds: Local breeds for the support and maintenance of genetic diversity in animals with high production are used. The local breeds have specific social and economic value; these animals have good adaptation with the toughest conditions. Furthermore the local breed is one of our cultural heritages (Gandini & Villa, 2003).
The genetic diversity found in livestock allows livestock keepers to help the livestock to resist disease, environmental change, marketing of livestock, etc. Maybe it is impossible to predict. Most breeds are rare today due to the loss of products and lack of good market. The Finn sheep, for example, was cast aside by commercial breeders decades ago and kept only by Finnish peasants.
Molecular marker sand marker assisted selection
Molecular markers are useful tools in an accurate method that can substitute the traditional and classical genetic techniques for betterment and amelioration of eugenic programs and differentiation within the breeds.Molecular markers can be better alternative sources of information for estimating genetic diversity, in the case of missing dynasty data or pedigree errors. Indeed when the information of pedigree is available for markers, they may allow estimating the genetic diversity more exactly.
Genetic markers are differentiators between the DNA of each chromosome that is transferred from a parent to the descendants. Mostly when they are used between individuals, populations, species, breeds… they are called genetic markers that differentiate and distinguish them from one another. A genetic marker requires polymorphism (variation) and the heritability.In the past genetic diversity studies such as Allozymes, also they were studied on the base of protein variants in enzymes and the reason was that the number of loci and polymorphism level was low and the other markers have taken over.
SNP (Single Nucleotide Polymorphism) markers, for assessing genome-wide genetic variation, provide new possibilities for genetic diversity and selection in QTL analysis. Studies of SNP markers are now using SNPs in genomic selection in livestock breeds (Zenger et al., 2007; Muir et. al., 2008; Kijas et. al., 2009).
They are series of DNA which are connected to the genes that lie under a quantitative trait.Mapping regions of the genomes that include genes which are classified as quantitative characteristics are done using molecular tags as AFLP or mostly as SNPs.
This is an early-used stage in identifying and sequencing the actual genes that lie under the characteristic variation. Quantitative characteristics refer to phenotypes that vary in degree and can be ascribe to polygenic effects. For example: production of 2 or more genes and their environment.
Advantages of genetic diversity estimation with SNP markers
In addition to pedigree information, SNP markers help us to realize whatthe DNA is. Using SNP markers gives more information than Pedigree Charts, and the information is more accurate. Therefore, if pedigree information is missing, SNP markers can provide more data. Combining Pedigree and SNP data is a good way to estimate Genetic Diversity. We can also use SNP to see genetic diversity at the genome level. It allows us to identify low and high regions of diversity of the genome. If low regions have been identified, they can be conserved (Vanraden, 2007). Because low regions can be easily under the study, research and control.
When the sub population has the same allele frequency equals to zero and when all allele are different this coefficient is 1. is and indicator of genetic diversity of all population and is always positive. and are indicators of deviation from Hardy-Winberg Equilibrium respectively within the subpopulation and in all population. Their positive values indicate reduction of heterozygosity and their negative values indicates the increase of heterozygosity.
HT is the total gene diversity or expected heterozygosity In the population.
HI is within population gene diversity or average observed heterozygosity in a group of communities.
HS is average expected heterozygosity in each sub population.
Fst in the range of 0 to 0.05 indicate less genetic diversity, in range of 0.05 to 0.25 indicates more genetic diversity.
F indices make the analysis of sub population possible. These indices can be used to measure the genetic distances between populations. With the assumption of the sub population which had matting has different allele frequencies from total population ones (Krap et al 1998).
Materials and Methods
Data collection and DNA extraction:
Animals and Samples Collection In this study, 45 blood samples were collected from three districts of Herat province (Shindand, Gulran and Obe) of three Afghan sheep breeds (Arabi, Baluchi and Gadic). 10 µL of blood was collected via the jugular vein in Venoject tubes with EDTA (Ethylene Diamine Tetraacetic Acid)for prevention of coagulation blood was collected immediately stored at 4 °C in the refrigerator. DNA was extracted from blood using the GenElute™ Blood Genomic DNA Kit. DNA concentration was determined using NanoDrop (Spectrophotometer ND-1000).
Genotyping using Ovine 50K SNPChip and data mining:
A total of 15 Arabi, 15 Balochi and 15 Gadik sheep breed were genotyped at 53862 SNP loci with the OvineSNP chip50K Beadchip (http://www.illumina.com). usually those SNP that had been assigned to the 26 autosomes and X chromosome was measured) Then for each SNP, minor allele frequency (MAF) (over all animals) less than 2% were removed and percentage of calls rate ≤ 95% (how many sheep the marker worked for) was removed (Teo YY, Fry AE, Clark TG, Tai ES, Seielstad M: On the usage of HWE for identifying genotyping errors. Annals of Human Genetics 2007, 71:701-703).
For the remaining SNPs outlier departure from Hardy-Weinberg equilibrium (p < 10-2) over all animals of a breed were used for identifying genotyping errors (Teo YY, Fry AE, Clark TG, Tai ES, Seielstad M: On the usage of HWE for identifying genotyping errors. Annals of Human Genetics 2007, 71:701-703). After edits, 47326 markers for Arabi vs Balochi, 46284 marker for Arabi vs Gadik and 47159 for Baluchi vs Gadik were retained for the study. Missing data were replaced with the most frequent allele at that specific locus. Allele frequencies and observed and expected heterozygosity were calculated for each breed.
Statistical analysis based on LD and Haplotypical length;
One very productive way for recognition of done selections in genome level is to utilize analysis based on LD. Because as it is said, selection for a beneficial allele is accompanied with selection of loci that are attached around.
Unlike analysis such as; FST, methods based on LD depend to frequency and distance between SNPs because these analysis are multiple.
The most important statistical analysis used in this way are; EHH (Extended Haplotype Homozygosity), his (Integrated Haplotype Score) and XP-EHH (Cross-Population EHH) (Sabeti et, al, 2002; Prasad et, al, 2006).
In this research the methods of haplotypic blocks analysis in experimental regions, the way of their erosions and LD graphs are drawn using Haploview v4.2 Software. Inputs used in this software consistsgenotypic information of markers in experimental regions and statistics that are used for LD calculation are the same correlational coefficients between r2 and surrounding SNPs.
Statistical Analysis and Calculation of Population Differentiation between Different Breed Pairs:
Total allelic frequencies for each locus, and considering all animals as a single population was calculated as:
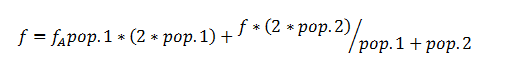
Where pop.1=number of individuals in population1 and pop.2=number of individuals in population2.
![]()
Then, expected heterozygosities in populations (Hs) and overall (Ht) were calculated. Finally, Fst was calculated according to Weir and Cockerham (1984):
![]()
After calculated Fst I calculate the wim5 Fst , for this calculation I did average from every4 Fst and I deleted two first Fst and two end Fst from every chromosome (-180 Fst from 27 chromosome) finally calculated Win5 Fst Manhattan Plot and Fst Manhattan Plot.
Study of Homozygosity and Heterozygosity in Different Breeds
A way for recognition of selection among the breeds and recognition of breeds that are aimed for selection is the homozygosity comparison over the genomic region. Considering two distinct breeds, selection can be done in two ways; firstly when a beneficial mutation is only selected in one of the breeds while selection isn’t aimed for the other breed. It is expected to show one of those two above-mentioned homozygosity breeds in one genomic region while the other breed isn’t under such a consideration.
Secondly if different alleles of one mutation in the considered breeds are selected in two different directions, it means selection is done for one of the alleles in each breed, so that it is expected to show both above-mentioned homozygosity breeds. Within this research homozygosity for each SNP marker is first determined by valuing 1 and 0 for homozygote and heterozygote markers in order and then average length of homozygosity is calculated for each SNP considering near-bordered SNPs in Microsoft Excel 2010 and related plot is drawn on two sides of candidate genomic region in each breed. Thus in these graphs values are indicator of average length of homozygosity for each SNP considering at homozygosity in near-bordered SNPs. This analysis is the same as study of LD in the region that in which homozygosity is indicator of the selection in the same genomic region.
Results and discussion
Data filtration obtained from determining samples genotypes for doing final analysis
90 animals including 30 samples from each Baluch, Arabic and Gadic breed have been genotyped through Ovine BeadChip arrays. At the beginning after primary control in the genotype determination step, two animals (one from Arab breed and one from Gadic breed) are eliminated from subsequent analysis methods due to having more than 10% lost genotype and finally 99 animals are remained for subsequent steps. Different stages of SNP markers filtration are presented in table 1-4.
| Edition stage | Arab-Baluch | Arab-Gadic | Baluch-Gadic |
| Total of animals | 30 | 30 | 30 |
| Eliminating samples due to having more than 10% obtained genotype | 0 | 1 | 1 |
| Number of remained samples | 30 | 29 | 29 |
| Number of SNPs | 53862 | 53862 | 53862 |
| 2665 | 2659 | 2758 | |
| Eliminating SNPs with MAF<2% in sum of samples | |||
| Eliminating SNPs with Call rate <95% in sample sum | 3870 | 3900 | 3797 |
| Number of remained samples | 47327 | 47303 | 47307 |
In sum 47327, 47303 and 47307 SNP markers have managed to pass quality control stages in Baluch, Arab and Gadic breed, respectively. As for SNPs, 2665, 2659 and 2758 SNP have been eliminated in Baluch, Arab and Gadic breeds respectively, due to MAF less than 0.02. Similarly, 3870, 3900 and 3797 SNPs have been eliminated in Baluch, Arab and Gadic breeds respectively, due to 0.05 obtained Genotype and finally 47327, 47303 and 47307 SNP markers are remained for subsequent analysis. Finally, SNPs which have passed through all quality control steps are kept for subsequent analysis. This information has been used for PCA analysis, population structure and LD structure.
PCA analysis, population structure, population differentiation index
In this paper, population structure and manner in which these three sheep population of Afghanistan are examined in their breed groups from PCA analysis through information of samples genotypes by Admixture software. PCA analysis results showed that the studied population can be found in quite distinct groups based on PC1 and PC2 information and only one animal belong to Gadic breed has stood away from its own breed group, but the same breed has no overlap with other breeds too and probably they are some half breed from studied populations. This sample is eliminated from subsequent analysis.
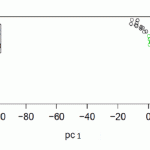 |
Figure 5 |
Due to scarcity of remained animals by elimination of one animal from Gadic breed 44 animals remained for subsequent analysis is taken into account. Considering PC2, Arab, Baluch and Gadic populations are separated from each other. In another study in species such as car, sheep and pig animals are classified only based on special vectors I and II and according to breed and geographical region (Gibbs, et al., 2009., Yang et al., 2012). By the same population diversity one can hope to find some points from genome which are selected in a significant manner. Moreover, due to natural selection during adaption, a set of selection is taken place on these species. This gives rise to population differentiation. Adaptation with local environments and artificial selection can alter allele frequency on genome special positions. In fact, frequency of decent alleles increases in selected position and it results in population differentiation numerical value (FST) higher than expected (Akey et al, 2002). Obtained population differentiation for studied populations shows low and middle population differentiation. Results of population differentiation analysis confirm presence of three distinct populations or breed.
Statistics related to SNP markers and their distribution on Afghani sheep chromosomes
Table 2: Properties of used SNPs in analysis related to breed comparing Arab-Baluch breeds and distance between them on different chromosomes
| Chromosome | Number of SNP markers | Average of distance
(bp) |
Minimum distance (bp) | Maximum distance (bp)
|
length of genome (bp) |
| 1 | 5157 | 58108.32318 | 1753 | 941607 | 299548406 |
| 2 | 4815 | 54634.94516 | 1936 | 898517 | 263012626 |
| 3 | 4390 | 55292.28731 | 5326 | 872478 | 242677849 |
| 4 | 2362 | 53838.01991 | 5393 | 467514 | 127111565 |
| 5 | 2084 | 56048.1037 | 65 | 842189 | 116748200 |
| 6 | 2305 | 55995.12717 | 5342 | 2936691 | 129012773 |
| 7 | 2022 | 53770.69767 | 5383 | 1133529 | 108670580 |
| 8 | 1766 | 55394.53341 | 5458 | 624774 | 97826746 |
| 9 | 1886 | 53469.55756 | 5353 | 789815 | 100790116 |
| 10 | 1634 | 57622.2774 | 3113 | 3418843 | 94097179 |
| 11 | 1036 | 64602.43865 | 5300 | 489036 | 66863524 |
| 12 | 1481 | 58144.42297 | 5288 | 953643 | 86053746 |
| 13 | 1487 | 59564.32301 | 5478 | 902996 | 88512584 |
| 14 | 1055 | 65227.07021 | 5365 | 873165 | 68749332 |
| 15 | 1489 | 60373.71102 | 5414 | 2321143 | 89836082 |
| 16 | 1381 | 55920.54275 | 5786 | 616675 | 77170349 |
| 17 | 1267 | 61960.35229 | 5434 | 562710 | 78441806 |
| 18 | 1250 | 57557.78463 | 5366 | 558227 | 71889673 |
| 19 | 1105 | 58690.71558 | 5353 | 507338 | 64794550 |
| 20 | 1020 | 54509.49657 | 5499 | 729287 | 55545177 |
| 21 | 783 | 70371.56777 | 5363 | 1970435 | 55030566 |
| 22 | 973 | 56603.15123 | 5312 | 2215283 | 55018263 |
| 23 | 976 | 67955.15795 | 5622 | 715163 | 66256279 |
| 24 | 639 | 69399.67712 | 5514 | 406074 | 44276994 |
| 25 | 880 | 54641.2537 | 5514 | 589556 | 48029662 |
| 26 | 804 | 62043.45953 | 915 | 1691855 | 49820898 |
| 27 | 1279 | 100107.4844 | 5314 | 2336684 | 127937365 |
| total | 60438.76 | 65 | 3418843 | 2773722890 |
Table 3: Properties of used SNPs in analysis related to breed comparing Arab-Gadic breeds and distance between them on different chromosomes
| chromosome | Number of SNP markers | average of distance
(bp) |
Minimum distance (bp) | Maximum distance (bp)
|
length of genome (bp) |
| 1 | 5150 | 58176.03535 | 1753 | 941607 | 299548406 |
| 2 | 4809 | 54703.12521 | 1936 | 898517 | 263012626 |
| 3 | 4390 | 55292.28731 | 5326 | 872478 | 242677849 |
| 4 | 2362 | 53838.01991 | 5393 | 467514 | 127111565 |
| 5 | 2094 | 55780.31534 | 65 | 842189 | 116748200 |
| 6 | 2311 | 55849.68528 | 5344 | 2936691 | 129012773 |
| 7 | 2020 | 53823.96236 | 5383 | 1133529 | 108670580 |
| 8 | 1771 | 55269.34802 | 5385 | 668174 | 97826746 |
| 9 | 1880 | 53640.2959 | 5353 | 789815 | 100790116 |
| 10 | 1645 | 57236.72689 | 3113 | 3418843 | 94052172 |
| 11 | 1027 | 65169.12671 | 5300 | 489036 | 66863524 |
| 12 | 1473 | 58357.04755 | 5288 | 953643 | 85901574 |
| 13 | 1484 | 59684.81726 | 5478 | 902996 | 88512584 |
| 14 | 1057 | 65103.53409 | 5283 | 873165 | 68749332 |
| 15 | 1486 | 60495.67811 | 5414 | 2321143 | 89836082 |
| 16 | 1368 | 56452.34016 | 5786 | 616675 | 77170349 |
| 17 | 1254 | 62539.89385 | 5434 | 562710 | 78362487 |
| 18 | 1254 | 29975.47087 | 5366 | 558227 | 71889673 |
| 19 | 1095 | 59227.19378 | 5353 | 507338 | 64794550 |
| 20 | 1020 | 54509.49657 | 5499 | 729287 | 55545177 |
| 21 | 783 | 70371.56777 | 5363 | 1970435 | 55030566 |
| 22 | 976 | 56428.98769 | 5312 | 2215283 | 55018263 |
| 23 | 982 | 67539.53007 | 5622 | 688072 | 66256279 |
| 24 | 639 | 69399.67712 | 5514 | 406074 | 44276994 |
| 25 | 880 | 54641.2537 | 5514 | 589556 | 48029662 |
| 26 | 807 | 61812.52854 | 915 | 1691855 | 49820898 |
| 27 | 1285 | 99639.69237 | 5314 | 2336684 | 127937365 |
| Total | 59442.88 | 65 | 3418843 | 2773446392 |
Table 4: Properties of used SNPs in analysis related to breed comparing Baluch-Gadic breeds and distance between them on different chromosomes
| chromosome | Number of SNP markers | average of distance
(bp) |
Minimum distance (bp) | Maximum distance (bp)
|
length of genome (bp) |
| 1 | 5143 | 58255.23259 | 1753 | 941607 | 299548406 |
| 2 | 4807 | 54725.88972 | 1936 | 898517 | 263012626 |
| 3 | 4383 | 55380.61365 | 5326 | 872478 | 242677849 |
| 4 | 2367 | 53724.24556 | 5393 | 467514 | 127111565 |
| 5 | 2079 | 56182.96439 | 65 | 842189 | 116748200 |
| 6 | 2301 | 56092.51 | 5342 | 2936691 | 129012773 |
| 7 | 2018 | 53877.33267 | 5383 | 1133529 | 108670580 |
| 8 | 1774 | 55175.82967 | 5458 | 593142 | 97826746 |
| 9 | 1881 | 53611.76383 | 5353 | 789815 | 100790116 |
| 10 | 1656 | 56856.30151 | 3113 | 3418843 | 94097179 |
| 11 | 1032 | 64853.07856 | 5300 | 489036 | 66863524 |
| 12 | 1480 | 58080.84787 | 5288 | 953643 | 85901574 |
| 13 | 1494 | 59285.05291 | 5478 | 902996 | 88512584 |
| 14 | 1055 | 65227.07021 | 5283 | 873165 | 68749332 |
| 15 | 1481 | 60700.05541 | 5414 | 2321143 | 89836082 |
| 16 | 1376 | 56123.89018 | 5786 | 616675 | 77170349 |
| 17 | 1269 | 61862.62303 | 5434 | 562710 | 78441806 |
| 18 | 1252 | 57465.76579 | 5366 | 558227 | 71889673 |
| 19 | 1095 | 59227.19378 | 5353 | 507338 | 64794550 |
| 20 | 1023 | 54349.48826 | 5499 | 729287 | 55545177 |
| 21 | 779 | 70733.37532 | 5363 | 1970435 | 55030566 |
| 22 | 981 | 56141.08469 | 5312 | 2215283 | 55018263 |
| 23 | 982 | 67539.53007 | 5657 | 688072 | 66256279 |
| 24 | 638 | 69508.6248 | 5514 | 406074 | 44276994 |
| 25 | 876 | 54891.04229 | 5514 | 589556 | 42530665 |
| 26 | 807 | 61812.52854 | 915 | 1691855 | 49820898 |
| 27 | 1277 | 100264.3926 | 5314 | 2336684 | 127937365 |
| Total | 60442.53 | 65 | 3418843 | 2690901372 |
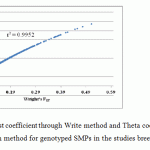 |
Figure 6: comparing Fst coefficient through Write method and Theta coefficient through Vier and Cocerham method for genotyped SMPs in the studies breed information |
Heterozygosity degree
Heterozygosity is the best and most important method for measuring genetic diversity which can be obtained from total in situ heterozygosity frequency. Figure 7 shows heterozygosity of Arab, Baluch and Gadic breeds in different autosomy chromosomes.
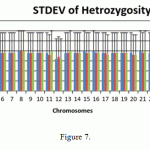 |
Figure 7 |
Conclusion
In this study, analysis of selection markers search is taken play as mutual comparisons. Mutual comparisons are conducted for detecting differences between breeds and accurately analyzing these differences. Then, identifying selected regions is carried out using Theta statistic. In this paper, some parts of genome is determined as selection markers which in previous studies have been determined as selection markers of Human, cow and livestock. By identifying genes in vicinity of regions and selected SNPs, biologic role of a set of these genes are not identified thoroughly, similarly, for some genes it is probability of mutual influences which are unknown. In general, for accurately identifying role of these genes, one should carry out continuous studies with more performance.
Considering attempt to record from pure livestock of Arab, Baluch and Gadic breeds within collecting Afghani races. However, due to adjacency with keeping place of these breeds with other breeds, it is expected that some undesired mixtures take place. Therefore for examining the manner in which different sample arrange in breed groups, the PCA analysis is used. Results show that except sample livestock 2, all livestock are found in related breeds. One of these animals belonged to Arab breed which has been recorded in gender comparison and by examining information genotype determination; genders of these samples were not matching. Therefore, this sample has been eliminated from final analysis. Another sample was from Gadic breed, similarly this livestock samples has been eliminated from subsequent examinations.
Considering excess of Heterozygosity within studied breeds, one can conclude that these breeds are not threatening in terms of heterozygosity decline and can be considered as an appropriate genetic reserve for different husbandry and eugenic purposes in Afghanistan. Furthermore high heterozygosity in studied chromosomes in Arab, Baluch and Gadic races suggests high diversity within population in spite of carrying out eugenic activities on livestock due to managerial plans which has managed to reduce the consistency level and keep the diversity in acceptable level.
Suggestions
Considering the conducted studies one can suggest:
By whole sheep genome sequencing within each three breeds or at least in some regions of genome which in current paper are identified as selection markers, in future studies one can examine LD structure based statistic with higher density of SNP markers and higher accuracy.
Using other world breeds genomes together with studies breeds and together analyzing population differentiation can be effective in finding selection markers and population structures.
Population genetic structures can be studied more deeply with more detailed on studied populations.
References
- Thieme Olaf (with contributions by J. M. Suttie) FAO 2006, Country Pasture/Forage Resource Profiles Afghanistan.
- W.S, 2007, Flora and Vegetation of Afghanistan. Germany.
- Zia Ziauddin, 2005, Principal of Livestock,. Prof. Faculty of Agriculture, Kabul University. In Persian (Dary).
- Jahesh Aghamir, 2012, Livestockspecialistat the Departmentof Agriculture and Livestockin Herat Province. In Persian (Dary).
- Ulfat-un-Nabi Khan (Animal Science) And Iqbal Muzaffar (Economics), 2000, Role and the size of livestock sector in Afghanistan
- Omid A Rahim, 2009, Investigation of Agriculture and Animal Husbandry situation in southwest part of Afghanistan. In Dari, Faculty of Agriculture Herat University
- Rashiq, Mohamed Hassan, 2006, sheep and goat husbandry. In Persian (Dary).
- Zafar Mustafa, 2005, National Livestock Production, Food Agriculture Organization Afghanistan (FAOAFG) National Coordinator of AnGR in Afghanistan.
- Gandini G. C E and Villa E, 2003, Analysis of the cultural value of local livestock breeds: a methodology, J. Anim. Genet. 120 (2003), pages 1–11, Dipartimento VSA, Facolta` di Medicina Veterinaria, Milan, Italy and 2Associazione Italiana Allevatori, Rome, Italy.
- Zenger, K.R., M.S. Khatkar, J.A.L. Cavanagh, R.J. Hawken, and H.W. Raadsma, 2007, Genome-wide genetic diversity of Holstein Friesian cattle reveals new insights into Australian and global population variability, including impact of selection. Animal Genetics Vol. 38, pages7-14.
- VanRaden P.M, 2007, Genomic Measures of Relationship and Inbreeding. Interbull Bull., 37, 33–36.

This work is licensed under a Creative Commons Attribution 4.0 International License.


