

Manuscript accepted on : 04 January 2016
Published online on: 22-02-2016
Design of Nuclear Power Plant Simulator Using Usb Ni-6009 Data Acquisition Module
Y.Varthamanan, V. J. K. Kishor Sonti, and A. Manikandan
Department of ECE, Sathyabama University
DOI : http://dx.doi.org/10.13005/bbra/2059

ABSTRACT: In this work, the Nuclear Plant Simulator power model has been simulated using Lab view Data Acquisition module. Energy is the focal point of any investigation at present in the research domain and this work contributes to understand the mechanism and challenges of clean energy generation. The development of GUI for Nuclear power plant is carried out using Labview and the power mode of the control panel was analyzed using test set up. This work on efficient energy generation is very significant as clean energy is the focal point of any application or contemporary research.
KEYWORDS: Nuclear power plant simulator; Data Acquisition and Power
Download this article as:| Copy the following to cite this article: Varthamanan Y, Sonti V. J. K. K, Manikandan A. Design of Nuclear Power Plant Simulator Using Usb Ni-6009 Data Acquisition Module. Biosci Biotech Res Asia 2016;13(1) |
| Copy the following to cite this URL: Varthamanan Y, Sonti V. J. K. K, Manikandan A. Design of Nuclear Power Plant Simulator Using Usb Ni-6009 Data Acquisition Module. and Chlorella sp. Biosci Biotech Res Asia 2016;13(1). Available from: https://www.biotech-asia.org/?p=6668 |
Introduction
World economic progress depends on the Energy. Today energy is the most important aspect for human living. World needs increased energy supply in the next two decades and especially clean energy. The demand for electricity or clean energy is increasing consistently and it is expected to rise by more than two-thirds from 2011 to 2035.
Nuclear energy constitutes to about 11% of the world’s electricity and in 2012, 42% of primary energy used was converted into electricity according to the Organization for Economic Co-operation and Development (OECD) countries [4 and 6].Renewable energy sources such as solar and wind are expensive in terms of per unit of output and are intermittent but can be helpful at the margin in providing clean power. Nuclear power is the environment friendly and gives clean energy.
The operation of a nuclear power plant is pretty much like a conventional plant. Nuclear power plant produces heat energy from splitting of heavy atoms rather than by burning coal, oil, gas, or another fuel. This heat is used to boil water to make steam that drives giant steam turbines connected to generators as a result of which the electricity is generated.
The operation and functionality of the various nuclear power plants can be graphically illustrated using graphical programminglanguage. The LabView Software is one such advanced graphical programming tool. Using NI DAQ module and LabVIEW software, the effect on the performance of various nuclear power plant Simulators design is considered. This gave adequate motivation to consider this work and it has been taken to the application level in the form of Nuclear Power Plant Simulator with Data Acquisition [1 and 5]
Many researchers have investigated this domain with distinct challenges and suggested possible solutions. Few notable contributions are:
Arun et al (2014) have demonstrated the Monitoring and controlling the fuel supply for increasing the Fuel efficiency and safety. Here they have modeled fuel supply System in LabVIEW for easy access of the system. The communication between the LabVIEW and PLC is done by using Object Linking and Embedding for Process Control (OPC) server software. BinduPillai et al (2013) have demonstrated the automated system that improves the system efficiency, plant monitoring, productivity and the operation management of the plant. They focuses on various aspects of automation of laboratory based mini-thermal power plant and virtual simulation of same [2]. R.K. Sinha et al (2005) have developed the Stage-3 of nuclear programme in India using thorium based Advanced Heavy Water Reactor (AHWR) working principle and design [3].
Proposed Nuclear Power Plant Simulator Block Diagram Using Ni – Hardware
The existing system makes use of Sequential Programming Languages for the development of Nuclear Power Plant Simulator. This involves lengthy and time consuming code-writing process. Detection and Rectification of errors in coding is difficult. This work surpasses the earlier challenges with the proposed Design of Nuclear Power plant Using Central Acquisition Process and Fuel Monitoring System by LABView.
The basic block diagram of the proposed work is represented in Figure 1. Whereas, Figure 2 shows the Circuit Diagram Of Proposed Nuclear Power Plant Simulator. Here USB NI-6009 used as the Main Module for Data Acquisition system that shown in Figure 3.
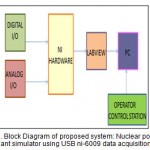 |
Figure 1: Block Diagram of proposed system: Nuclear power plant simulator using USB ni-6009 data acquisition |
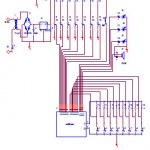 |
Figure 2: Circuit Diagram of Proposed system |
With recent bandwidth improvements and new innovations from National Instruments, USB has evolved into a core bus of choice for measurement applications.
The NI USB-6008 and USB-6009 are low-cost DAQ devices with easy screw connectivity and a small form factor. With plug-and-play USB connectivity, these devices are simple enough for quick measurements but versatile enough for more complex measurement applications.
The simplified PWR nuclear power plane model is as shown in the Figure 3 designed using LabVIEW graphical language program.
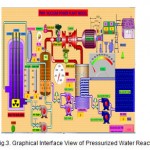 |
Figure 3: Graphical Interface View of Pressurized Water Reactor |
Some of the operational aspects constraints are:If Sea water Pump 1 trip then Sea water Pump 2will start in automatically, until sea water level goes ≤7M.If Feed Pump 1 trip then feed pump 2 will start automatically until condenser level goes ≤1m.If PHT pump 1 trip then PHT pump 2 start automatically, only if PHT pressure more 10 bar.
If Rx is critical Sea water pump both1/2 can`t stop manually and unless until sea water level goes ≤7m.When steam pressure goes beyond 26.3 bar that time Relief valve will actuates automatically then Dump valve will open, steam valve will close also Turbine trip, power will reduces.
The Analog input parameter block diagram is as shown in the Figure 4. Using NI-Hardware module (USB NI-6009) all 8 analog input lines are logically programmed and interfaced with LabVIEW program.
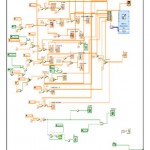 |
Figure 4: Analog Block Diagram |
The Digital input and output parameter block diagram is as shown in the Figure 5. Using NI-Hardware module (USB NI-6009)8 digital input lines and 4 digital output lines are Logically programmed and interfaced with LabVIEW program.
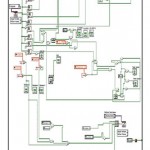 |
Figure 5: Digital Block Diagram |
Assembling and Testing of Hardware setup interfaced with LabVIEW is as shown in Figure.6 where as; Figure 7 represents the test set up for the power mode.
Data is stored in PC through the path specified in LabVIEW software and the result will be in the form of Excel. Real time data is stored continuously in personal computer to monitor the data accurately. This facilitates to monitorpost failures in any part in the Nuclear power plant.
The simulation set up results obtained for power mode and Reactor trip condition are presented in the next section.
Simulation Test Set Up Results
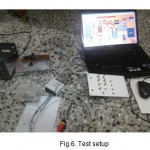 |
Figure 6: Test setup |
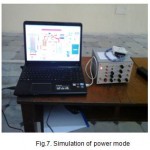 |
Figure 7: Simulation of power mode |
Figure 8 and Figure 9 represents the power mode simulation set up and response respectively.
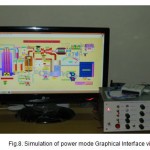 |
Figure 8: Simulation of power mode Graphical Interface view |
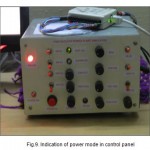 |
Figure 9: Indication of power mode in control panel |
The simulation of Reactor Trip condition diagram as shown in the Figure 10. In this simulation is same as power mode simulation, only the sea water level is reduces below 7m³/hr then this Reactor Trip condition will activate. Otherwise SCRAM will activate means immediately Reactor will trip. This indication is displayed in controller box.
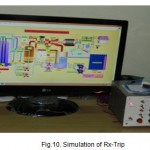 |
Figure 10: Simulation of Rx-Trip |
The Figure 11shows that the simulation Graph RPM versus Time. This waveform graph is represent RPM with respect to time and it is scaled maximum 3000 RPM.
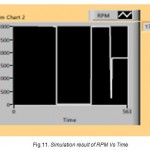 |
Figure 11: Simulation result of RPM Vs Time |
Figure 12 represents the analog input response of the system.
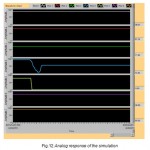 |
Figure 12: Analog response of the simulation |
Conclusion and Future Work
The proposed method, Nuclear Power Plant Simulator using Graphical Programming Language Software design was successfully completed. The USB 6009 NI Hardware interface wiring (Analog IO, and Digital IO) and NI-LabVIEW program communicated with LabVIEW environment Data Acquisition System also successfully completed.
In this work,the development of Nuclear Power Plant simulator with Real-Time Data logger of Plant Parameters in PC was done. The data acquisition of various plant parameteris stored in PC using NI DAQ module and LabVIEW software also successfully completed.Simulation of various postulated failures of equipment and their effect on the operation of the power plant was carried out.
The work is very useful for educational purposes as well as for training the personnel involved in Operation of Nuclear Power Plants.
This simulator ensures increase of the security and reliability of the system testing and equipment. Extending the program for the data logging system will improve the reliability of the system design and development of Nuclear Power Plant.
NI-USB 6009 Module having 20 IO lines (Analog, Digital input and output). In future work increase of more number of input output lines NI based USB module and made the simulator Lab. Simulation model provides a good understanding and better visual idea about the real-time performance, investigates complex operations and displays failure patterns in remote monitoring.
References
- Arun.P.R, ManojRadhakrishnan, Dr.AzhaPeriasamy, Dr. S.Muruganand India Monitoring of Fuel Supply in Power Plant Boilers using LabVIEW International Journal of Advanced Research in Electrical, Electronics and Instrumentation Engineering, Vol.3, Issue 9, September 2014.
- BinduPillai, DharaTrivedi, Vishal Mehta &Nilam Patel, “automation and virtual simulation of laboratory based mini thermal power plant”, International Journal of Mechanical and Production Engineering Research and Development, Vol. 3, Issue 4, pp.69-76, Oct 2013.
- Sinha.R.K., A. Kakodkar, Nuclear Engineering and Design 236 (2006) 683–700 Design and development of the AHWR—the Indian thorium fuelled innovative nuclear reactor Received 11 March 2004; received in revised form 26 September 2005; accepted 28 September 2005
- Samuel Glasstone& Alexander Sensonske“Nuclear Reactor Engineering”: Book
- www.ni.com.
- www.npcl.com.

This work is licensed under a Creative Commons Attribution 4.0 International License.


