

Manuscript accepted on :
Published online on: 11-01-2016
Impact of Global Warming on Groundwater Water Resources of Jordan
Alaeddin Tahboub
Department of Water Resources and Environmental Management, Faculty of Agricultural Technology, Al Balqa’ Applied University, Al-Salt 19117 Jordan
DOI : http://dx.doi.org/10.13005/bbra/1892

ABSTRACT: Global warming directly affects the temperature and rainfall average. There were many studies discussing global climate changes in the Middle East. These studies show the ranges of increase in temperature were between 1.8° and 6.4° by the end of the 21st century. The objectives of this study were to investigate the impact of global warming on groundwater resources in Jordan and to perform adaptation measures and management practices. Eighteen weather stations in Jordan were selected for the study. Accordingly, groundwater recharge was investigated under 16 different scenarios. In each of these scenarios temperature was raised by 2, 4 and 6 degrees and Precipitation was decreased by 10%, 20% and 30% interchangeably. The study concluded that the global climate change would have severe impact on available groundwater resources in Jordan. The predicted increase in temperature would cause increase in evapotranspiration as much as 9 % in the worst scenario. The increase of temperature alone of 2, 4, and 6 Co without any decrease in precipitation resulted in reduction of groundwater recharge by 21%, 37%, and 50% respectively. However, the reduction in precipitation by 10%, 20%, and 30%, would cause reduction of groundwater recharge of 25%, 48%, and 61% respectively.
KEYWORDS: Evaporation; Global warming; Groundwater recharge; Mediterranean region; Precipitation; Water resources
Download this article as:| Copy the following to cite this article: Tahboub A. Impact of Global Warming on Groundwater Water Resources of Jordan. Biosci Biotechnol Res Asia 2015;12(3) |
| Copy the following to cite this URL: Tahboub A. Impact of Global Warming on Groundwater Water Resources of Jordan. Biosci Biotechnol Res Asia 2015;12(3). Available from: https://www.biotech-asia.org/?p=3536> |
Introduction
Jordan (figure 1) with its area of 89190 km² has a population of approximately 6.4 million ANS (2011), with a 3.4% annual growth rate. Currently around 90% of the population lives in the northwest quadrant of the country. Altitude ranges from (-392m) at the surface of the Dead Sea to the (1754m) at Ram Mountain. Climate varies from sub humid Mediterranean in the north-west of the country with rainfall of about 630mm to desert conditions with less than 50 mm over a large area of the country.
Jordan is one of the 10 poorest countries worldwide in water resources. The available renewable water resources are dropping drastically to an annual per capita share of 130 m3 in 2005, compared to 3600 m3/cap/a in 1946. Factors prompting such a decrease include, steep population growth and sudden influx of refugees due to political instability in the region. Competition between demands on limited fresh water quantities is ever increasing. Irrigated agriculture is the largest consumer constituting around 64% of the overall uses compared to only 36 % for municipal, industrial and tourism purposes.
Drinking water is becoming challenging problem for the government of Jordan in the last 10 years, due to increasing demand, low rainfall, continuous dry years, and deterioration of water recourses according to high abstraction and over pumping (Salameh E, 2003). Jordan depends on different water resources in an attempt to meet the increasing demands. These resources can be mainly classified in two categories conventional and non-conventional. The conventional resources include surface and groundwater and the non-conventional includes treated wastewater and desalinated water. Groundwater resources in Jordan depend mainly on rainfall and it is the most important resource that can be tapped, varying in quantity and quality and at depths up to 1000m. Groundwater in Jordan is of two types, renewable and fossil, the fossil water making up 5% of the total storage (Abdulla et al., 2009). Surface-water sources include base flow and flood flow. The former is the water derived from groundwater drainage through springs, and it is estimated that the total average annual runoff is 686MCM (Al-Omari et al., 2009).
Water harvesting is common in the rural areas of Jordan where rainwater is collected from the roofs of houses and stored in concrete-lined wells. This can be expanded by building larger reservoirs to collect more water, and it was estimated that water harvesting should reach 6MCM per annum by the year 2000 (Al-Omari et al., 2009).
Several authors studied the effect of global warming on water resources. Fujihara et al. (2008) estimated that the average annual change in temperature over the coming eighty years in Seyhan River Basin, Turkey was ranged from +2.0 C to +2.7 C. The annual precipitation was decreased by a range of 157 mm (25%) to 182 mm (29%), evapotranspiration increased by 36 mm (9%) to 39 mm (10%) and the annual runoff decreased by 118 mm (52%) to 130 mm (61 %). Yu, et al. (2002) studied the impact of climate change on water resources of southern Taiwan, and found that, the surface runoff was increased during wet season and was declined during dry season. Tushiharu et al. (2008) investigated the impact of climate change on water resources of Nagara River in Japan, and found that the water and air temperatures will be increased in the future (2079-2100). The objectives of this study were to investigate the impact of global warming (increase in temperature and reduction in precipitation) on groundwater resources in Jordan and to perform adaption measures and management practices.
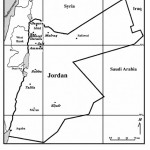 |
Figure 1: A map of Jordan shows major cities and areas and the region adjacent countries |
Materials and Methods
Climate in Jordan
Jordan climate is divided into four climatic regions. Climate data was obtained from 18 weather stations representing main geographical locations in Jordan. These stations are distributed spatially over all climatic zones prevailing in Jordan. The climatic zones are
- Semiarid region that represent the western desert, which covers about 75% of whole Jordan area. It extent along 300 Km from Al Mafraq in the north through Zarqa with Amman west (al Jizah) to Maan in the south with annual precipitation about 150 mm and maximum temperature about 25 °C and minimum temperature around 10 °C. This region is known as west Badia, and has different climate extremes, between day/night as well as summer/winter.
- Jordan Valley rift has a hot and dry climate with annual precipitation of 250mm in average and 18 °C average minimum temperature and 30 °C average maximum temperature.
- Mediterranean climate region, spread from Ajloun Mountains in the north through Al Balqa Mountains to Alsharaah Mountains in Tafilah heights. The temperature in this region is around 23 °C in summer and about 12 °C in winter. With annual precipitation around 450 mm.
- Costal climate that prevailing in Aqaba with precipitation less than 100 mm. With mean maximum temperature of 32 °C and minimum around 20 °C.
July and August are the hottest and driest months of the year, especially in Amman and the Jordan Valley, and in the desert areas, with temperatures over 97°F (36°C). Spring and autumn are the most pleasant times to visit with clear, sunny days and moderate temperatures. The winter months from November to April can be very cold, particularly in Amman, with snow, rain and wind, but there is little rainfall in the desert regions and in Aqaba, which makes a pleasant wintertime resort. About 75 percent of the country can be described as having a desert climate with very little annual rainfall.
Data Collection
In this study, climatic data were collected mainly from two sources; Web Site of Department of Meteorology and, annual report of Ministry of Water and Irrigation. These data represent mean monthly maximum, minimum and average temperature, relative humidity, cumulative monthly precipitation, and average monthly wind speed, dominant monthly wind direction for the period of 1976 to 2010 and the Northeast coordinate position for the 18 weather stations that was considered for the study.
Mean monthly evaporation was calculated by Wundt equation and Turc equation, and then averaged and summed to represent the average annual evaporation. A mass balance calculation was made to evaluate the groundwater recharge as
Water in – Water out = water storage
Precipitation – Evaporation – surface runoff = Groundwater Recharge
Surface runoff was ignored because its amount if estimated, as an annual surface runoff in mm will be very small compared to annual precipitation or annual evaporation. The annual flow of the River of Jordan and its surface runoff is coming from precipitation on Syrian territory.
Sixteen scenarios were considered by increasing average annual temperature by 0, 2, 4, and 6 degrees centigrade and by changing the average annual precipitation by 0, -10%, -20 %, and – 30 % . Results of the 16 scenarios and the 18 weather stations were plotted as three maps for each scenario (E for Evaporation, P for precipitation, and R for groundwater recharge)
Climate change in Jordan
Water resources in Jordan are scarce. Besides the rapid population growth, the impacts of climate change will further exacerbate the problem. Temperatures will increase and the total annual precipitation is likely to decrease, however with a fair share of uncertainty. (MOE, 2009). Hence, existing and new activities with the objective to minimize the gap between water supply and demand contribute to adapt Jordan to tomorrow’s climate. This might be accompanied by activities improving Jordan’s capacity to monitor and project meteorological and hydrological data and assess its own vulnerability to climate change. Adaptation to climate change in Jordan is not a priority issue among national policies.
There are severe environmental, economic, political and security implications of climate change impact on water resources and hydrology of wadi systems. According to recent modeling studies, the Arab region will face an increase of 2 to 5.5°C in the surface temperature by the end of the 21st century, (Al-Weshah and Abdallah,2012).This temperature increase will be coupled with a projected decrease in precipitation of between 0 and 20%. The results for the region include shorter winters, dryer and hotter summers, a higher rate of heat waves, increased weather variability, and a more frequent occurrence of extreme weather events. Clearly, adaptation and mitigation strategies need to be researched, discussed, and implemented. There is an obvious need for deep understanding of the climate change risks taking place in wadi systems located in arid and semi-arid regions. The situation in the Arab Region is even more critical and requires extreme attention from all levels of society.
The following figure (Figure 2) was constructed from the collected data which shows the change of average annual temperature over a period of 30 years in the city of Amman. An increase of about 1 degree centigrade was noticed.
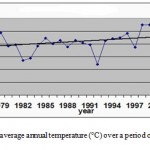 |
Figure 2: Change of average annual temperature (°C) over a period of 30 years in the city of Amman |
Many researchers have evaluated and analyzed the variability of annual rainfall and mean temperature in different parts of Jordan. In a study done by the Ministry of Water and Irrigation, (Al-Qaisi, B. 2010) in Amman-Zarqa basin (where more than 50 % of population live and more than 70 % of industrial activities prevails). The study aims to asses and analyze the annual average temperature records and the fluctuation of the annual precipitation for the period of 1940 to 2010 in the basin. Records showed that reduction of 12 % of precipitation was encountered during this period, this amount will reduce the groundwater recharge by 15% -20%. The study also revealed that the average temperature has been decreased. The following figure (figure 3) shows the rainfall trend in the station of Kitta (one of the meteorological stations in the basin).
Trend analysis of temperature and precipitation has also been studied by M. Beni-Domi, 2005 for 12 well distributed meteorological stations in Jordan or the period 1964-2000. The results showed that there is a warming trend and that there were negative rates of change in total annual rainfall for most of the stations with different magnitudes. The following figure (Figure 4) presents the average minimum temperature change in Amman Air Port station for the period 1920-2003.
Trend analysis rainfall and temperature also has been studied by Y. Shakhatreh, 2010 where three sites in Jordan (north, south, and middle) were extensively analyzed. Results showed that that average annual temperature was increased by an average range of 1 to 2.25 and the rainfall was decreased by an average range of 40 to 50 mm annually negative trend in total annual rainfall of about 50 mm and positive trend in mean maximum temperature of about 2 degrees centigrade during a period of 30 years (1976-2005).
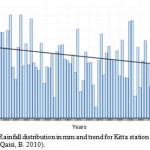 |
Figure 3: Annual Rainfall distribution in mm and trend for Kitta station in Amman-Zarqa Basin, Jordan (Al-Qaisi, B. 2010) |
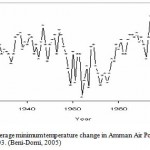 |
Figure 4: The average minimum temperature change in Amman Air Port station for the period 1920-2003. (Beni-Domi, 2005) |
Results and discussion
The amount and distribution of actual evaporation, precipitation and groundwater recharge were estimated and shown in Figure 5. Selected samples of the scenarios are shown in the following Figures (Figure 6 through figure 9). From the above Figures, it is obvious that the lowest amount of groundwater recharge was encountered under the areas of low precipitation and high evaporation (the desert area of the east and south of Jordan. And that the highest groundwater recharge was encountered in the north west of Jordan where the highest precipitation exists. Groundwater recharge was severely affected by the global warming scenarios, especially in the worst scenario where the groundwater recharge was reduced from 18 mm to 3.8 mm, which means about 1266 MCM of water. While in the most probable scenario, the reduction in groundwater recharge was from 18 mm to 14.6 mm, which means about 300 MCM of water. Groundwater is mainly used in Jordan for domestic water supply; this reduction in recharge will affect the supply for big cities like Amman and Zarqa where more than two thirds of the population of Jordan lives. This reduction of supply for domestic use will force the government of Jordan to look for more water reallocation projects to convey water to big cities like the ongoing project of conveying the Disi water to Amman from Disi basin in south of Jordan of about 350 Km with a cost of about 900 million Jordanian Dinars. Another water-conveying project was constructer in Jordan was the conveying of irrigation water from king Abdullah canal to supply the city of Amman with domestic water.
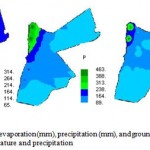 |
Figure 5:Annual evaporation (mm), precipitation (mm), and groundwater recharge (mm) for actual temperature and precipitation |
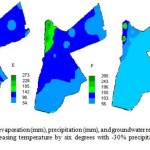 |
Figure 6: Annual evaporation (mm), precipitation (mm), and groundwater recharge (mm) according to increasing temperature by six degrees with -30% precipitations (worst scenario) |
 |
Figure 7: Annual evaporation (mm), precipitation (mm), and groundwater recharge (mm) according to increasing temperature by two degrees with -10% precipitations (the most probable scenario) |
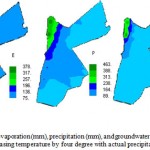 |
Figure 8: Annual evaporation (mm), precipitation (mm), and groundwater recharge (mm) according to increasing temperature by four degree with actual precipitation
|
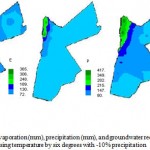 |
Figure 9: Annual evaporation (mm), precipitation (mm), and groundwater recharge (mm) according to increasing temperature by six degrees with -10% precipitation |
Scenarios discussion
The following two tables (Table 1 and Table 2) presents the effect of different scenarios of global warming on the average annual evaporation and the average annual groundwater recharge. It is clear that the simulated differences between values of annual evaporation for each scenarios was widely affected by increasing temperature, this increase in temperature cause a change in evaporation from 159.7 mm/year to 173.9 mm/year without any decrease in precipitation. This was about 8.88 % increase of the actual evaporation. We can see that the reduction in evaporation was less prominent in the scenarios of the decrease of precipitation by 10 %, 20 %, and 30 %, which was 7.22 %, 6.13 %, and 5.41 % respectively. For the most probable scenario, the increase of evaporation was estimated as 2.66 %. Also for the worst scenario was 5.41 %.
Table 1: Average annual evaporation in (mm) for all scenarios
| temperature
precipitation |
Recorded temperature | Recorded temperature+2 | Recorded temperature +4 | Recorded temperature +6 |
| Actual precipitation | 159.673 | 165.6124 | 170.158 | 173.8584 |
| Increasing in E % | 0.00 % | +3.72 % | +6.57 % | +8.88 % |
| Actual precipitation -10% | 148.1487 | 152.0957 | 155.6635 | 158.8412 |
| Increasing in E % | 0.00 % | +2.66 % | +5.07 % | +7.22 % |
| Actual precipitation -20% | 135.0214 | 138.13 | 140.8884 | 143.2942 |
| Increasing in E % | 0.00 % | +2.30 % | +4.35 % | +6.13 % |
| Actual precipitation -30% | 122.2498 | 124.7514 | 126.9539 | 128.859 |
| Increasing in E % | 0.00 % | +2.05 % | +3.85 % | +5.41 % |
Table 2: Predicted annual amount of groundwater recharge in (mm) and its response to increasing in temperature and reduction in precipitation for all scenarios
| temperature | Recorded | Recorded | Recorded | Recorded |
|
precipitation |
temperature | temperature+2 | temperature +4 | temperature +6 |
| No change in precipitation | 24.43581 | 19.21204 | 15.27574 | 12.10556 |
| Reduction in recharge (%) | 00.00 % | -21.38 % | -37.49 % | -50.46 % |
| Precipitation – 10% | 18.29389 | 14.78852 | 11.6313 | 8.82229 |
| Reduction in recharge (%) | -25.13 % | -39.48 % | -52.40 % | -63.90 % |
| Precipitation -20% | 12.6041 | 9.885498 | 7.472058 | 5.478401 |
| Reduction in recharge (%) | -48.42 % | -59.55 % | -69.42 % | -77.58 % |
| Precipitation -30% | 9.427753 | 4.995007 | 2.792498 | 0.887388 |
| Reduction in recharge (%) | -61.42 % | -79.56 % | -88.57 % | -96.37 % |
Natural groundwater recharge was estimated, as a depth in (mm) by comparing the annual evaporation with annual precipitation at the best condition the percent of groundwater recharge did not exceed 3% of total annual precipitation.
There was a sever reduction in groundwater recharge as a result of increasing in temperature and reduction in precipitation, from table 2 it is clear that the predicted decrease in groundwater recharge ranged from 21% ( for 2 degree increasing in temperature with no change in precipitation) and 96% ( for 6 degree increasing temperature with 30% reduction in precipitation).
Adaptation Measures
Adaptation to climatic change effects increase the request for national plans and reorganization to deals with new climatic condition and its socioeconomic effects, these national plans should be developed to coincide with water shortage and desertification problems. Adapting to climatic change could also employ local knowledge of population increase in the region and extreme immigration from neighboring countries. Adaptation plans and future initiatives should include:
- Sustainable management of water resources: improvement of water distributing systems, adopts high proficient irrigation systems and efficient irrigation schedules.
- Conservation practices for soil water management: conservation terraces, contour tillage in slope lands, employ protected planting method.
- Improve water use efficiency through construction of brackish water desalination project at household or for irrigation.
- Enlargement in water harvesting project and construct new project in order to increase artificial recharge of groundwater.
- Evaluating crop patterns and adopting new pattern to adapt with climatic variations.
- Regional cooperation on enhancing water supply and food safety issues.
- Improve local understanding about water scarcity and climatic change variation problems.
- Reuse of treated wastewater for irrigation and exchange it with the fresh water that is used for irrigation in Disi area.
- Conceder seawater desalination.
Conclusion
This study shows that the global climatic change will have severe effects on the available groundwater resources in Jordan. The expected increase in temperature will cause an increase of evaporation as much as 9% of the actual evaporation. The increase of temperature alone without any change in precipitation will result in reduction of groundwater recharge from 21% to 51%, therefore, temperature change could reduce water availability by up to 51%. However, possible change in precipitation will have much more severe effects on water availability than the effects of temperature change. 10, 20 and 30% reduction in precipitation will cause 25, 48 and 61% reduction in groundwater recharge respectively. If this effect was compared with 6 oC increasing in temperature, the reduction in groundwater recharge will reach 64, 78 and 96% respectively.
It also require more evaluation and analysis of prediction of possible consequences impact of climatic changes, it also require adopting of national plans to cope up with climatic changes. Possible solutions and adaptation is to consider seawater desalination and more regional water resources development and augmentation projects as the Dead Red project and the Med-Red project (Mediterranean Sea – Dead Sea project).
References
- Abdulla, F.A, Eshtawi T., and Assaf, H. (2009), Assessment of the impact of Potential Climate Change on the Water Balance of Semi-arid Watershed, Water Resources Management, 23: 2051-2068.
- Al-Omari A., Al-Quraan S. Al-Salihi A. and Abdulla F (2009), A Water Management Support System for Amman Zarqa Basin in Jordan, Water Resources Management, 23: 3165–3189.
- Al-Qaisi, B., (2010), Climate Change effects on Water Resources in Amman Zarqa Basin – Jordan”. Individual Project Report, Climate Change -Mitigation and Adaptation, Advanced International Training Programme in Norrkoping – Sweden October 25 – November 19, 2010.
- Al-Weshah, R. and Abdallah, F., (2012), Climate change risk management on hydrology of wadi systems in the Arab Region: Assessment, impact and trends, University of Jordan. Jordan.
- ANS, Annual Statistical Report, Department of Statistics, Amman, Jordan, 2011.
- Beni-Domi, M., (2005), Trend analysis of temperature and precipitation in Jordan. Aum Alqura University Journal of Education, Social Science, and Humanities. Vol. 17-No.1 Zol Hijja 1425 H, January 2005.
- MOE (Ministry of Environment, Jordan) (2009), Jordan’s Second National Communication to the United Nations Framework Convention on Climate Change (UNFCCC)p. 22, 116.
- Yu, Pao-Shan, Tau-Shang Yang, and chih-Kang. Wu,(2001), Impact of climate change on water resources in southern Taiwan, 2001, Journal of Hydrology, 260 pp. 161-175.
- Salameh, E. Proc., Symposium on Jordan’s Water Resources and Their Future Potential, Amman, Jordan, 2003, pp. 113–120.
- Shakhatreh, Yahya., (2010), Trend Analysis for Rainfall and Temperatures in Three Locations in Jordan, Proceedings of the international conference on food security and climate change, National Center for Agricultural Research and Extension (NCARE). Amman-Jordan.
- Toshiharu, kojiri., Toshio, Hamagushi, and Mariko Ode. (2008) , Assessment of global warming impacts on water resources and ecology of a river basin in Japan, Journal of Hydro-environment Research 1 164e175
- Fujihara, Y. , K. Tanaka, T. Watanabe, T. Nagano, T. Kojiri, (2008), Assessing the impacts of climate change on the water resources of the Seyhan River Basin in Turkey: Use of dynamically downscaled data for hydrologic simulations,
- Journal of Hydrology (2008) 353, 33– 48.

This work is licensed under a Creative Commons Attribution 4.0 International License.


