

Manuscript accepted on :
Published online on: 19-12-2015
Preethi Jampala, Preethi Murugan, Swathy Ramanujam and Kiran Babu Uppuluri*
Bioprospecting Laboratory, Department of Biotechnology, School of Chemical and Biotechnology, SASTRA University, Thanjavur-613401, Tamil Nadu, India
ABSTRACT: Lignocellulosic materials are abundant in nature but cannot be readily utilised as substrates for the fermentation due to their complexity. Breakdown of plant cell wall into easily utilisable substrates can be done by usage of enzymes like cellulases, xylanases and related enzymes. Cellulosome is a macromolecule which is a complex of such enzymes that act synergistically on lignocellulosic materials for complete degradation. Cellulosome have impressive applications in biotechnology as conversion of cellulosic biomass into simple sugars can be useful in the production of high – value products like organic acids and ethanol from inexpensive and renewable sources. Till date only some bacteria have shown the ability to produce cellulosomes. In present study, Trichoderma reesei NCIM 1186, cellulolytic fungi has been studied for its ability to produce cellulosome in Prosopis juliflora pods containing medium. In view of enhancing the cellulosome production, the effect of various carbon and nitrogen sources supplementation was studied using a statistical method, saturated Plackett – Burman (PB) design which is a modified version of PB. Seven carbon sources and eleven nitrogen sources were screened for their significant effect on the production of cellulosome. Out of tested carbon and nitrogen sources, maltose and ammonium hydrogen carbonate shown a significant effect on cellulase activity and maltose and ammonium sulphate shown a significant activity on xylanase activity of cellulosome.
KEYWORDS: Trichoderma reesei; Cellulosome; Saturated Plackett-Burman design; Prosopis juliflora
Download this article as:| Copy the following to cite this article: Jampala P, Murugan P, Ramanujam S, Uppuluri K. B. Investigation on the Effect of Carbon and Nitrogen Sources for the Production of Cellulosome by Trichoderma Reesei NCIM 1186 Using Saturated Placket Burman Design. Biosci Biotech Res Asia 2015;12(2) |
Introduction
Cellulosome concept was first established in Clostridium thermocellum system in 1983. In Cellulosome, cellulases, hemicellulases, pectinases, chitinases and other related enzymes are organised into a high molecular weight, cellulolytic complex. Cellulosome associated enzymes have a ‘dockerin’ domain in addition to catalytic domain. This domain is a 22 residue repeated sequence which relies on the scaffoldin cellulose binding domain (CBD) for effective binding to crystalline substrate. Scaffoldin domain also called CipA, consists of a single CBD and multiple cohesion domains. Scaffoldin is responsible for both cellulose binding via resident CBD and for the integration of enzyme sub-units into the cellulosome through the inter subunit cohesion-dockerin interaction. Lack of dockerin domain is the major difference between cellulosomal and noncellulosomal enzymes [1]. Many non Clostridium species are also found to produce cellulosome and a few of such organisms are listed under Table 1. Location of cellulosomes is in the protuberances of the outer most layer of the cell envelope, which forms a slimy, irregular coating [2-3]. Cellulosomes can also act on substrate independently by detaching from the cell membrane. Estimated size of the cellulosome ranges between 2 MDa and 6.5 MDa. Cellulosome is neither decomposed by high salt nor urea nor non ionic detergent. Under normal conditions SDS is also partially efficient unless it is heated indicating that cellulosomes are quite stable [2].
Table 1: List of micro organisms producing Cellulosome
| Anaerobic Bacteria | Aerobic Bacteria | Anaerobic Fungi |
| Clostridium thermocellum | Vibrio sp. | Neocallimastix |
| Clostridium cellulovorans | Piromyces | |
| Clostridium cellulolyticum | Orpinomyces | |
| Clostridium josui | ||
| Acetivibrio cellulolyticus | ||
| Bacteroides cellulosolvens | ||
| Ruminococcus albus | ||
| Ruminococcus flavefaciens |
Cellulose is the major component of plant cell wall and the most abundant polysaccharide available on the earth. Plant cell wall contains 15-40% cellulose, 30-40% hemicelluloses and pectin, and 20% lignin. Cellulose degradation is a significant part of the carbon cycle. It is insoluble and present as hydrogen bonded crystalline fibres which make it difficult to degrade [3]. Cellulases, major functional unit of cellulosomal structure are the family of glycoside hydrolases which can hydrolyze oligosaharides and polysaccharides like cellulose. Cellulases are modular enzymes consisting of domains/modules that are made up of structurally and functionally discrete units which fold independently. Depending on the similarities in the amino acid sequences in the catalytic domains, enzymes are classified further into families [1]. Cellulases have been classified as endoglucanases, cellobiohydrolases, and β-glucosidases [4-7]. Endoglucanases hydrolyze the amorphous regions of the fibrils, cellobiohydrolases are exoglucanases releasing cellobiose from the end of the chains, and β-glucosidases hydrolyze cellobiose and other cellodextrins with a low degree of polymerization [2].
Cellulases and xylanases are widely used in various industries including pulp and paper, textile, biofuel production, laundry, food and feed industry, brewing and agriculture. In view of its commercial importance in wide variety of industries, its production in large amount is needed. Conventional way of enzyme production using synthetic medium is a costly process because of the carbon source used as substrate [8]. To cut down the cost of enzyme production, agricultural or lignocellulosic waste can be used [9-10]. Disposal of lignocellulosic waste is a big problem to the environment. Micro organisms are able to breakdown these wastes and grow on them, this ability can be exploited to produce some metabolites in large amounts. Also, lignocellulosic wastes are rich in sugars so they can serve as potential substrates for fermentation purposes.
Prosopis juliflora is a thorny shrub, widely spread over semi arid regions of the world. It is cheaply and extensively available throughout the year making it a good choice for fermentation [11]. Pods of this shrub contain good amounts of cellulose that can act as a carbon source for enzyme production. Composition of this P. juliflora pods is already studied elsewhere [12]. Trichoderma reesei is a cellulolytic fungus that is proved as an efficient producer of cellulase enzyme on a wide variety of substrates [5-6, 9, 13-18]. Many cellulosic materials such as wheat bran, wood, fruit pomace, bagasse, wheat straw, wastepaper, corncob, aspen wood, waste newsprint, and waste paper sludge have been studied as potential substrates for production of cellulase and xylanase by Trichoderma reesei [8, 10, 14]. T. reesei is a prototrophic eukaryote having filamentous morphology and ability to decay waste organic source [6].
Optimization of medium composition is one of the essential steps in order to minimize the amount of unutilized components, so that cost-effective yield can be obtained in commercial productions [19-21]. Conventional one factor at a time methodology involves numerous experiments, consuming lot of raw materials and manpower. In contrast statistically planned experiments develop a specific design which effectively reduce the number of experiments and minimizes the error in determining the values for significant parameters [22-23]. Compared to the common ‘‘one-factor-at-a-time’’ method statistical methods proved to be powerful and useful tools [24]. Plackett – Burman design (PBD), developed by R.L. Plackett and J.P. Burman in 1946 is a popular design used for screening. It was designed to improve the quality control process that could be used to study the effects of design parameters on the system state so that intelligent decisions can be made. A number ‘n’ of factors can be screened in an ‘n + 1’ run PB design. A characteristic feature is that the sample size is a multiple of four rather than a power of two (4k observations with k = 1, 2 …n). In some cases, during the analysis of the results no degrees of freedom are left to estimate the error variability so one may not get the standardized effects and other ANOVA factors like F and p –values. Such designs are known as saturated PB designs. The main advantage of saturated designs is the minimum number of observations needed to calculate an effect for a certain factor. A selection of two-level PB designs is equal to the saturated fractional factorial designs [25]. Saturated PB analysis will give the information not only about the significant variables but also the level they should be modified further to enhance yield.
Ability of T. reesei to grow on novel substrate Prosopis juliflora and produce cellulosome (cellulase and xylanase) was studied here for the first time. No fungal species was reported to synthesize cellulosome till date. Fungal cellulosome production is going to be an area of extensive research in the coming years as the amount of extra – cellular enzyme production is more from fungal species than bacteria. Once cellulosome production was confirmed, screening of different carbon and nitrogen compounds was done to identify significant sources to supplement the production medium in order to improve yield of cellulosomal enzymes.
Materials and Methods
Microorganism
Trichoderma reesei (NCIM 1186) was procured from the National Collection of Industrial Microorganisms (NCIM), National Chemical Laboratory, Pune, India. The organism was cultured and stored on Potato dextrose agar (PDA) (HiMedia, India) plates at 4°C and was sub cultured at regular intervals. Glycerol stocks of 80% were prepared and stored at -20°C for future use. Sporulation inoculum was prepared by adding two loops full of spores from PDA plates into sabouraud dextrose broth and incubated at 30°C in shaker for three days and stationary for next three days. Sporulation occurs and this was used as inoculum for all the systems. Inoculum size of 2ml containing 2 x 10⁴ spores/mL was used.
Substrate
Prosopis juliflora tree pods were collected from area surrounding SASTRA University campus, Thanjavur, Tamil Nadu, India. Pods were dried in sunlight and were washed under tap water to remove dust present on them. Later dried pods were powdered in grinder and sieved through mesh of size #40. All the particles less than #40 (0.420mm) were used for preparing media.
Production Media
Composition of the medium for the production of cellulosome is as follows: Pods powder 40 g/L, lactose 5.0 g/L, KH₂PO₄ 10.0 g/L, (NH₄)₂SO₄ 7.0 g/L, MgSO₄ 0.3 g/L, CaCl₂ 1.5 g/L, FeSO₄ 5 mg/L, MnSO₄ 1.56 mg/L, CoCl₂ 3.66 mg/L, urea 1.5 g/L, peptone 0.1 g/L and tween 80 0.1mL/L. pH of the medium was adjusted to 6.5 prior to autoclave using 1 N NaOH. Sterilization was done at 121°C for 15mins. All the chemicals were procured from Sigma (USA), HiMedia (India) and Merck (Germany).
Culture Conditions
Sterilized medium was then inoculated with already produced T. reesei spores and incubated at 30°C for 120 hours in a shaker at 150rpm. After incubation time, fermented broth was centrifuged at 10,000 rpm at 4°C for 10 minutes and supernatant collected was assayed for cellulosome activity.
Cellulosome Assay
Collected supernatant was then assayed for cellulosome activity by measuring the amount of reducing sugars using dinitrosalicylic test as described by Ghose et al [26] and Bailey et al [27]. For that test, 0.5mL of culture supernatant was added to 1 mL of 0.05M citrate buffer of pH 4.8. To this mixture, 0.5 mL of 1% carboxy methyl cellulose (CMC) was added as substrate for cellulase enzyme assay and 0.5 mL of 1% Beech wood xylan was added as substrate for xylanse enzyme assay. All the samples were incubated at 50°C for 30 minutes. To this 2 mL of dinitrosalicylic acid (DNS) was added and then heated in water bath at 90°C for 10 minutes and cooled immediately. Development of colour was visible and the absorbance was measured in spectrophotometer at 540nm. Reducing sugar concentration was determined by using glucose standard for cellulase activity and xylose standard for xylanase activity. One IU of activity was expressed as the amount of enzyme required to release 1 µmole of product/min under assay conditions.
Plackett – Burman optimization of carbon and nitrogen sources
PB design was used to screen for the significant supplementary carbon and nitrogen sources that have effect on cellulosome production. This design assumes that there are no interactions between the different media constituents, xi, in the range of variables under consideration. A linear approach is considered to be sufficient for screening.
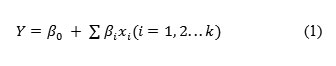
Where:
Y – Response (productivity),
β0– Model intercept,
β1– Variable estimates.
The PB design is a fractional factorial design and the main effect of such a design may be simply calculated as the difference between the average of measurements made at the high level (+1) of the factor and the average of measurements made at the low level (-1). The P-value is the probability that the magnitude of a contrast coefficient is due to random process variability. A low P-value indicates a ‘‘real’’ or significant effect. The significance of each variable was determined by applying the Student’s t-test [4].
For determining significant carbon and nitrogen sources on the production of cellulosome, the effect of chosen sources were studied in 2 levels (-1, +1). Seven carbon sources chosen were glucose, fructose, xylose, sucrose, maltose, carboxyl methyl cellulose (CMC) and lactose and the effect was studied in eight trails as per the PB design showed in Table 2. Eleven nitrogen sources Peptone, urea, yeast extract, meat peptone, ammonium sulphate, ammonium chloride, ammonium per sulphate, potassium nitrate, sodium Nitrite, ammonium hydrogen carbonate and casein were screened in 12 experiments for significant Nitrogen source. Design for screening Nitrogen sources was tabulated under Table 3.
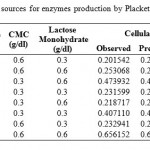 |
Table 2: Design for screening significant Carbon sources for enzymes production by Plackett – Burman Design |
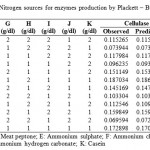 |
Table 3: Design for screening significant Nitrogen sources for enzymes production by Plackett – Burman Design |
Results and Discussion
Prosopis juliflora as a substrate for the production of cellulosome
P. juliflora pods found to be suitable for both the growth of T. reesei and cellulosome production. Preliminary studies were performed to study the optimum values for the production of cellulosome. Pods concentration, 4%; pH, 6.5; temperature, 30oC; time, 120h and agitation, 150 rpm were found to be optimal for the maximum production (data not shown). Hence, these conditions along with other medium supplements were used for the production of cellulosome in this study. After 120h of incubation the medium was subjected for centrifugation and the resultant supernatant was used to determine the cellulosome activity.
Cellulosome Confirmation
When culture supernatants were tested with different substrates like CMC and xylan, activity of both cellulase and xylanase enzymes were detected by the release of reducing sugars estimated by DNS test. Simultaneous cellulase and xylanase activities confirmed the production of cellulosome [28].
Screening of Carbon and Nitrogen Sources by Plackett – Burman Design
Different carbon sources selected, designed data in real values and their respective observed and predicted values of cellulase and xylanase enzyme activities were tabulated under Table 2. From the experimental analysis, Trail run 8 showed highest (0.656 IU/ml) and trial run 1 showed least (0.202 IU/ml) cellulase enzyme activities. Analysis of PB design was done by using STATISTICA 8 Evolution software.
In Pareto chart (Fig.1), sources are ranked according to the order of significance where maltose and lactose showed significant effect on the Cellulase enzyme production. Main effect estimates are represented as horizontal axis in the Pareto chart. Vertical line in standardized effects chart indicates the statistical significance (P=0.05) line. All the variables that cross the vertical line are said to be significant and vice – versa. Previous reports showed that cellulose, lactose and sophorose are best inducers of cellulolytic enzymes from Trichoderma reesei [16, 29-30] and our result support the same.
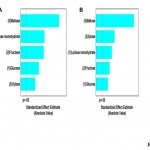 |
Figure 1: Pareto chart of effects for Cellulase and Xylanase Activity from Carbon sources |
When statistical analysis for Analysis of variance (ANOVA) was done on the experimental data, F-value, t-value and p-value values were not obtained as there were no degrees of freedom available for calculating the error. This is the characteristic feature of Saturated PB [23].When least significant two carbon sources (here sucrose and CMC) obtained from initial Pareto chart before standardizing (not shown) were ignored, we got values of standardized effects, t and p values given under Table 4 with R2 value of 0.99757. Values of coefficient can be either positive or negative. High coefficient value indicates that the analyzed factor has a major impact on production titer. Whereas a coefficient value close to zero suggests a little or no impact. From Table 4, we can observe that all the carbon sources have high coefficient values indicating that they have good impact on cellulase production. The sign of the effect indicates the level at which the variable should be considered for further improvement. For instance, a negative sign in front of a variable means the compound gives the best yield at the low level and experiments should be carried out using further decreased concentration of the compound [23]. In this case, all the effects are positive indicating that increased levels of carbon can be used for improving production.
Table 4: Effect estimates for Cellulase production on different Carbon sources
| Coeff. | Effect | Std.Err. | t | p | |
| Mean/Interc. | 0.334383 | 0.334383 | 0.005331 | 62.72036 | 0.000254 |
| (1)Glucose | 0.052600 | 0.105199 | 0.010663 | 9.86612 | 0.010118 |
| (2)Fructose | 0.064273 | 0.128547 | 0.010663 | 12.05580 | 0.006810 |
| (3)Xylose | 0.044347 | 0.088695 | 0.010663 | 8.31825 | 0.014146 |
| (5)Maltose | 0.100301 | 0.200603 | 0.010663 | 18.81359 | 0.002813 |
| (7)Lactose monohydrate | 0.066085 | 0.132170 | 0.010663 | 12.39558 | 0.006445 |
In case of xylanase activity, Trial run 8 showed high (0.738 IU/ml) and trail run 1 showed low (0.209 IU/ml) activities. When looked into Pareto chart (Fig: 1) for xylanase production, maltose and xylose are highly significant compared to all other carbon sources screened. CMC and sucrose showed little or no significance on xylanase production. To calculate regression coefficients and t-values, experimental data was subjected to statistical analysis after pooling least two carbon sources (here CMC and sucrose) into error. Corresponding p-value, t-value and coefficients are listed under Table 5. Xylose showed potent induction of xylanase enzyme in accordance with literature. P-values of almost all screened carbon sources except sucrose and CMC are less than 0.05 showing that it is a significant carbon source for xylanase production. All the carbon sources have positive sign in their coefficient values indicating that increased amounts can improve Xylanase yield. Statistical analysis was done with R2 value of 0.98956 which indicates good fit.
Table 5: Effect estimates for Xylanase production on different Carbon sources
| Coeff. | Effect | Std.Err. | t | p | |
| Mean/Interc. | 0.372094 | 0.372094 | 0.012124 | 30.69118 | 0.001060 |
| (1)Glucose | 0.061332 | 0.122664 | 0.024248 | 5.05882 | 0.036924 |
| (2)Fructose | 0.064007 | 0.128013 | 0.024248 | 5.27941 | 0.034056 |
| (3)Xylose | 0.071673 | 0.143346 | 0.024248 | 5.91176 | 0.027441 |
| (5)Maltose | 0.101804 | 0.203609 | 0.024248 | 8.39706 | 0.013888 |
| (7)Lactose monohydrate | 0.067216 | 0.134432 | 0.024248 | 5.54412 | 0.031028 |
For screening of nitrogen containing compounds in order to find the significant source; the effect of Peptone, urea, yeast extract, meat peptone, ammonium sulphate, ammonium chloride, ammonium per sulphate, potassium nitrate, sodium nitrate, ammonium hydrogen carbonate and casein on the cellulosome production were compared at two levels (i.e., low – 1 g/dl, high – 2g/dl) as shown in Table 3 along with observed and predicted values. Cellulase production was highest in trial run 6 (0.187 IU/ml) and lowest in trail run 11 (0.069 IU/ml).
From Fig 2 Pareto chart of effects, ammonium hydrogen carbonate and potassium nitrate showed significance followed by casein, ammonium sulphate and meat peptone. Ammonium per sulphate and urea showed least significance on cellulase enzyme production. From Table 6, Meat peptone, potassium nitrate, ammonium hydrogen carbonate and casein are shown to have negative influence indicating decreased levels of these compounds will increase cellulase production. On the other hand, ammonium sulphate has positive influence on cellulase production. Degrees of freedom, coefficient and standard error were obtained with R2 value of 0.99736 indicating best fit.
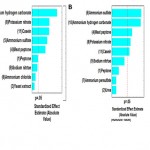 |
Figure 2: Pareto chart of effects for Cellulase and Xylanase Activity from Nitrogen sources |
Table 6: Effect estimates for Cellulase production on different Nitrogen sources
| Effect | Std.Err. | t | p | Coeff. | |
| Mean/Interc. | 0.125414 | 0.001315 | 95.3916 | 0.000110 | 0.125414 |
| (1)Peptone | 0.010330 | 0.002629 | 3.9287 | 0.059104 | 0.005165 |
| (3)Yeast extract | 0.004168 | 0.002629 | 1.5853 | 0.253781 | 0.002084 |
| (4)Meat peptone | -0.023379 | 0.002629 | -8.8913 | 0.012414 | -0.011690 |
| (5)Ammonium sulphate | 0.026460 | 0.002629 | 10.0630 | 0.009731 | 0.013230 |
| (6)Ammonium chloride | 0.005981 | 0.002629 | 2.2745 | 0.150770 | 0.002990 |
| (8)Potassium nitrate | -0.030266 | 0.002629 | -11.5104 | 0.007463 | -0.015133 |
| (9)Sodium nitrate | -0.009243 | 0.002629 | -3.5152 | 0.072267 | -0.004621 |
| (10)Ammonium hydrogen carbonate | -0.043859 | 0.002629 | -16.6797 | 0.003575 | -0.021929 |
| (11)Casein | -0.029904 | 0.002629 | -11.3726 | 0.007643 | -0.014952 |
Xylanase enzyme production was highest in Trail run 6 (0.08 IU/ml) and lowest in Trail run 2 (0.032 IU/ml) as tabulated in Table 3. Analysis from Pareto chart of effects Fig 2 showed that ammonium sulphate, ammonium hydrogen carbonate, meat peptone, potassium nitrate and casein were significant sources whereas yeast extract and ammonium chloride were least significant. Table 7 shows that all the screened nitrogen sources have a negative effect on xylanase production indicating that decreased levels of nitrogen is suitable condition for enzyme production. Analysis was obtained with R2 value of 0. 99151.
Table 7: Effect estimates for xylanase production on different Nitrogen sources
| Effect | Std.Err. | t | p | Coeff. | |
| Mean/Interc. | 0.054766 | 0.000943 | 58.06635 | 0.000296 | 0.054766 |
| (1)Peptone | 0.003629 | 0.001886 | 1.92367 | 0.194299 | 0.001814 |
| (2)Urea | -0.002285 | 0.001886 | -1.21120 | 0.349513 | -0.001142 |
| (4)Meat peptone | -0.010617 | 0.001886 | -5.62852 | 0.030145 | -0.005309 |
| (5)Ammonium sulphate | 0.015455 | 0.001886 | 8.19341 | 0.014571 | 0.007728 |
| (7)Ammonium per sulphate | -0.002285 | 0.001886 | -1.21120 | 0.349513 | -0.001142 |
| (8)Potassium nitrate | -0.009811 | 0.001886 | -5.20103 | 0.035036 | -0.004905 |
| (9)Sodium nitrate | -0.006585 | 0.001886 | -3.49111 | 0.073159 | -0.003293 |
| (10)Ammonium hydrogen carbonate | -0.015187 | 0.001886 | -8.05092 | 0.015080 | -0.007593 |
| (11)Casein | -0.009273 | 0.001886 | -4.91605 | 0.038975 | -0.004637 |
Overall, nitrogen sources had more impact on cellulase and xylanase production in negative way leading to an assumption that they may play a role in regulation of synthesis of cellulosomal enzymes. Decreased levels of nitrogen and increased levels of carbon sources would be beneficial for enhanced cellulosome production.
Conclusion
Prosopis juliflora supported the growth of Trichoderma reesei NCIM 1186 along with synthesis of both Cellulase and Xylanase. Production of cellulosome was confirmed as the culture supernatant showed both CMCase and xylanase activities. As Trichoderma reesei is showing the ability of producing cellulosome, this trait can be exploited further to increase the yields by optimizing the culture conditions. This result is encouraging and it can lead to more studies on fungal cellulosome production as fungal species are efficient extra – cellular enzyme producers. As initial step, impact of various carbon and nitrogen sources and their concentrations on production of cellulase and xylanase enzymes was studied using saturated PB design. Upon screening various carbon sources, maltose showed to be highly significant for both cellulase and xylanase production. Among nitrogen sources, ammonium hydrogen carbonate for cellulase and ammonium sulphate for xylanase were significant. Further, cellulase and xylanase production can be enhanced by increasing carbon and decreasing nitrogen levels during optimization studies.
Acknowledgements
This work was supported by the grant (SB/FTP/ETA-212/2012) by SERB, Department of science and technology, India.
References
- Bayer, E.A., et al., Cellulose, cellulases and cellulosomes. Current opinion in structural biology, 1998. 8(5): p. 548-557.
- Bégum, P. and M. Lemaire, The cellulosome: an exocellular, multiprotein complex specialized in cellulose degradation. Critical reviews in biochemistry and molecular biology, 1996. 31(3): p. 201-236.
- Gal, L., et al., Characterization of the cellulolytic complex (cellulosome) produced by Clostridium cellulolyticum. Applied and environmental microbiology, 1997. 63(3): p. 903-909.
- Sreeja, S., et al., Optimization of cellulase production by Bacillus altitudinis APS MSU and Bacillus licheniformis APS2 MSU, gut isolates of fish Etroplus suratensis. 2013.
- Sukumaran, R.K., R.R. Singhania, and A. Pandey, Microbial cellulases-production, applications and challenges. Journal of Scientific and Industrial Research, 2005. 64(11): p. 832.
- Esterbauer, H., et al., Production of< i> Trichoderma</i> cellulase in laboratory and pilot scale. Bioresource Technology, 1991. 36(1): p. 51-65.
- Tangnu, S.K., H.W. Blanch, and C.R. Wilke, Enhanced production of cellulase, hemicellulase, and β‐glucosidase by Trichoderma reesei (Rut C‐30). Biotechnology and Bioengineering, 1981. 23(8): p. 1837-1849.
- Reczey, K., et al., Cellulase production by< i> T. reesei</i>. Bioresource Technology, 1996. 57(1): p. 25-30.
- Manivannan, A. and R. Narendhirakannan, Response surface optimization for co-production of cellulase and xylanase enzymes by Trichoderma reesei NRRL–3652. International Journal of ChemTech Research, 2014. 6(7).
- Liming, X. and S. Xueliang, High-yield cellulase production by< i> Trichoderma reesei</i> ZU-02 on corn cob residue. Bioresource Technology, 2004. 91(3): p. 259-262.
- Gupta, R., K.K. Sharma, and R.C. Kuhad, Separate hydrolysis and fermentation (SHF) of< i> Prosopis juliflora</i>, a woody substrate, for the production of cellulosic ethanol by< i> Saccharomyces cerevisiae</i> and< i> Pichia stipitis</i>-NCIM 3498. Bioresource Technology, 2009. 100(3): p. 1214-1220.
- Ramasamy, S., et al., Production and Statistical Optimization of Oxytetracycline from Streptomyces rimosus NCIM 2213 using a New Cellulosic Substrate, Prosopis juliflora. Bioresources, 2014. 9(4): p. 7209-7221.
- Saravanan, P., R. Muthuvelayudham, and T. Viruthagiri, Enhanced production of cellulase from pineapple waste by response surface methodology. Journal of Engineering, 2012. 2013.
- Wen, Z., W. Liao, and S. Chen, Production of cellulase by< i> Trichoderma reesei</i> from dairy manure. Bioresource Technology, 2005. 96(4): p. 491-499.
- Olsson, L., et al., Influence of the carbon source on production of cellulases, hemicellulases and pectinases by< i> Trichoderma reesei</i> Rut C-30. Enzyme and Microbial Technology, 2003. 33(5): p. 612-619.
- Ahamed, A. and P. Vermette, Culture-based strategies to enhance cellulase enzyme production from< i> Trichoderma reesei</i> RUT-C30 in bioreactor culture conditions. Biochemical Engineering Journal, 2008. 40(3): p. 399-407.
- Ahamed, A. and P. Vermette, Effect of mechanical agitation on the production of cellulases by< i> Trichoderma reesei</i> RUT-C30 in a draft-tube airlift bioreactor. Biochemical Engineering Journal, 2010. 49(3): p. 379-387.
- Domingues, F., et al., The influence of culture conditions on mycelial structure and cellulase production by< i> Trichoderma reesei</i> Rut C-30. Enzyme and Microbial Technology, 2000. 26(5): p. 394-401.
- Xia, L. and P. Cen, Cellulase production by solid state fermentation on lignocellulosic waste from the xylose industry. Process Biochemistry, 1999. 34(9): p. 909-912.
- Reddy, L., et al., Optimization of alkaline protease production by batch culture of Bacillus sp. RKY3 through Plackett–Burman and response surface methodological approaches. Bioresource Technology, 2008. 99(7): p. 2242-2249.
- Ghanem, N.B., H.H. Yusef, and H.K. Mahrouse, Production of Aspergillus terreus xylanase in solid-state cultures: application of the Plackett–Burman experimental design to evaluate nutritional requirements. Bioresource Technology, 2000. 73(2): p. 113-121.
- Lakshmi, G.S., et al., Enhanced production of xylanase by a newly isolated< i> Aspergillus terreus</i> under solid state fermentation using palm industrial waste: A statistical optimization. Biochemical Engineering Journal, 2009. 48(1): p. 51-57.
- Hymavathi, M., et al., Impact of carbon and nitrogen sources on L-asparaginase production by isolated Bacillus circulans (MTCC 8574): Application of saturated Plackett-Burman design. Chemical and Biochemical Engineering Quarterly, 2010. 24(4): p. 473-480.
- Levin, L., F. Forchiassin, and A. Viale, Ligninolytic enzyme production and dye decolorization by Trametes trogii: application of the Plackett–Burman experimental design to evaluate nutritional requirements. Process Biochemistry, 2005. 40(3): p. 1381-1387.
- Vanaja, K. and R. Shobha Rani, Design of experiments: concept and applications of Plackett Burman design. Clinical research and regulatory affairs, 2007. 24(1): p. 1-23.
- Ghose, T., Measurement of cellulase activities. Pure and applied Chemistry, 1987. 59(2): p. 257-268.
- Bailey, M.J., P. Biely, and K. Poutanen, Interlaboratory testing of methods for assay of xylanase activity. Journal of biotechnology, 1992. 23(3): p. 257-270.
- Waeonukul, R., et al., Effect of carbon sources on the induction of xylanolytic-cellulolytic multienzyme complexes in Paenibacillus curdlanolyticus strain B-6. Bioscience, biotechnology, and biochemistry, 2008. 72(2): p. 321-328.
- Morikawa, Y., et al., Cellulase induction by lactose in Trichoderma reesei PC-3-7. Applied Microbiology and Biotechnology, 1995. 44(1-2): p. 106-111.
- Haltrich, D., et al., Production of fungal xylanases. Bioresource Technology, 1996. 58(2): p. 137-161.

This work is licensed under a Creative Commons Attribution 4.0 International License.


