

Manuscript accepted on :
Published online on: 25-12-2015
Development of Modern Technological Process for Vehicle Parts on-Condition Centralized Repair
Victor Vadimovich Poptsov, Valentin Nikolaevich Krasovsky and Vladislav Alekseevich Korchagin
Tyumen State Oil and Gas University Russian Federation, 625000, Tyumen, Volodarsky str., 38
ABSTRACT: The purpose of the research is to improve the efficiency of vehicle units’ centralized repair on technical conditions. The application of flexible production processes in terms of small-scale production is described. The possibility of application of the multi-dimensional taxonomy for the optimization problem resolution for technological processes of vehicle units’ repair has been studied. The results of experimental studies are presented. The optimizing technique for the number of repairs is developed. The possible economic impact of the implementation of the methodology is calculated.
KEYWORDS: repair on technical conditions; cluster analysis; multi-dimensional taxonomy; repairs; pre-repair diagnosis
Download this article as:| Copy the following to cite this article: Poptsov V. V, Krasovsky V. N, Korchagin V. A. Development of Modern Technological Process for Vehicle Parts on-Condition Centralized Repair. Biosci Biotech Res Asia 2015;12(2) |
Introduction
Efficiency analysis of the transport equipment repair in centralized specialized productions leads to the conclusion that the main areas where production complies with products is the use of advanced information technology, the core of which is open engineering and monitoring computer systems with modern standard and original software [1, 2, 3]. The information source about the technical condition of products is diagnosis.
The centralized repair according to the technical condition (CRTC) [1, 4, 5] contributes to the fullest use of the components and interfaces resource and, ultimately, improvement of the use efficiency of the automobile and oil and gas equipment in general, this repair is based on the principles of the Route Repair Technologies developed by K.T. Koshkin [6].
Therefore, it should be noted that the relevance of research to the development of scientific and practical recommendations for the formation of highly flexible enterprise management technologies for the transport equipment repair is quite great.
Scheduled preventative system used in Russia and some other countries for the transport equipment maintenance and repair, which is based on a set of standards that define the frequency and scope of activities of maintenance and repair, and their correction factors is constantly improved depending on the impact of road, natural climatic and other factors [7, 8].
Centralization of the transport equipment repair on technical condition tends to raise the repair efficiency due to the use of progressive typical technological processes of the vehicle parts’ disassembly and assembly [5, 9].
Technological process of the CRTC is based on the principles of serial production and is characterized by wide use of standard processes. Its essence lies in the fact that each part as a result of pre-repair diagnostics, which can be carried out before sending it in for repair (before withdrawing from the chassis), or when its acceptance in the repair (test bench) is assigned with one of the developed in advance technological routes of the typical technological repair process [10, 11]. In aggregates sent to one technological route, all the defects are eliminated according to the route, regardless of the presence of a defect on a particular part [11].
However, even the introduction of a multi-stage system of determining the technical condition and adjustment of the volume and range of repairs does not allow making efficient use of the advantages of the CRTC organizational structure for several reasons, which include the following [12]:
- The multi-variable nature of statistical information required for the formation of the CRTC technological system.
- The lack of the necessary flexibility in the formation of the CRTC technological processes depending on the technical state of the repair object, even in the presence of fixed statistics.
- The lack of software products for the continuous monitoring of the technical condition of repaired items using the CRTS system.
- The lack of teaching materials on the use of existing methods and means of technical diagnostics.
- Low level of training of qualified personnel diagnosticians for enterprises performing the CRTC of the vehicle units.
Steady upward trend in the share of imported transport equipment at the enterprises of the West Siberian oil and gas industry fleet, increase of the rolling stock models, a steady decline in the volume of capital repair of units and systems requires a revision of the mechanism of formation processes of repair and application of advanced information technologies.
Thus, if the reasons 4 and 5 are purely technological, the reasons 1-3 should involve more advanced techniques than previously used probabilistic approach [11]. One such method is the unit of multidimensional classification, cluster analysis based on the clustering of repaired units’ feature space, followed by determining of volume and range of repair actions for this repaired unit.
Technology flexibility of disassembly and assembly work implementation using the CRTC can be achieved subject to the development of methods of their formation, based on the original software that allows you to instantly process the incoming information about the technical condition of each object during its operation and develop technology to eliminate defects immediately upon receipt of units by the CRTC [12].
To ensure the flexibility of the formation and composition process of the CRTC technological routes, the information can be used obtained in pre-repair diagnostics of the received repair units.
To ensure adaptability of the CRTC processes to the repair technical condition, the information can be used obtained in pre-repair diagnostics of the received repair units.
At the same time, we put forward a working speculation, which consists in the fact that all possible state space (technical condition estimation parameter) of the product is divided into a finite set of classes (clusters, taxones) that are compact and have clear grouping centers (gravity centers).
Methods
General
Objects to be classified are the state parameters (SP), presented in a space the dimensions of which are its features. This feature space (F-space) is a formal k-dimensional (for F-features), but due to the correlation between the features of the SP, it usually can be converted into a lower-dimensional space with little information loss.
Comparative study of objects in the F-space in various works convinces us quickly that only under unusual circumstances, objects are grouped in compact areas with full featured hyperspace. State parameters of the cluster can be divided across the range of values of some features.
Various SP will deviate from the cluster along different feature axes. This means that the object classes can be identified without reference to homogeneity of the objects on all axes, or even for any given axis. Most of the characteristics of some SP should be similar to all the other units’ characteristics of its cluster; there is no need of the similarity of all features. Belonging to a class is defined by “majority vote” (the largest number of common values), and none of the symptoms defines belonging to a given class or taxon. The relationship of this kind has been found empirically by researchers studying natural classification in various disciplines; it was formulated as a principle of classification [13]. Classes defined in this way are called polythetic. Most methods using cluster analysis and classification are aimed at obtaining polythetic classes. In contrasting systems (with monothetical classes or taxones), the belonging is determined by the general values of all or at least some of the features. This makes monothetic classification useful for constructing taxonomic keys, but generated systematization of natural objects is often unsatisfactory.
Introduction of the polythetic classification has important implications. Belonging to the taxonomical class is a function of the SP distribution in F-space. This function is not a “Belongs Vs. Not belongs” two-digit type, as in the monothetic classification, so the belonging is described by the values which form a continuum. Using polythetic classification, the taxonomic structuring becomes rather statistical than a purely geometrical task [14].
From the above it can be concluded that the calculated polythetic classification requires a large number of features for proper objects grouping. Classifications of this kind are often called natural. Their SP should be similar to each other than the other taxones’ SP. Classifications based on a large variety of features will be useful everywhere, while the classification based on only a few features would be less useful. For the general classification among objects and phenomena, the natural classification is preferred [13].
Speaking of the classification of a set of objects (SP), we mean that each of them is set in corresponding matrix {X} column. Similarly, the initial information is interpreted in the task of classifying a set of features; the only difference is that each of the features is given by the corresponding matrix {X} line.
In the general formulation, the problem of classifying objects is that the entire set of objects analyzed statistically presented in the form of matrices is to be broken down into a relatively small number (previously known or not) of homogeneous groups or classes.
To formalize this problem it is convenient to interpret the analyzed objects as points in the corresponding feature space.
If the source data is presented in the form of the matrix X, then the points are a direct geometric image of multivariate observations Хt Х2, …, Хp in the p-dimensional space PR (X) with the coordinate axes Ох(1), Ох(2), …, Ох(р);. It is natural to assume that the geometric proximity of the two or several points in this space means closeness of “physical” states of the respective objects, their homogeneity. Then the problem of classification is to divide the analyzed set of points, observations into a relatively small number of (previously known or not) classes so that the objects belonging to the same class would be at relatively short distances from each other. The resulting declassification is often called clusters (taxones, images), and methods of their location are cluster analysis respectively, numerical taxonomy, pattern recognition with self-training.
Speculation
In theory and practice of multidimensional classification a whole set of practical implementations of research tasks is reduced to two types.
The first type is the usual partitioning issue for a statistically surveyed (p-dimensional) adjustment range of analyzed features into intervals (hot spots) of grouping. As a result, the investigated set of objects is partitioned into a number of groups so that one group of such objects is separated by a relatively small distance (a multidimensional analogue of the grouping interval constructing issue within dimensional observation).
The second type is an attempt to define the natural stratification of the original observations on distinct clusters, clots, lying to each other at a distance, but not subsequent to the dividing equally distant parts. In the probabilistic interpretation (i.e. if you interpret classifying observations X1, Х2, …, Хp as a sample from a multivariate general set described by the density function or ground distribution f(X), as a rule, are not known to the researcher), the second issue can be formulated as the issue of identifying areas of increased density of observations, i.e. the areas of possible values of the analyzed multidimensional X feature, which corresponds to local maxima of the function f(X).
If the first issue is the issue of grouping area constructing and the issue always has a solution, then in the second statement, the result can be negative: it may be that a lot of original observations do not detect the natural division into clusters (for example, form a common cluster).
In the second case, it is not so important to determine the exact number of clusters with the right elements in each cluster (unattainable ideal case). It is important to effectively allocate p multidimensional points in p-dimensional space (p variables measurement) justified by reliable and cost-effective manner [15].
The above allows us to set the working speculation of this study as the assumption that all possible state space (a technical condition estimation parameter) of the unit is divided into a finite set of classes (clusters, taxones), which are located compactly and have explicit grouping centers (gravity centers).
Let the technical condition of each special oil and gas field equipment unit plurality is О = {Oi: i = 1, 2, …, M} entering the CRTC (in this case engine) is characterized by a set of X features (technical condition parameters), allowing quantification, i.e. the feature is determined by the actual number X = {Х jmin £ Х j £ Х jmax} = {Xj : j = 1, 2, …, N}.
Each technical condition meets the N-dimensional X vector, which determines the point in the corresponding vector space, forming a matrix X = {Xij} (see Table 1). X vector means the cost of the identification and elimination of specific defects.
Let us introduce the category concept, as a combination of the points generated by a particular decision rule (set of rules). In general, the recognition of a given categories’ number is based on the following principle: first, separate the first category from the others, then, separate the second one from the rest, and so on. Then, we set a rule for X vector plurality. According to this rule, the points of X space fall into one of the categories. The rule may have the form of equation F(X) = 0 of the surface separating the X space to a predetermined number of parts. If the Xij point corresponding to a situation is located on one side of the surface, it belongs to the same category, and if on the other one, it belongs to another. Mathematically, this means that in the first case F(Хij) > 0, and the second is F(Хij) < 0. Now, the identification issue is reduced to F(X) function recognition. The search starts with the simplest form, as follows:
i.e. a linear form, describing the plane (or more precisely, the hyper plane) in N-dimensional X space. If the linear form
cannot be used, then search for a system of functions yi, = fi (X), such that
i.e. instead of the original nonlinear function F(X) in the X space, we are searching for a linear F(Y) function in the modified Y-space.
Table 1 : Original Data Matrix
| Classification Vol. | Classification Parameters, Xi | |||||
| X1 | X2 | … | Xj | … | XN | |
| O1 | X11 | X12 | … | X1j | … | X1N |
| O2 | X21 | X22 | … | X2j | … | X2N |
| … | … | … | … | … | … | … |
| Oi | Xi1 | Xi2 | … | Xij | … | XiN |
Methodology Development
In general, the search for equations F(Х) = 0 or F(Y) = 0 is that the software serving as recognition, is imposed with a sequence of vectors Хj and Yj and reported which vector of this sequence belongs to the same category, and which one belongs to another. It is proved that under such a procedure, recognition software finds the equation of separating surface in a finite number of steps [16].
In applying the cluster analysis, according to the accepted working speculation, there is the assumption that points of the X space belonging to the same category are located compactly and have clearly expressed grouping center, sort of a “gravity center”.
Let each point describing in the X space a certain image or situation is a “material” point having a “mass” that conventionally equals 1. Then, the grouping center can be a mass center (gravity center) of the points belonging to this class. The coordinates of the material points system mass center is given by the following formula:
where Q is a number of points included in this category,
mj is a mass of j-th point.
The j-th point’s mass refers to the cost of fixing the j-th defect.
We assume that the number of categories is two, and finding the coordinates of their grouping centers, connect the centers with line segment, and then dividing this segment in half, we construct a plane passing through the point of division and perpendicular to the segment. The equation of this plane is the required separating rule type (1), if done in the original construction of the X feature space, or a type (2) if it is held in the Y space.
Assuming that the X space is Euclidean, to determine the distances between the points X1 and Х2 with coordinates of (x11, x12, …, x1n) and (x21, x22, …, x2n), we use one of the mahalanobisskiy metrics, it is the type of adaptive metrics of ” city-block” type (the so-called Manhattan metrics):
To get started the optimization algorithm, we exercise a parameters’ valuation of the original X matrix by the formula:
Then, choose a decision rule from the form (1) or (2) taking into account the dimension of the X feature space.
Using the normalized values of the engines’ technical condition, calculated according to the formula (6), determine the coordinates of individual taxones and the clusters’ (categories) gravity center for the selected S0k partition.
Substituting the values of the taxones’ coordinates of k-th cluster in the equation of the selected decision rule, check the correctness of the S0k partition. At its confirmation, we eliminate the engines’ values {Xij} constituting the k-th cluster and proceed to calculate the coordinates of the taxones’ gravity center and k + 1-th cluster.
If the correctness of the S0k partition is not confirmed, once again we choose the decision rule (1) or (2) and repeat the formation procedure for the optimal composition of the S0k partition clusters.
After the procedure, optimizing the composition of the S0k partition clusters and calculation of the total costs of each cluster, go to the S0k+1 partition and repeat the steps above until the end of the formation of the optimal composition of the S0k+1 partition clusters, etc.
Increasing the k number continues as long as the total costs of the clusters start to increase. At this step, the calculation stops considering the S0оп partition is optimal, as well as the thus obtained clusters composition.
The resulting clusters composition uniquely determines the composition and content of the technological repair routes of considered unit batch.
Results
General
The purpose of experimental research was to form the initial set of control and diagnostic operations, controls for engine components in the process of repair, and the collection of data about the physical and cost parameters of control, diagnostic and process equipment. These data were used later in justifying the number and composition of the RWC.
In developing the methodological and metrological assurance [17] for the experimental studies, we formed structure and effect model of the engine as a control object; selected the analyzed means of determining the technical condition of engine components at different stages of diagnosis; made planning the number of the observed objects.
The developed technique of experimental studies included a pre-repair diagnosis of the engines, the definition of a technical condition of their elements in the process of disassembly by repair diagnosis, micrometrics of parts and assessment of the repair quality on the acceptance diagnosis. The method of processing the experimental results reveals interactions between diagnostic, structural and dimensional parameters at pre-repair, repair and acceptance diagnosis.
For experimental studies, we used industrial and technological base and repair fund of the Production Service Central Base for Rental and Repair of Oilfield Equipment and Attachments (PSCB RR OEA) located in Surgut.
The initial sample of objects of experimental studies of YaMZ-238 engines, formed with the principle of equal selection consisted of 52 engines, 45 units could be subjected to the pre-repair diagnostics. It was found that the combined values of diagnostic parameters are advisable to repair 37 engines on technical conditions. They were dismantled, diagnosed during disassembly, and their parts were micro measured.
To determine the range of structural and diagnostic recommendations parameters’ nomenclature, we used the recommendations [18, 19]. The list of defects and their dimensional parameters is made using the appropriate technical standards and reference literature [4, 20-22].
Statistical analysis of the experimental studies’ results allowed us to estimate the stochastic relationship between diagnostic, structural and dimensional engines’ parameters. On the basis of a multi-step analysis, we counted more than 50 multiple regression relationships between these parameters. Successive elimination of statistically insignificant factors revealed 24 empirical relationships, the importance of which was confirmed by the high values of multiple determination coefficients.
The final formation of the initial set of monitored parameters in the process of parameters’ disassembly was made by decomposition of the total variance of the response function in the corresponding regression relationship on the two components: the total variance explained by the influence of the parameter under consideration, and a part of the total variance explained by the influence of unaccounted factors. The final decision on the inclusion of the parameter to the original set was accepted if the second component did not exceed the first one.
Thus, according to the experimental studies’ results, the original set includes 7 diagnostic, 8 structural and 11 dimensional parameters, based on which we have formed a repair work complex [9].
Developed Methodology Application
Since the results of multidimensional taxonomy are impossible to clearly illustrate by graphic material, in this article the example of the two-dimensional realization of optimization calculations for two parameters is Z2, the value of air leaks at top dead center (TDC), and Z3, the oil pressure in the main oil pipeline, characterizing the technical state, respectively the cylinder and piston, and crank mechanism of the engine. [9]
It should be noted that when setting the S0k initial partition for the repaired engines into categories, the choice of the k parameter value was made with the following considerations.
- For k=1, the number of S0k categories equals to one, which corresponds to the most expensive category of repair, overhaul, and in this case does not make sense.
- Semantic evaluation of optimization calculations on number and the RWC composition was conducted in the light of the author’s research covered in the analysis.
In general, the cost characteristics calculation of individual taxones and clusters is made by the formula:
where Сicd is the cost of performing control and diagnostic operations in i-th engine,
Сiextra and Сido are losses from doing unnecessary work and failure to eliminate the defects,
Сkorg is generalized costs of organizing workplaces on the k-th.
Now, let us consider an example in which we will focus on the classification of parameters’ combinations, defining technical condition of the engine mechanism in the CRTC system (for example, the cylinder and piston) using the procedure for constructing the dividing surface described above. For simplicity and perspicuity, we use only two classification features: Z2 and Z3 parameters). The parameter summary for thirty-seven diagnosed engines YaMZ-238 during experimental studies, along with the absolute values of parameters, and relative (normalized) values of the parameters and their value equivalent are shown. We also used information about the engine operational kilometers.
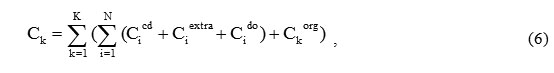
We divide the engines into three categories, i.e. take k=3. We calculate values in Manhattan metrics, where dH is an algebraic data sum. The calculation results are presented graphically in Figure 1.
 |
Figure 1: Normalized Z2 and Z3 parameter value sums distribution |
Those units where dH < -2.45 belong to the 1st category; those where dH > 2.45 belong to the 3rd one, the remaining ones belong to the 2nd one.
Note that the correlation coefficient between the values of dH and operating time is equal to -0.685 that means the dependence close to the inverse: the more M (i.e. the lower the oil pressure and air leaks parameter value sum), the fewer engine operating hours, the cheaper its repair.
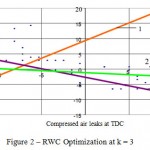 |
Figure 2: RWC Optimization at k = 3 |
We present the data in a graph in Figure 6, considering the relative value of compressed air leaks in TDC as X coordinate, and the value of the oil pressure as Y coordinate. Since in our example, the feature space is two-dimensional, the dividing surface turns into a line whose equation has the following form (Line 1 in Figure 2):
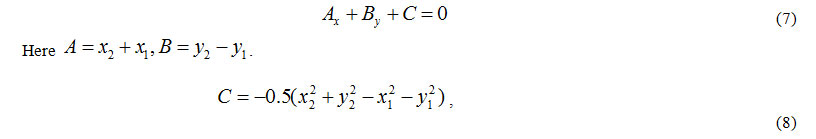
where x1, у1, х2, у2 are coordinates of the grouping centers of the divided categories.
If in equation (8) with A1, B1 and C1 coefficients, we substitute coordinates of the 1st category points, the calculation results will be negative. When substituting the coordinates of 2nd and 3rd category points, results are positive. This testifies to the correctness of equation (7).
Now, divide 2 and 3 categories. Performing calculations with center coordinates by the formulas (8), find A2, B2 and C2 coefficients (Line 3 in Figure 2). Test results show that the six engines are classified incorrectly. The percentage of misclassification is equal to (6/37) x 100 = 16.29, and cannot be considered satisfactory.
In the end, the iterative process picks a linear function having classification error e = 0.0019. Thus, the optimization process for S0k at k = 3 is completed.
The results of similar optimization calculations for the values of k = 2 ¸ 7 are shown in Table 2.
Table 2: The results of similar optimization calculations for the values of k = 2 ¸ 7
| Number of Categories (k) | Number of Engines in Category | Total Costs, thous. rub | Optimality,
— / + |
| 2 | 16, 21 | 2,937 | — |
| 3 | 10, 29, 8 | 2,561 | — |
| 4 | 7, 12, 10, 8 | 2,126 | — |
| 5 | 4, 7, 12, 9, 5 | 1,983 | — |
| 6 | 3, 6, 10, 8, 6, 5 | 2,218 | + |
| 7 | 2, 4, 8, 8, 6, 6, 3 | 2,341 | + |
Multidimensional optimization implementation of the RWC in 7 diagnostic parameters has pushed the number of effective RWC to the smaller value (4 instead of 5 with two state parameters) that, in fact, confirms the findings of many years of research. Results of multidimensional classification are presented in the graph (Figure 3).
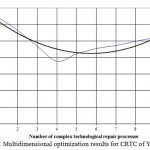 |
Figure 3: RWC Multidimensional optimization results for CRTC of YaMZ-238 engines |
The economic effect of the developed method implementation for optimizing the RWC number and composition has been read by calculating the difference between the RWC organization costs (overhaul), and calculated and optimal number of the RWC, four in condition of PSCB RR OEA and is 3,548 rubles for the repair of one engine per year.
Conclusion
The results of the research can draw the following conclusions.
- The formation mechanism of the repair technological processes and application of advanced information technologies should be revised.
- The multidimensional taxonomy and, in particular, cluster analysis are the most effective in solving issues of flexible technological processes. To ensure sufficient accuracy, we can use information obtained in pre-repair diagnosis of the units.
- The total costs include the implementation of control and diagnostic operations, losses from unnecessary operations and failure to eliminate the defects due to errors of diagnosis, the costs of organizing jobs.
- In contrast to previous studies, the RWC number and composition are not determined in advance, but formed for each vehicle unit batch received for the repair.
- To identify the relationship between diagnostic, structural and dimensional parameters of the YaMZ-238 engines, we have performed an experiment in which 45 of the 52 surveyed engines were diagnosed, dismantled, and their parts were micro measured.
- As a result of statistical processing of experimental data, we have set dependences between diagnostic, structural and dimensional parameters of the engines’ technical condition, which formed the information base for the calculation of the number and composition of repair work complex.
It should be noted that the results of studies are not complete. The possible prospects for further research on the topic can be defined such as the use of the mathematical apparatus of artificial neural networks for solving the problem of identifying the technical condition of the vehicle units and their distribution range of repair works at centralized repair according to their technical condition.
Reference
- Dehterinsky, L.B. and V.I. Karagodin 1980. Concentration and specialization of repair production: Manual. Moscow: MADI, pp: 82.
- Dehterinsky, L.V. and V.I. Karagodin, 1985. Design Process of details with using of computers: Manual. Moscow: MADI, pp: 63.
- Karagodin, V.I., V.N. Krasovskii and S.A. Skripnitsov, 1999. The use of information technology in centralized repair of vehicle engines according to technical condition. Problems of information technologies development. Minsk: IAIT, pp: 81-90.
- Dehterinsky, L.V., K.H. Akmaev, V.P. Apsin and others, 1992. Repair of vehicles: Textbook for high schools. Moscow: Transport, pp: 295.
- Karagodin, V.I, 2011. Centralized on-condition repair: Monograph. Moscow: Tehpoligraftsentr, pp: 94.
- Koshkin, K.T., 1960. Route technology for vehicle part repair. Moscow: Avtotransizdat, pp: 216.
- Dyumin, I.E., 1987. Improving the efficiency of vehicle engine repair. Moscow: Transport, pp: 176.
- Kramarenko, G.V., 1984. Technical operation of automobiles. Moscow: Transport, pp: 398.
- Poptsov, V.V., 2002. Centralized repair technologies application for units on-condition repair in small-scale production, PhD thesis, Tyumen.
- Karagodin, V.I. and N.N. Mitrokhin, 2014. Vehicle and engine repair: a tutorial. Moscow: Academy, pp: 496.
- Karagodin, V.I. and A.V. Malakhov, 1978. Method to identify typical combinations of repairs to ensure efficiency of cars. Improving the efficiency and quality of repair of cars and road cars. Moscow: MADI, pp: 27-34.
- Krasovskii, V.N., 2009. Centralized on-condition unit repair of the automobile and oil and gas field machinery by manufacturers. Tyumen: Vector-Book, pp: 164.
- Classification and cluster, 1980. Ed. J. Van Rayzin, Trans. from English. Moscow: World, pp: 389.
- Williams, W.T. and D.N. Lance, 1986. Methods of hierarchical classification. Statistical methods for computer. Ed. M.B. Malyutov. Moscow: Science, pp: 269-301.
- Mandel, I.D., 1988. Cluster analysis. Moscow: Finance and Statistics.
- Aivazyan, S.A., V.M. Buchstaber, I.O. Enyukov and L.D. Meshalkin, 1989. Applied statistics: classification and reduction of dimension. Reference books. Moscow: Finance and Statistics, pp: 608.
- Karagodin, V.I., 1978. The choice of input control means for the automobile units, repaired by technical condition. Improving the efficiency and quality of repair of cars and road cars. Moscow: MADI, pp: 27-34.
- GOST 20911-89. Technical diagnostics. Terms and definitions.
- GOST 23435-79. Technical diagnostics. Reciprocating internal combustion engines. Nomenclature of diagnostic parameters.
- GOST 25044-81. Technical diagnostics. Diagnosis of cars, tractors, agricultural, building and road machines. Main provisions.
- RD-200-RSFSR-15-0150-81. 131. Guidelines for the diagnosis of the technical condition of the road transport rolling stock, 1981. Moscow: STIHO Minavtotrans RSFSR.
- Spichkin, G.V., B.L. Libin and A.M. Tretyakov, 1983. Diagnosis of vehicle technical condition. Moscow: Higher School, pp: 368.

This work is licensed under a Creative Commons Attribution 4.0 International License.


